. 2024 Oct 18;10(42):eadn3057.
doi: 10.1126/sciadv.adn3057. Epub 2024 Oct 18.

Lineage tracing of stem cell-derived dopamine grafts in a Parkinson's model reveals shared origin of all graft-derived cells

Affiliations

Lineage tracing of stem cell-derived dopamine grafts in a Parkinson's model reveals shared origin of all graft-derived cells

Petter Storm et al. Sci Adv. .

Abstract

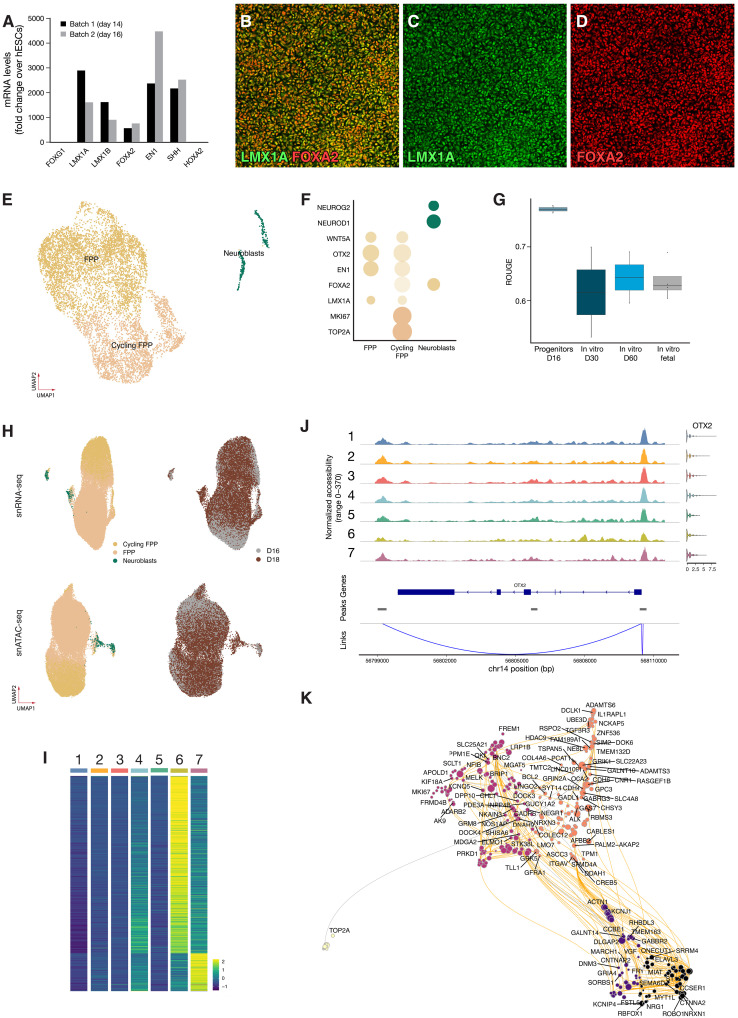
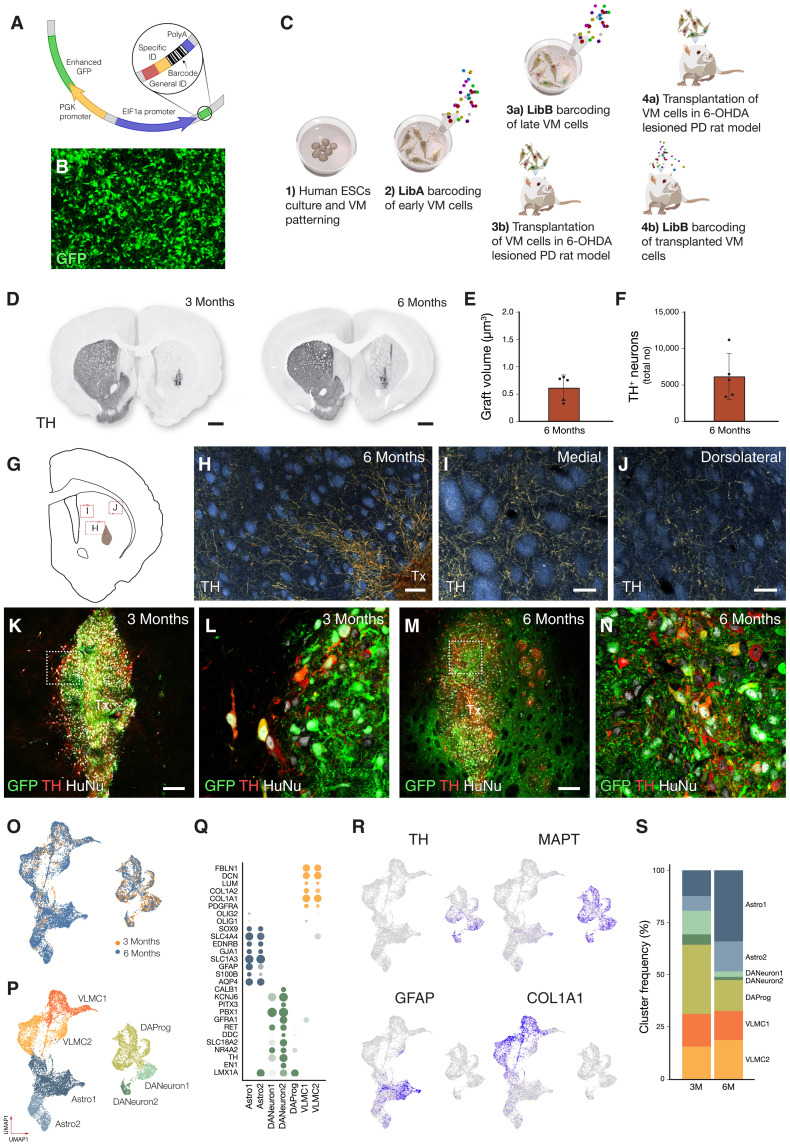
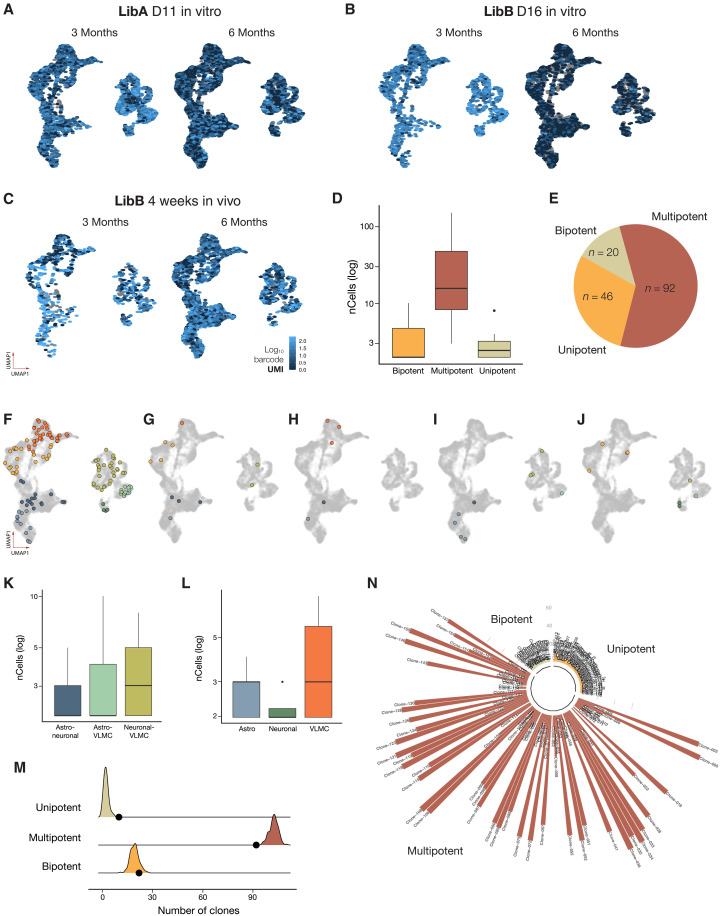
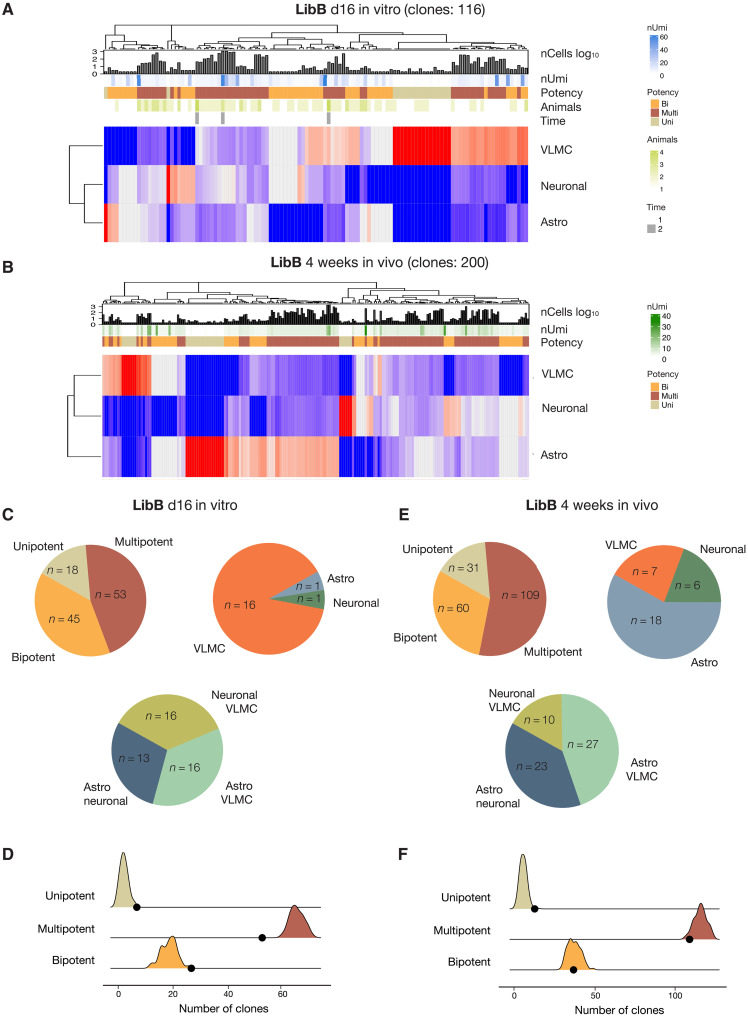
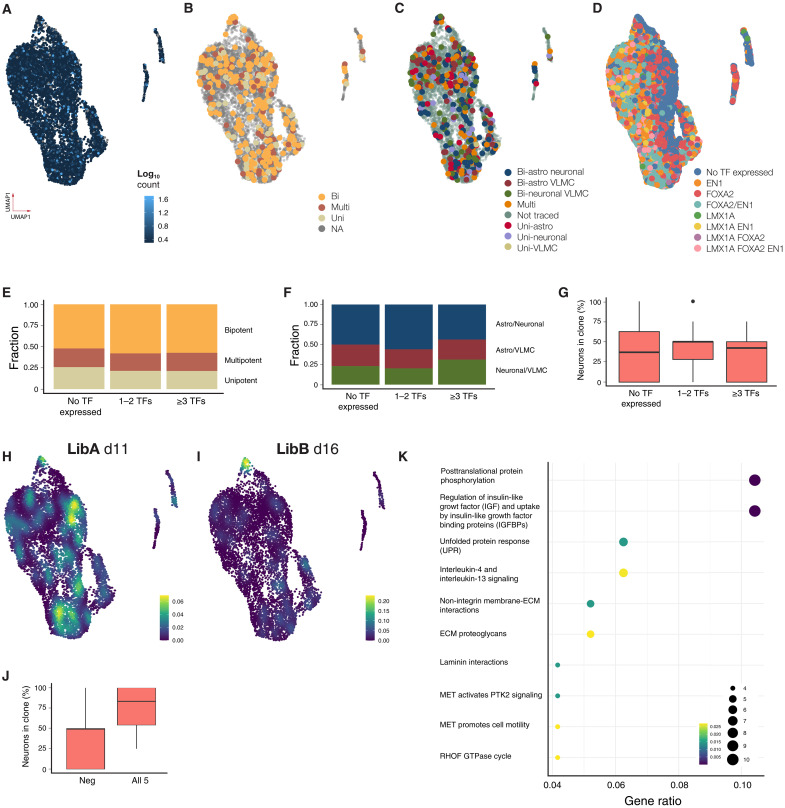
Stem cell therapies for Parkinson's disease are at an exciting time of development, and several clinical trials have recently been initiated. Human pluripotent stem cells are differentiated into transplantable dopamine (DA) progenitors which are proliferative at the time of grafting and undergo terminal differentiation and maturation in vivo. While the progenitors are homogeneous at the time of transplantation, they give rise to heterogeneous grafts composed not only of therapeutic DA neurons but also of other mature cell types. The mechanisms for graft diversification are unclear. We used single-nucleus RNA-seq and ATAC-seq to profile DA progenitors before transplantation combined with molecular barcode-based tracing to determine origin and shared lineages of the mature cell types in the grafts. Our data demonstrate that astrocytes, vascular leptomeningeal cells, and DA neurons are the main component of the DAergic grafts, originating from a common progenitor that is tripotent at the time of transplantation.


Figures

Fig. 1.
Fig. 1.. Multiomic characterization of VM progenitors.
(A) Quantitative PCR quantification of midbrain markers in progenitors at days 14 and 16 (D16). (B to D) Representative confocal images of DA progenitors of high homogeneity coexpressing FOXA2 and LMX1A. (E) UMAP visualization of scRNA-seq data from progenitors before grafting (n = 8166) colored by cell type. (F) Dot plot of key progenitor markers expression per cell type. (G) Boxplot showing cell purity for each dataset as assessed by ROGUE (n = 2 to 4). (H) UMAP visualization of integrated snATAC- and snRNA-seq of progenitors from days 16 and 18 (n = 2 replicates per time point) colored by predicted cell type and day. (I) Differentially accessible peaks (false discovery rate adjusted P < 0.05) for any subcluster; see also fig. S1 [(C) and (D)]. (J) Linked peaks with transcription of OTX2 across clusters show no differential accessibility across clusters. (K) UMAP embedding of the inferred Pando-based TF network in DA progenitors.
Fig. 2.
Fig. 2.. Succesful grafting and snRNA-seq characterization of midbrain grafts.
(A) Schematic of lentiviral vector used for lineage tracing. (B) Representative confocal image of progenitors expressing GFP, indicative of successful transduction. (C) Experimental design for combined clonal tracing and transcriptomics in neural grafts. (D) Neuron and TH-rich grafts were analyzed 3 and 6 months after transplant (representative images from n = 8 for each time point). (E and F) Quantification of graft volume and TH+ neurons. (G) Schematic of the striatal region from where panels (H) to (J) were captured. (H to J) Dark field microscopy of TH staining confirming extensive DA innervation. Tx, transplant. (K to N) In grafts from cells that received LibA and LibB in vitro, there is a complete colocalization of GFP and human grafted cells. Inset shows GFP+ TH+ cells. (L) In grafts where LibB was delivered to the grafted cell 1 month after transplant, GFP can be detected both in graft and host parenchyma. (O and P) UMAP visualization of stem cell–derived cells (n = 14,414) from 12 rats colored by graft age (O) and cell type (P). (Q) Dot plot of key marker genes showing % of cells expressing and expression level of indicated genes. (R) Featureplots of key genes to distinguish DA neurons [TH and microtubule associated protein tau (MAPT)], astrocytes (GFAP), and VLMC (COL1A1). (S) Bar plot of % of identified cell types in short-term (3 months, n = 6) and long-term (6 months, n = 6) grafts.
Fig. 3.
Fig. 3.. Clonal dynamics derived from progenitors barcoded at day 11.
(A to C) Expression level of dominant viral barcode derived from LibA and LibB delivered at day 11, day 16, and week 4, respectively (n = 6 rats for LibA and n = 3 for each of LibB day 16 and LibB week 4). (D) Clone size per potency after barcode delivery at day 11. Lower and upper hinges correspond to the first and third quartiles, and the whisker extends from the hinge to the largest value no further than |1.5 * IQR| from the hinge (where IQR is the interquartile range or the distance between the first and third quartiles). (E) Proportion of clone types identified. (F and G) Representative multipotent clones containing all three major cell types. (H to J) Representative clone plots of bipotent clones. (K) Clone sizes of bipotent clone pairs detected after delivery of barcode library at day 11. (L) Clone sizes of unipotent clones detected after delivery of barcode library at day 11. (M) Simulation results when generating 10,000 random clones without any fate bias. Shaded areas indicate result of simulation, and black dots indicate results from the actual data. (N) Manhattan plot of clone sizes for day 11 clones colored by potency.
Fig. 4.
Fig. 4.. Progressive fate restrictions of day 16 and week 4 in vivo barcoded progenitors.
(A and B) Heatmap of cell distribution in clones present in the mature graft following barcode delivery at day 16 (A) and week 4 in vivo (B) where each row corresponds to one clone. Red indicates high number of cells, and blue indicates low number of cells. Row annotation gives nUmi = average expression level of viral transcript; nCellslog10 = clone size; potency = uni/bi/multipotency; animals = number of animals where the clone was detected; and time whether the clone was detected in both short- and long-term experiment. (C and E) Proportion of multipotent, bipotent pairs, and unipotent clones detected after barcode delivery at day 16. (D and F) Simulation results of unbiased clones compared to real data. See also Fig. 3D.
Fig. 5.
Fig. 5.. Clonal capacity and transcriptional profile of day 18 progenitors pretransplantation.
(A to D) UMAP visualization of scRNA-seq from barcoded progenitors (n = 8166, two replicates) colored by barcode transcription level (A), their major clonal (LibA) (B), subclonal capacity (LibA) (C), and VM TF expression (D). NA, not available. (E to G) Fate of progenitors expressing no, one, two, or at least three VM TFs in terms of major clonal fraction (E), bipotent fraction (F), and fraction neurons (G). (H and I) Density plot of progenitors giving rise to neuronal biased clones barcoded at day 11 (H) or day 16 (I). (J) Fraction of neurons in clones expressing top five genes associated with neuronal fate compared to the rest. (K) Pathway analysis of genes associated with neuron biased progenitors at day 16. ECM, extracellular matrix; MET, metanephrine; GTPase, guanosine triphosphatase; PTK2, Protein Tyrosine Kinase 2; RHOF, Ras Homolog Family Member F.

References

    1. Barker R. A., Drouin-Ouellet J., Parmar M., Cell-based therapies for Parkinson disease—Past insights and future potential. Nat. Rev. Neurol. 11, 492–503 (2015). - PubMed
    1. Kirkeby A., Nelander J., Hoban D. B., Rogelius N., Bjartmarz H., Storm P., Fiorenzano A., Adler A. F., Vale S., Mudannayake J., Zhang Y., Cardoso T., Mattsson B., Landau A. M., Glud A. N., Sørensen J. C., Lillethorup T. P., Lowdell M., Carvalho C., Bain O., van Vliet T., Lindvall O., Björklund A., Harry B., Cutting E., Widner H., Paul G., Barker R. A., Parmar M., Preclinical quality, safety, and efficacy of a human embryonic stem cell-derived product for the treatment of Parkinson’s disease, STEM-PD. Cell Stem Cell 30, 1299–1314 (2023). - PubMed
    1. Piao J., Zabierowski S., Dubose B. N., Hill E. J., Navare M., Claros N., Rosen S., Ramnarine K., Horn C., Fredrickson C., Wong K., Safford B., Kriks S., El Maarouf A., Rutishauser U., Henchcliffe C., Wang Y., Riviere I., Mann S., Bermudez V., Irion S., Studer L., Tomishima M., Tabar V., Preclinical efficacy and safety of a human embryonic stem cell-derived midbrain dopamine progenitor product, MSK-DA01. Cell Stem Cell 28, 217–229.e7 (2021). - PMC - PubMed
    1. Doi D., Magotani H., Kikuchi T., Ikeda M., Hiramatsu S., Yoshida K., Amano N., Nomura M., Umekage M., Morizane A., Takahashi J., Pre-clinical study of induced pluripotent stem cell-derived dopaminergic progenitor cells for Parkinson’s disease. Nat. Commun. 11, 3369 (2020). - PMC - PubMed
    1. Tiklová K., Nolbrant S., Fiorenzano A., Björklund Å. K., Sharma Y., Heuer A., Gillberg L., Hoban D. B., Cardoso T., Adler A. F., Birtele M., Lundén-Miguel H., Volakakis N., Kirkeby A., Perlmann T., Parmar M., Single cell transcriptomics identifies stem cell-derived graft composition in a model of Parkinson’s disease. Nat. Commun. 11, 2434 (2020). - PMC - PubMed

Publication types