. 2024 Oct 18;10(42):eadp1115.
doi: 10.1126/sciadv.adp1115. Epub 2024 Oct 18.

Astrocytic GLUT1 reduction paradoxically improves central and peripheral glucose homeostasis

Affiliations

Astrocytic GLUT1 reduction paradoxically improves central and peripheral glucose homeostasis

Carlos G Ardanaz et al. Sci Adv. .

Abstract

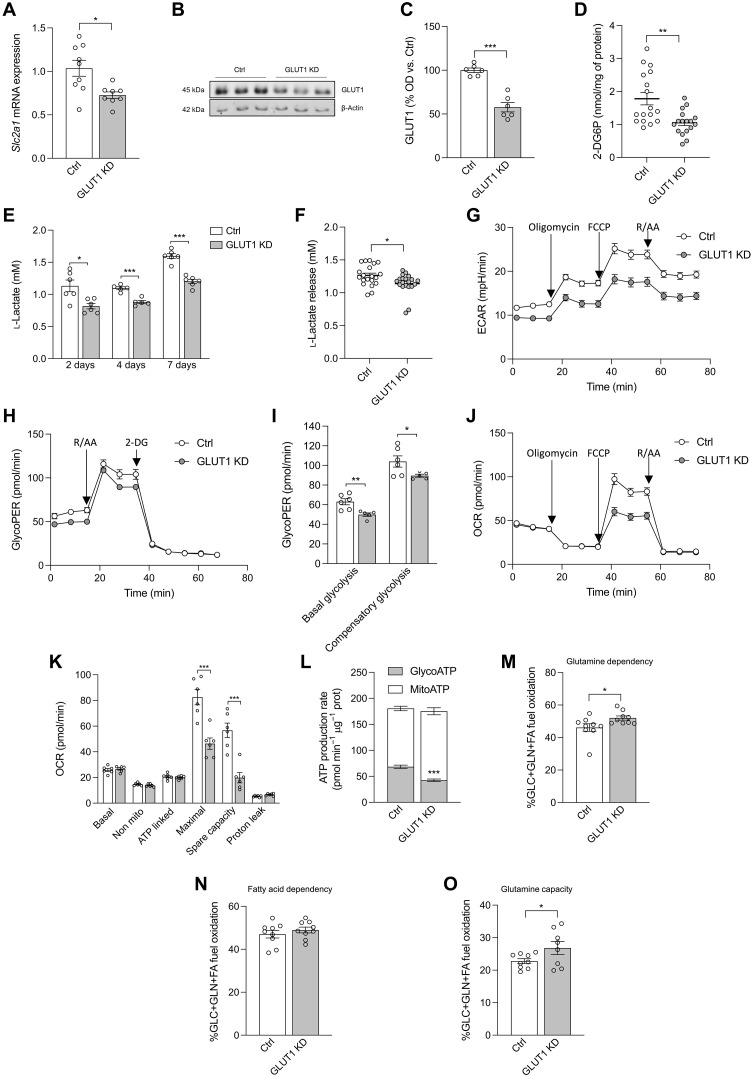
Astrocytes are considered an essential source of blood-borne glucose or its metabolites to neurons. Nonetheless, the necessity of the main astrocyte glucose transporter, i.e., GLUT1, for brain glucose metabolism has not been defined. Unexpectedly, we found that brain glucose metabolism was paradoxically augmented in mice with astrocytic GLUT1 reduction (GLUT1ΔGFAP mice). These mice also exhibited improved peripheral glucose metabolism especially in obesity, rendering them metabolically healthier. Mechanistically, we observed that GLUT1-deficient astrocytes exhibited increased insulin receptor-dependent ATP release, and that both astrocyte insulin signaling and brain purinergic signaling are essential for improved brain function and systemic glucose metabolism. Collectively, we demonstrate that astrocytic GLUT1 is central to the regulation of brain energetics, yet its depletion triggers a reprogramming of brain metabolism sufficient to sustain energy requirements, peripheral glucose homeostasis, and cognitive function.


Figures

Fig. 1.
Fig. 1.. GLUT1 is fundamental for astrocytic glucose uptake and metabolism but not to maintain total ATP production.
(A) Slc2a1 mRNA expression levels in primary cultured astrocytes without [control (Ctrl)] or with (GLUT1 KD) Cre recombination (n = 8 to 9 independently isolated astrocyte cultures). (B) GLUT1 protein expression level representative Western blot image and (C) quantification [optical density (OD)] in primary cultured astrocytes in Ctrl and GLUT1 KD cells (n = 6 independently isolated astrocyte cultures). (D) Glucose uptake in Ctrl and GLUT1 KD cultured astrocytes (n = 17 independent wells). (E) l-Lactate release in culture medium in Ctrl (Ctrl) and GLUT1 KD cultured astrocytes (in mM; n = 6 independently isolated astrocyte cultures). (F) l-Lactate release in culture medium after glucose starvation and subsequent glucose stimulation (in mM; n = 20 independent wells). (G) Glycolytic flux assessed by extracellular acidification rate (ECAR) in Ctrl and GLUT1 KD cultured astrocytes (n = 9 independent wells). FCCP, carbonyl cyanide-4 (trifluoromethoxy) phenylhydrazone; R, rotenone; AA, antimycin A. (H) Glycolysis-derived proton efflux rate (GlycoPER) assessment and (I) quantification of basal and compensatory glycolysis in Ctrl and GLUT1 KD cultured astrocytes (n = 6 independent wells). 2-DG, 2-deoxiglucose. (J) Mitochondrial respiration evaluation by oxygen consumption rate (OCR) and (K) quantification of mitochondrial respiration evaluation in Ctrl and GLUT1 KD cultured astrocytes (n = 9 independent wells). (L) Glycolysis- and mitochondrial respiration–derived ATP production rate in Ctrl and GLUT1 KD cultured astrocytes (n = 9 independent wells). (M) Glutamine dependency and (N) fatty acid dependency assay (n = 9 independent wells). (O) Glutamine oxidative capacity assessment (n = 9 independent wells). Data are presented as means ± SEM. *P ≤ 0.05, **P ≤ 0.01, and ***P < 0.001, as determined by two-tailed Student’s t test in all cases.
Fig. 2.
Fig. 2.. Inducible in vivo depletion of astrocytic GLUT1 modifies astrocyte morphology.
(A) Strategy used to generate mice lacking GLUT1 transporter specifically in astrocytes (GLUT1ΔGFAP) and their Ctrl littermates (GLUT1f/f). Created with BioRender.com. (B) GLUT1 mRNA levels, (C) protein expression level quantification (OD), and (D) representative Western blotting image in Ctrl and GLUT1ΔGFAP mice after ACSA-2+ fluorescence-activated cell sorting (FACS)–mediated separation of astrocytes (n = 5 to 6 mice per group). (E) Representative glial fibrillary acidic protein (GFAP; red)–4′,6-diamidino-2-phenylindole (DAPI; blue) cell micrograph and its respective reconstruction obtained from stratum radiatum astrocytes of Ctrl and GLUT1ΔGFAP mice (representative image of n = 6 per group). Scale bar, 50 μm. (F) Quantification of the processes’ total length, (G) number of processes, (H) GFAP process volume, and (I) Sholl analysis representing the astrocyte complexity (n = 6 animals per group and 10 astrocytes per animal). Data are presented as means ± SEM. *P ≤ 0.05 and ***P ≤ 0.001, as determined by two-tailed Student’s t test. ip, intraperitoneal.
Fig. 3.
Fig. 3.. Inducible in vivo depletion of astrocytic GLUT1 enhances CNS glucose utilization and shifts the whole energetic profile of the brain.
(A) PET images of representative mice showing brain 18F-FDG signal, (B) the quantification of positron emission [mean standardized uptake value (SUV)], and (C) ex vivo counting of radioactivity in dissected brain samples (n = 8 mice per group). (D) CSF glucose presence 30 min after intraperitoneal vehicle or glucose injection in Ctrl and GLUT1ΔGFAP mice (n = 4 to 5 mice per group). (E) Schematic representation of U-13C-glucose infusion and subsequent astrocyte sorting. Created with BioRender.com. (F) Quantification of U-13C-glucose in sorted astrocytes (n = 9 to 10 mice per group). (G) Hippocampal and (H) hypothalamic PLS graphs of comparison between Ctrl and GLUT1ΔGFAP mice. The graph shows the dispersion of the different individuals by genotype, where a clear grouping of the Ctrl group and GLUT1ΔGFAP is seen, meaning differences in the metabolic profile of both groups (n = 9 mice per group). (I) Quantification of hippocampal and hypothalamic lactate levels in metabolomics studies (n = 9 mice per group). (J) Weighted gene coexpression network analysis (WGCNA) blue module gene ontology (GO) Biological Processes showing significant fold enrichment when comparing Ctrl and GLUT1ΔGFAP mice (n = 6 per group). Data are presented as means ± SEM. *P ≤ 0.05 and **P ≤ 0.01, as determined by two-tailed Student’s t test (B to D and F) and two-way analysis of variance (ANOVA) (I). a.u., arbitrary units.
Fig. 4.
Fig. 4.. Mice lacking GLUT1 in astrocytes exhibit improved glucose homeostasis.
(A) Fasting-induced hyperphagic response and (B) 4-hour accumulated food intake after intraperitoneal injection of glucose (n = 3 to 21). (C) Glucose tolerance test (GTT) and the quantification of the area under the curve (AUC) and (D) glucose-stimulated insulin secretion [GSIS; n = 25 to 40 in (C); n = 8 in (D)]. (E) Representative pancreatic islet image (n = 4 and 10 islets per mouse). Scale bar, 100 μm. (F) Respiratory exchange rate (RER) and (G) energy expenditure (n = 4). Gray bars denote dark phases. (H) Representative c-Fos staining of POMC neurons of ARC and (I) quantification of c-Fos+–POMC cells (n = 4 and 2 slices per mouse). Scale bar, 50 μm. (J) GFAP-labeled processes in contact with POMC neurons in the ARC of mice in HFD, 30 min after intraperitoneal glucose injection. Scale bar, 10 μm. (K) Hematoxylin and eosin (H&E) staining of brown adipose tissue (n = 6 and 2 slices per mouse). Scale bar, 100 μm. (L) Ucp1 mRNA expression (n = 8). (M) Rectal temperature upon cold exposure (+4°C) for 4 hours (n = 12 to 20). (N) Representative illustration and immunostaining image depicting the area infected by adeno-associated virus 5 (AAV5)–hGFAP-Cre–internal ribosomal entry site (IRES)–green fluorescent protein (GFP) and GFAP immunoreactivity (n = 7 to 10). Scale bar, 500 μm. Created with BioRender.com. (O) GTT and quantification AUC and (P) GSIS in ARC-specific astrocytic GLUT1-ablated (ARC-GLUT1ΔGFAP) mice [n = 5 to 10 in (O); n = 4 in (P)]. Data are presented as means ± SEM. *P ≤ 0.05, **P ≤ 0.01, and ***P ≤ 0.001, as determined by repeated-measurement ANOVA (A, C, D, M, O, and P) and two-way ANOVA followed by Tukey [(B and C) AUC and (F, G, I, L, and O) AUC].
Fig. 5.
Fig. 5.. Enhanced neuronal activation and brain glucose metabolism in GLUT1ΔGFAP mice upon astrocytic stimulation.
(A) Representative c-Fos (green) staining in the dentate gyrus of the hippocampus and (B) quantification of c-Fos+ cells per area in Ctrl and GLUT1ΔGFAP mice under NCD or HFD (n = 4 mice per group and 2 slices per mouse). (C) Representative image of dendritic spines from Golgi-Cox–stained slices and (D) quantification of the spine density from NCD- and HFD-fed Ctrl and GLUT1ΔGFAP mice (n = 4 mice per group and 30 dendrites per animal). (E) PET images of representative mice showing brain 18F-FDG signal and (F) the quantification of positron emission (mean SUV) of naïve and MWM-trained Ctrl and GLUT1ΔGFAP mice (n = 8 mice per group). (G) Representation of the ki constant of glucose kinetics before and after CNO activation in different brain areas and (H) comparison of PET images of all constants confirming that ki is significantly elevated in the hippocampus after CNO activation. In (G), light lines represent each individual mouse, while the dark line represent the mean ± SEM (n = 7 mice per group). Data are presented as means ± SEM. *P ≤ 0.05 and **P ≤ 0.01, as determined by two-way ANOVA followed by Tukey (B, D, and F) and two-tailed Student’s t test (G).
Fig. 6.
Fig. 6.. Essential role of brain purinergic signaling in the phenotype exhibited by astrocytic GLUT1-ablated mice.
(A) d- and total serine, (B) glutamate, and (C) ATP release from Ctrl and GLUT1 KD primary cell–cultured astrocytes (n = 4 to 12 independently isolated astrocyte cultures). (D) ATP levels in microdialysis-isolated interstitial fluid of Ctrl and GLUT1∆GFAP mice before (basal) and after intraperitoneal glucose injection (0 to 30 and 30 to 60 min). Data were expressed as the percentage of their own basal (n = 8 to 10 mice per group). (E) Schematic illustration of intracerebroventricular (icv) cannulation and PPADS intracerebroventricular administration 30 min before each metabolic and cognitive assessment task. Created with BioRender.com. (F) Glucose-induced suppression of feeding evaluated by 4-hour accumulated food intake in Ctrl and GLUT1ΔGFAP mice subjected to HFD after saline or PPADS intracerebroventricular injection (n = 6 to 10 per group). (G) GTT in saline-treated or PPADS intracerebroventricularly treated Ctrl and GLUT1ΔGFAP mice on HFD and AUC quantification (n = 7 to 12 per group). (H) Recognition memory assessment by NOR task of HFD-fed Ctrl and GLUT1ΔGFAP mice after saline or PPADS intracerebroventricular administration (n = 6 to 9 per group). (I) Spatial memory evaluation by MWM acquisition phase, (J) retention phase, and (K) a representative image of the swimming path of saline-treated or PPADS intracerebroventricularly treated Ctrl and GLUT1ΔGFAP mice on HFD (n = 5 to 9 per group). Data are presented as means ± SEM. *P ≤ 0.05, as determined by two-tailed Student’s t test (A to C), repeated-measurement ANOVA (D, G, and I) and two-way ANOVA followed by Tukey [(F and G) AUC and (H and J)].
Fig. 7.
Fig. 7.. Astrocytic insulin receptor depletion-induced alterations are rescued by purinergic signaling enhancement.
(A) Insr (IR, encoding gene) mRNA levels in Ctrl and GLUT1ΔGFAP mice after ACSA-2+ FACS-mediated isolation of astrocytes (n = 6 mice per group). (B) ATP levels in microdialysis-isolated interstitial fluid of Ctrl and IR∆GFAP mice before (basal) and after intraperitoneal glucose injection (0 to 30 and 30 to 60 min). Data are expressed as the percentage of their own basal (n = 6 to 8 mice per group). (C) Schematic illustration of the strategy used to generate mice lacking IR specifically in astrocytes (IRΔGFAP) and their Ctrl littermates (IRf/f), intracerebroventricular cannulation, and 2-MeSATP intracerebroventricular administration. Created with BioRender.com. (D) Glucose-induced suppression of feeding evaluated by 4-hour accumulated food intake in Ctrl and IRΔGFAP mice subjected to HFD after saline or 2-MeSATP intracerebroventricular injection (n = 6 to 11 per group). (E) GTT in saline-treated or 2-MeSATP intracerebroventricularly treated Ctrl and IRΔGFAP mice on HFD (n = 8 to 12 per group). (F) Spatial memory evaluation by MWM acquisition and (G) retention phase of saline-treated or 2-MeSATP intracerebroventricularly treated Ctrl and IRΔGFAP mice on HFD (n = 5 to 12 per group). Data are presented as means ± SEM. *P ≤ 0.05 as determined by two-tailed Student’s t test (A), repeated-measurement ANOVA (B, E, and F), and two-way ANOVA followed by Tukey (D and G).
Fig. 8.
Fig. 8.. Increased astrocytic insulin receptor signaling is necessary for the ATP signaling-mediated benefits of astrocytic GLUT1 depletion.
(A) ATP release from Ctrl, GLUT1 KD, and IR KD astrocytes exposed to either vehicle, insulin, or insulin + S961 (IR antagonist; n = 4 independently isolated astrocyte cultures). (B) Four-hour accumulated food intake in Ctrl and GLUT1ΔGFAP mice subjected to HFD after saline or S961 intracerebroventricular injection (n = 6 to 10). (C) GTT in saline-treated or S961 intracerebroventricularly treated mice on HFD and the corresponding AUC quantification (n = 5 to 10). (D) Strategy used to generate mice concomitantly lacking GLUT1 and IR specifically in astrocytes (GLUT1-IRΔGFAP). Created with BioRender.com. (E) ATP levels in microdialysis-isolated interstitial fluid before (basal) and after intraperitoneal glucose injection (0 to 30 and 30 to 60 min; n = 8). (F) PET images of representative mice showing brain 18F-FDG signal and (G) the quantification (mean SUV; n = 4 to 8 mice). (H) Glucose-induced suppression of feeding, (I) GTT with AUC, and (J) insulin tolerance test with AUC (n = 15 to 30). (K) Spatial memory evaluation by MWM acquisition and (L) retention phase (n = 15 to 30). (M) GTT in saline-treated or 2-MeSATP intracerebroventricularly treated Ctrl and GLUT1-IRΔGFAP mice on HFD (n = 5 to 9). (N) MWM acquisition and (O) retention phase of saline-treated or 2-MeSATP intracerebroventricularly treated mice on HFD (n = 5 to 9). Data are presented as means ± SEM. *P ≤ 0.05, **P ≤ 0.01, and ***P ≤ 0.001, as determined by two-way ANOVA followed by Tukey [(A to C) AUC, (G to I) AUC, (J) AUC, (L and M) AUC, and O] and repeated-measurement ANOVA (C, E, I, J, K, M, and N).

References

    1. Bélanger M., Allaman I., Magistretti P. J., Brain energy metabolism: Focus on astrocyte-neuron metabolic cooperation. Cell Metab. 14, 724–738 (2011). - PubMed
    1. Mink J. W., Blumenschine R. J., Adams D. B., Ratio of central nervous system to body metabolism in vertebrates: its constancy and functional basis. Am. J. Physiol. 241, R203–R212 (1981). - PubMed
    1. M. C. McKenna, R. Gruetter, U. Sonnewald, H. S. Waagepetersen, A. Schousboe, “Energy metabolism of the brain” in Basic Neurochemistry: Molecular, Cellular and Medical Aspects, G. J. Siegel, R. W. Alberts, S. T. Brady, D. L. Price, Eds. (Elsevier Academic Press, Burlington, MA, ed. 7, 2006), pp. 531–557.
    1. E. L. Roberts, “The support of energy metabolism in the central nervous system with substrates other than glucose” in Handbook of Neurochemistry and Molecular Neurobiology: Brain Energetics. Integration of Molecular and Cellular Processes, A. Lajtha, G. E. Gibson, G. A. Dienel, Eds. (Springer, 2007), pp. 137–179; 10.1007/978-0-387-30411-3_7. - DOI
    1. Pearson-Leary J., McNay E. C., Novel roles for the insulin-regulated glucose transporter-4 in hippocampally dependent memory. J. Neurosci. 36, 11851–11864 (2016). - PMC - PubMed