. 2024 Oct 18;9(100):eadl2986.
doi: 10.1126/sciimmunol.adl2986. Epub 2024 Oct 18.

An ILC2-chitinase circuit restores lung homeostasis after epithelial injury

Affiliations

An ILC2-chitinase circuit restores lung homeostasis after epithelial injury

Haerin Jung et al. Sci Immunol. .

Abstract

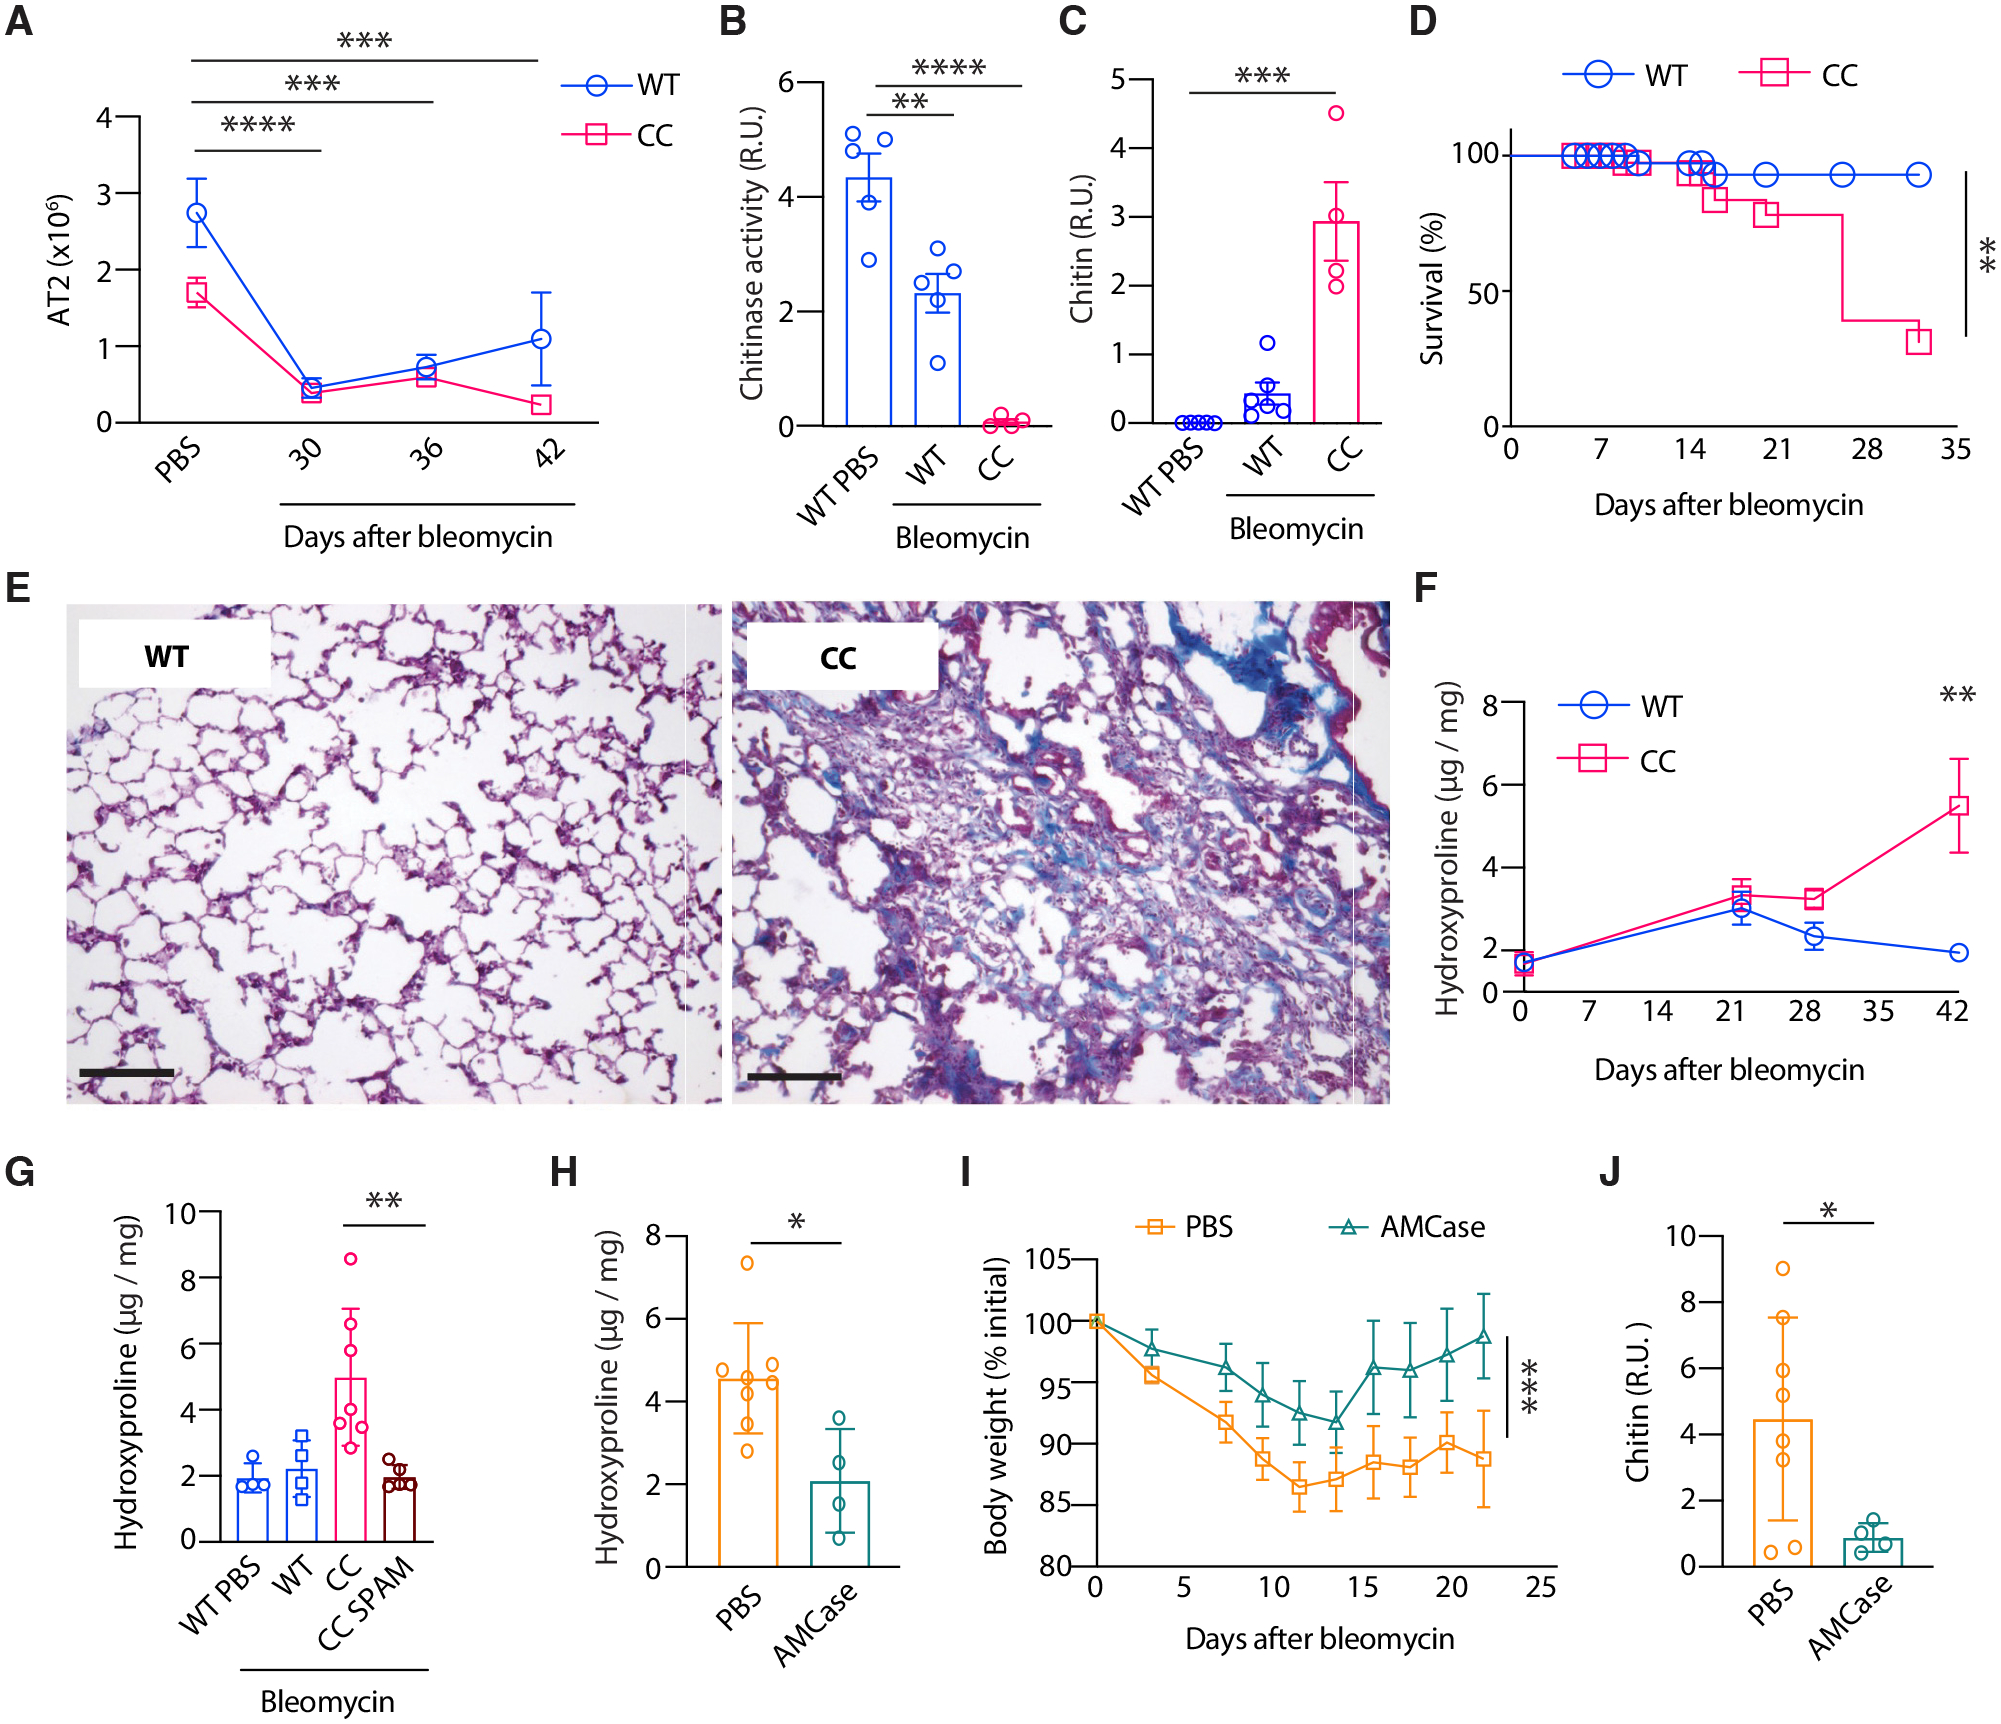
Environmental exposures increase the risk for severe lung disease, but specific drivers of persistent epithelial injury and immune dysfunction remain unclear. Here, we identify a feedback circuit triggered by chitin, a common component of airborne particles, that affects lung health after epithelial injury. In mice, epithelial damage disrupts lung chitinase activity, leading to environmental chitin accumulation, impaired epithelial renewal, and group 2 innate lymphoid cell (ILC2) activation. ILC2s, in turn, restore homeostasis by inducing acidic mammalian chitinase (AMCase) in regenerating epithelial cells and promoting chitin degradation, epithelial differentiation, and inflammatory resolution. Mice lacking AMCase or ILC2s fail to clear chitin and exhibit increased mortality and impaired epithelial regeneration after injury. These effects are ameliorated by chitinase replacement therapy, demonstrating that chitin degradation is crucial for recovery after various forms of lung perturbation. Thus, the ILC2-chitinase response circuit may serve as a target for alleviating persistent postinjury lung epithelial and immune dysfunction.


Conflict of interest statement

S.J.V.D. and R.M.L. are listed as inventors on a patent for the use of chitinases to treat fibrotic lung disease and S.J.V.D, R.M.L., and J.A.F. are listed as inventors on a patent for mutant chitinases with enhanced expression and activity. M.S.D. is a consultant for Inbios, Vir Biotechnology, Ocugen, Topspin, Moderna, and Immunome. The Diamond laboratory has received unrelated funding support in sponsored research agreements from Vir Biotechnology, Emergent BioSolutions, and Moderna.

Figures

Fig. 1.
Fig. 1.. Injury to AMCase-expressing cells causes accumulation of environmental chitin.
(A) Gating scheme and t-distributed stochastic neighbor embedding (tSNE) plots representing scRNAseq analysis of wild-type (WT) (3334 cells) or ChiaRed+ (CR+) (4489 cells) epithelial cells from lungs of WT or CR-heterozygous reporter mice (K-means clustering of populations comprising >5% of total). (B to J) Mice were intranasally mock-infected with PBS or inoculated with 250 plaque-forming units (PFU) of influenza A virus (IAV) and analyzed at indicated days post infection (dpi). (B) Total EpCAM+MHCII+ AT2 cells pooled from each experiment (n = 9–20 mice, N = 3–5 experiments per timepoint), (C) CR+ lung cells (n = 6–14 mice, N = 3–5 experiments per timepoint), (D) AMCase protein in BAL (n = 10–20 mice, N = 3 experiments), and (E) chitin in bronchoalveolar lavage (BAL) fluid (n = 15–24 mice, N > 5 experiments per timepoint) of IAV or mock-infected WT or CR mice at indicated timepoints after infection. R.U.: relative units. (F) Mouse breeding scheme to generate AMCase lineage-tracer (ChiaRed × R26(LSL)-zsGreen) (CR zsG) mice. (G) Quantification of AMCase lineage–traced zsG+ (green) cells in indicated lung areas and (H) representative lung sections from CR zsG mice after IAV or mock infection. Scale bar: 200 μm. Red boxes indicate higher magnification in (I) and the dotted line demarcates injured and uninjured areas. Representative images from n = 3 mice per group, N = 3 experiments. (I) Representative lung sections from CR zsG mice stained with keratin 8 (KRT8, red). Scale bar: 20 μm. Yellow arrowheads, CR zsG+KRT8+ cells. Yellow box indicates the subsection of the infected lung with individual channels represented on the right. (J) Quantification of KRT8 costaining within AMCase lineage–traced zsG+ (green) cells from IAV (14–21 dpi)- or mock-infected mice. Data represent individual biological replicates and are presented as mean±SE. P values were calculated using (B to E) one-way ANOVA with Dunnett’s multiple comparisons test, (G) Holm–Šídák method, or (J) unpaired t test. *P < 0.05; **P < 0.01; ***P < 0.001; ****P < 0.0001.
Fig. 2.
Fig. 2.. AMCase is required for restoration of lung health after epithelial injury.
(A) Survival of WT and CC mice inoculated with 500 PFU IAV. (B to G) WT and CC mice were inoculated with 250 PFU IAV and analyzed at indicated days post infection (dpi). (B) Chitinase activity, (C) chitin (21 dpi; n = 12–17 mice, N = 3 experiments), (D) total BAL protein (21 dpi; n = 6–8 mice, N = 3 experiments) and (E) LDH activity (14 dpi; n = 3–6 mice, N = 2 experiments) in BAL from indicated mice. (F) Representative H&E-stained lung sections at 14 and 21 dpi (n = 4–5 mice per group) and (G and H) quantification of inflamed areas at indicated timepoints at indicated timepoints. (I) Total lung epithelial cells, (J) AT2s, (K) AEPs (n = 3–23 mice, N ≥ 3 experiments), (L) ILC2s, and (M) eosinophils (n = 3–9 mice, N ≥ 3 experiments) at indicated timepoints. (N) Dosing regimen and of CC mice that received intranasal CHIT1 or heat-inactivated (hi)-CHIT1 after IAV inoculation. (O) BAL chitinase activity, (P) MFI of ChiaRed reporter among CR+ epithelial cells, (Q) survival, and (R) ILC2 numbers in CC mice treated with CHIT1 or hi-CHIT1 21 days after IAV inoculation (n = 7–9 mice, N = 3 experiments). (S) Lung ILC2s in WT mice that received intranasal AMCase or hi-AMCase after IAV inoculation (21 dpi; dosing regimen as in (N)). Dotted lines in (F) indicate inflamed areas and red boxes indicate insets for higher magnification. Scale bars: 1 mm (upper) and 200 μm (lower). Data represent individual biological replicates and are presented as mean±SE. Survival rates in (A) (WT IAV, n = 85 mice; CC IAV, n = 89 mice, N > 5 experiments) and (Q) (CHIT1, n = 13 mice; hi-CHIT1, n = 10 mice) were compared by log-rank (Mantel–Cox) test. P values were calculated using two-way ANOVA with multiple comparisons using (I to M) Holm–Šídák method. All other P values were calculated by unpaired t test. *P < 0.05; **P < 0.01; ***P < 0.001; ****P < 0.0001.
Fig. 3.
Fig. 3.. AMCase prevents severe progressive fibrotic lung disease and mortality.
(A) Total lung AT2s (n = 4–7 mice, N = 3–5 experiments per timepoint), (B) BAL chitinase activity, (C) BAL chitin (n = 4–6 mice, N > 2 experiments), and (D) survival of WT and CC mice 21 days after bleomycin challenge (WT, n = 58 mice; CC, n = 63 mice; N ≥ 3 experiments). R.U.: relative units. (E) Representative Masson’s trichrome-stained lung sections from WT and CC mice 42 days after bleomycin administration (n > 5 mice per genotype; N > 3 experiments). Scale bar: 20 μm. (F) Lung hydroxyproline content in bleomycin-challenged WT and CC mice and (G) WT, CC, and CC SPAM mice 42 days after bleomycin administration (n = 4–7 mice per genotype, N > 2 experiments). (H) Lung hydroxyproline, (I) body weights, and (J) BAL chitin among 21 days post bleomycin-challenged WT mice receiving intranasal PBS or recombinant AMCase. Data represent individual biological replicates. P values were calculated by two-way ANOVA with correction for multiple comparisons using (A) Dunnett’s method or (F) Holm–Šídák method, (B, C, G) one-way ANOVA with multiple comparisons using Dunnett’s method, (H and J) unpaired t test, (I) paired t test, and (D) log-rank (Mantel–Cox) test. *P < 0.05; **P < 0.01; ***P < 0.001; ****P < 0.0001.
Fig. 4.
Fig. 4.. Environmental chitin and chitinase activity control ILC2 responses and recovery after IAV infection.
(A) WT and CC mice were acclimated to standard or low-chitin housing conditions prior to intranasal inoculation with 250 PFU IAV followed by analysis at 14 days post-infection (dpi). [Part of the illustration was created with Biorender.com]. (B) Body weights of IAV-infected WT or (C) CC mice housed in standard or low chitin conditions. (D) Representative chitin blot and (E) quantification of BAL chitin, (F) total AT2s, (G) AEPs, (H) lung ILC2s, and (I) eosinophils in WT and CC mice housed as indicated (low chitin: n > 9 mice per group; standard: n = 3–15 mice per group). (J) Representative image and (K) quantification of AMCase (protein immunoblot) and total protein (Coomassie blue stain) in BAL from WT and SPAM Tg mice at 14 dpi (n = 3–6 mice per group). (L) BAL chitinase activity, (M) BAL chitin, (N) body weights (n = 3–6 mice per group), (O) survival, (P) BAL protein, and (Q) total AT2s in WT and SPAM transgenic (Tg) mice at 14 dpi. (K to M and P) n = 4–8 mice, N = 3 experiments; Q, n = 9–18, 3 experiments). R.U.: relative units. P values were calculated by unpaired t test (K-M, P-Q), two-way ANOVA with multiple comparisons using Holm–Šídák method (B and C, E-I), or (O) log-rank (Mantel–Cox) test (WT IAV, n = 32 mice; Spam Tg IAV, n = 26 mice, >5 experiments). *P < 0.05; **P < 0.01; ***P < 0.001; ****P < 0.0001.
Fig. 5.
Fig. 5.. Epithelial regeneration is modulated by chitin and chitinase activity.
(A) RNA-seq analysis comparing differentially expressed genes (log2FC P < 0.05) in AEPs sorted from the lungs of naïve versus IAV-infected (14 dpi) WT mice and (B) downregulated genes in AEPs from IAV-infected CC versus WT mice. (C) Relative expression of AT1 and AT2 marker genes in WT and CC AEPs, shown as log2FC of IAV-infected (14 dpi) as compared to genotype-matched AEPs from naïve mice. (D) Experimental approach for AEP sorting after chitin challenge. (E) AT1 and AT2 marker gene expression and (F) downregulated gene ontology (GO) pathways in AEPs from chitin- versus PBS-treated WT mice. (G) Average expression of Egfr mRNA and (H) EGFR+ AT2s and AEPs in the lungs of naïve WT mice. (I) Average expression of Egfr in sorted AEPs from WT and CC mice following intranasal PBS or chitin administration. (J) EGFR-regulated genes in CC versus WT AEPs after chitin challenge. (K) Downregulated GO pathways in naïve AEPs sorted from the lungs of CC versus WT mice. RNA-seq expression data represent n ≥ 3 mice per group and were filtered with Benjamini–Hochberg false-discovery rate adjusted P values ≤ 0.05. P values were calculated by unpaired t test (H), *P < 0.05; **P < 0.01.
Fig. 6.
Fig. 6.. Amphiregulin promotes AT2 maturation and chitinase expression following injury.
(A) Recombinant amphiregulin (AREG) was administered intranasally to IAV-infected mice every other day from 10 to 21 dpi. (B) ChiaRed (CR)-expressing AEPs and CR MFI after PBS or AREG administration to mock- or IAV-infected (21 dpi) mice (n = 3–7 mice per group, N = 3 experiments). (C) BAL chitinase activity, (D) BAL chitin, (E) AT2s, (F) AEP:AT2 frequency (as a percentage of total EpCAM+ lung epithelial cells; n = 3–7 mice per group, N = 3 experiments), (G) representative H&E-stained lung sections, and (H) quantification of inflamed area in the lungs of IAV-infected mice treated with PBS or AREG at 21 dpi (n = 3–5 mice per group, N = 2 experiments). (I to M) IAV-infected WT mice received intranasal anti-AREG or isotype control antibodies every other day from 10 to 21 dpi. (I) MFI of CR-expressing AEPs, (J) AT2s, (K) mouse body weights, (L) representative H&E-stained lung sections, and (M) quantification of the inflamed area after anti-AREG or isotype administration (n = 3–6 mice per group, N = 3 experiments, 21 dpi). (N) Lung ILC2s, (O) BAL AREG, (P) CR MFI among AEPs, (Q) BAL chitinase activity, and (R) AT2s in IAV-infected mice that were treated with PBS or IL33+TSLP between 10 and 16 dpi (n = 5–9 mice per group, N = 2 experiments). Bold yellow lines in (G and L) indicate inflamed areas. Scale bars: 1 mm. R.U.: relative units. Data represent individual biological replicates and are presented as mean±SE. P values were calculated by (K) paired t test and (B and O) one-way ANOVA with Sidak’s multiple comparison test. All other P values were calculated by unpaired t test. *P < 0.05; **P < 0.01; ***P < 0.001; ****P < 0.0001.
Fig. 7.
Fig. 7.. ILC2s control epithelial regeneration by restoring AT2 AMCase expression.
(A to F) Mice were intranasally infected with 250 PFU of IAV and analyzed for (A) survival (WT IAV, n = 13 mice; ILC2-deleter IAV, n = 19 mice), or (B to F) euthanized and analyzed at 14 days post infection (dpi). (B) BAL protein (n = 6 mice per group, N = 3 experiments), (C) representative flow cytometry and (D) frequency of AEP and AT2 cells (n = 8–15 mice, N = 3 experiments). R.U.: relative units. (E) BAL chitinase activity in R5, ILC2-deleter mice and TKO mice after IAV infection (n = 4–8 mice, N > 2 experiments). (F) Quantitative real-time PCR (qPCR) analysis of Chia1 transcript abundance in AEPs after IAV infection (n = 3–5 mice per group). (G) Total AT2 cells (n = 4–6 mice, representative of N = 3 experiments in R5 and ILC2-deleter mice after 21 dpi. (H) Dosing regimen, (I) body weights, (J) survival (ILC2-deleter IAV-AMCase, n = 22 mice; ILC2-deleter IAV-hiAMCase, n = 12 mice, N > 3 experiments) (K) BAL chitinase activity (n = 4–7 mice, N = 3 experiments) (L), BAL chitin (n = 9–10 mice, N = 3 experiments), (M) BAL total protein (n = 6–8 mice, N = 3 experiments), and (N) AT2 numbers (n = 7–10, N = 3 experiments) in ILC2-deleter mice at 21 dpi or as indicated after IAV infection and intranasal administration of active AMCase or hiAMCase. Arrows in (I and J) represent active AMCase or hi-AMCase intranasal doses. Data represent individual biological replicates and are presented as mean±SE. P values were calculated by (A and J) log-rank (Mantel–Cox) test, (B, D, F, G, I, and K to N) unpaired t test, or (E) one-way ANOVA with Holm–Šídák method. *P < 0.05; **P < 0.01; ***P < 0.001.

References

    1. Di Q, Wang Y, Zanobetti A, Wang Y, Koutrakis P, Choirat C, Dominici F, Schwartz JD, Air Pollution and Mortality in the Medicare Population. N. Engl. J. Med 376, 2513–2522 (2017). - PMC - PubMed
    1. Cohen AJ, Brauer M, Burnett R, Anderson HR, Frostad J, Estep K, Balakrishnan K, Brunekreef B, Dandona L, Dandona R, Feigin V, Freedman G, Hubbell B, Jobling A, Kan H, Knibbs L, Liu Y, Martin R, Morawska L, Pope CA 3rd, Shin H, Straif K, Shaddick G, Thomas M, van Dingenen R, van Donkelaar A, Vos T, Murray CJL, Forouzanfar MH, Estimates and 25-year trends of the global burden of disease attributable to ambient air pollution: an analysis of data from the Global Burden of Diseases Study 2015. Lancet 389, 1907–1918 (2017). - PMC - PubMed
    1. Horne BD, Joy EA, Hofmann MG, Gesteland PH, Cannon JB, Lefler JS, Blagev DP, Korgenski EK, Torosyan N, Hansen GI, Kartchner D, Pope CA 3rd, Short-Term Elevation of Fine Particulate Matter Air Pollution and Acute Lower Respiratory Infection. Am. J. Respir. Crit. Care Med 198, 759–766 (2018). - PubMed
    1. Basil MC, Katzen J, Engler AE, Guo M, Herriges MJ, Kathiriya JJ, Windmueller R, Ysasi AB, Zacharias WJ, Chapman HA, Kotton DN, Rock JR, Snoeck H-W, Vunjak-Novakovic G, Whitsett JA, Morrisey EE, The Cellular and Physiological Basis for Lung Repair and Regeneration: Past, Present, and Future. Cell Stem Cell 26, 482–502 (2020). - PMC - PubMed
    1. Yao Y, Pan J, Liu Z, Meng X, Wang W, Kan H, Wang W, Temporal association between particulate matter pollution and case fatality rate of COVID-19 in Wuhan. Environ. Res 189, 109941 (2020). - PMC - PubMed

Publication types