. 2024 Oct 18;9(100):eadg6453.
doi: 10.1126/sciimmunol.adg6453. Epub 2024 Oct 18.

The acid-sensing receptor GPR65 on tumor macrophages drives tumor growth in obesity

Affiliations

The acid-sensing receptor GPR65 on tumor macrophages drives tumor growth in obesity

Sreya Bagchi et al. Sci Immunol. .

Abstract

Multiple cancers, including colorectal cancer (CRC), are more frequent and often more aggressive in individuals with obesity. Here, we showed that macrophages accumulated within tumors of patients with obesity and CRC and in obese CRC mice and that they promoted accelerated tumor growth. These changes were initiated by oleic acid accumulation and subsequent tumor cell-derived acid production and were driven by macrophage signaling through the acid-sensing receptor GPR65. We found a similar role for GPR65 in hepatocellular carcinoma (HCC) in obese mice. Tumors in patients with obesity and CRC or HCC also exhibited increased GPR65 expression, suggesting that the mechanism revealed here may contribute to tumor growth in a range of obesity-associated cancers and represent a potential therapeutic target.


Conflict of interest statement

Competing Interests

The authors declare that they have no competing interests.

Figures
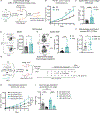
Fig 1.
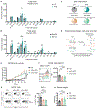
Fig 1.. Macrophages contribute to colorectal tumor growth under obesogenic conditions.
(A) Schematic depicting HFD induction of obesity in mice and subsequent implantation of CRC tumors. (B) Subcutaneous MC38 tumor volume was measured in CD- and HFD-fed mice (n=27 (CD); n=29 (HFD)). (C) Sparkl 4640 cells were orthotopically implanted in CD- and HFD-fed mice. Absolute TAM number per mg of tumor in (D) MC38 (left) and (E) Sparkl 4640 (right) tumors was determined by flow cytometry 21 days post-tumor implantation. Representative flow plots in (D) and (E) depict gating strategy for TAMs in both tumor types. TAMs were defined as CD45+ CD11b+ Ly6G- and F4/80+ Ly6Clo. (F) Macrophage enrichment scores of human CRC tissues were calculated from TCGA RNA sequencing data from non-obese and obese patients. Macrophages were defined based on the Cibersort macrophage gene signature list. (G) Experimental design depicting macrophage depletion strategy. (H) MC38 tumor growth curve in macrophage depleted and non-depleted CD- and HFD-fed mice 21 days post-tumor implantation (n=15 (CD- DTR-); n=8 (CD- DTR+); n=10 (HFD- DTR-); n=10 (HFD- DTR+)). (I) Sparkl 4640 tumor weights from macrophage depleted and non-depleted CD- and HFD-fed mice 21 days post-tumor implantation. Two-group comparisons were performed using a two-tailed t-test (C-F). Two-Way ANOVA was performed for panels B, H, and I (multiple comparisons were corrected for by controlling the false discovery rate). * is p less than or equal to 0.05, ** is p less than 0.01, *** is p less than 0.001, **** is p less than 0.0001. Data are representative of at least two independent experiments.
Fig 2.
Fig 2.. Obesity-associated TAMs are less inflammatory and exhibit a tumorigenic transcriptional signature.
(A) TAMs from MC38 tumors were sorted 21 days post-tumor implantation, and bulk RNA sequencing and unsupervised hierarchical clustering were performed. TAMs from 2–3 mice were pooled for one RNA sequencing analysis sample. GO biological processes significantly (B) downregulated and (C) upregulated in TAMs from HFD-fed mice. GSEA processes (D) negatively and (E) positively associated with TAMs from HFD-fed mice using the Hallmark gene set of MSigDB. (F-I) Activation markers on TAMs from MC38 tumors were detected in CD- and HFD-fed mice 21 days post-tumor implantation. (J-L) Secretion of pro-inflammatory cytokines by TAMs from MC38 tumors in CD- and HFD-fed mice 21 days post-tumor implantation (J depicts representative flow plots for graphs in K and L). (M-O) Secretion of pro-inflammatory cytokines by TAMs from Sparkl 4640 tumors as determined in CD- and HFD-fed mice 21 days post-tumor implantation (M depicts representative flow plots for graphs in N and O). For all panels, a two-tailed t-test was performed to calculate significance. * is p less than or equal to 0.05, ** is p less than 0.01, *** is p less than 0.001, **** is p less than 0.0001. Data are representative of at least two independent experiments. NES = normalized enrichment score.
Fig 3.
Fig 3.. Obesity leads to the accumulation of oleic acid in CRC, which reduces TAM inflammatory responses.
(A) Fatty acids detected by gas chromatography in MC38 tumors from CD- and HFD-fed mice 21 days post-tumor implantation (n=8 for CD and n=9 for HFD). (B) Fatty acids detected in non-obese and obese CRC patients (n=14 for BMI<25 and n=15 for BMI >30). (C) Pie charts depicting the composition of different diets used for studies in panels E-H. (D) Schematic of experimental design depicting the mouse model of obesity induced by an oleic acid enriched diet (OAD) and subsequent MC38 tumor implantation. (E) MC38 tumor growth curves in CD, 45% HFD and 45% OAD-fed mice (n=14 (45% HFD); n=14 (45% OAD); n=11 (CD)). (F) MHCII expression on MC38 TAMs in CD, 45% HFD and 45% OAD-fed mice as determined by flow cytometry upon tumor isolation 21 days post-tumor implantation. (G) TNF-α secretion by MC38 TAMs in CD, 45% HFD and 45% OAD-fed mice as determined by flow cytometry 21 days post-tumor implantation. (H) Mice were weighed after 2 months of being on a CD, 45% HFD and 45% OAD. A one-tailed t-test was performed for panels A, B. Analyses involving more than two groups (E-H) were performed using ordinary one-way ANOVA (multiple comparisons were corrected for by controlling the false discovery rate). * is p less than or equal to 0.05, ** is p less than 0.01, *** is p less than 0.001, **** is p less than 0.0001. Data are representative of at least two independent experiments.
Fig. 4.
Fig. 4.. Oleic acid alters tumor cell metabolism resulting in increased acid production.
(A) Spare respiratory capacity of MC38 tumor cells in response to treatment with 6.25 μg/ml of oleic acid. (B-D) Basal glycolytic and OxPhos rates and the ratio of the two processes of MC38 tumor cells in response to treatment with different concentrations of oleic acid. (E) GSEA enrichment plots negatively and positively associated with tdT+ CD45- MC38 tumor cells in HFD-fed mice using the canonical KEGG gene set of MSigDB. MC38 cells from tumors were isolated from 5 CD and 5 HFD-fed mice for the RNA sequencing analysis. Tumors were harvested 21 days post-tumor implantation. (F) Enrichment scores of glycolytic and OxPhos genes in MC38 tumor cells that contributed to GSEA enrichment plots in G. Enrichment scores of (G) glycolysis and (H) FAO and OxPhos genes in human non-obese and obese CRC patients. (I) Mitochondria-derived acid secreted by MC38 tumor cells in response to different concentrations of oleic acid. Intratumoral acid levels in MC38 tumors in CD- and HFD comprising (J) 60% fat, (K) 45% fat and 45% fat with OAD enrichment 21 days post-tumor implantation. A two-tailed t-test was performed for panels G, H and J. A two-way ANOVA was performed for A (multiple comparisons were corrected for by controlling the false discovery rate); an RM one-way ANOVA with Tukey’s post-test was performed for panels B-D and I, and an ordinary one-way ANOVA was performed for K (multiple comparisons were corrected for by controlling the false discovery rate). * is p less than or equal to 0.05, ** is p less than 0.01, *** is p less than 0.001, **** is p less than 0.0001. Data are representative of at least two independent experiments.
Fig 5.
Fig 5.. GPR65 contributes to accelerated tumor growth under conditions of obesity.
(A) GPR65 protein expression on sorted TAMs from MC38 tumors of CD- and HFD-fed mice was determined by ELISA. Tumors were harvested 21 days post-tumor implantation. (B-C) Human GPR65 RNA expression in the tumors of non-obese and obese CRC and HCC patients. (D) MC38 tumor growth curves in CD- and HFD-fed Gpr65+/+ and Gpr65−/− mice (n=4 (CD-Gpr65+/+); n=8 (CD-Gpr65−/−); n=8 (HFD-Gpr65+/+); n=10 (HFD-Gpr65−/−)). (E) MHCII expression on MC38 TAMs from CD- and HFD-fed Gpr65+/+ and Gpr65−/− mice 21 days post-tumor implantation. (F) TNF-α secretion by MC38 TAMs from CD- and HFD-fed Gpr65+/+ and Gpr65−/− mice 21 days post-tumor implantation (right). Representative flow plots in each group (left). (G) Experimental design depicting the strategy for inducing spontaneous HCC. (H) Liver weights in HFD-fed Gpr65+/+ and Gpr65−/− mice were determined 17–20 days after induction of spontaneous HCC. (I) MHCII expression on hepatic macrophages from HFD-fed Gpr65+/+ and Gpr65−/− mice as determined by flow cytometry. (J) TNF-α secretion by hepatic macrophages from HFD-fed Gpr65+/+ and Gpr65−/− mice (right). Representative flow plots in each group (left). A two-tailed t-test was performed for panels A-C and H-J. A two-way ANOVA was performed for panels D-F (multiple comparisons were corrected for by controlling the false discovery rate). * is p less than or equal to 0.05, ** is p less than 0.01, *** is p less than 0.001, **** is p less than 0.0001. Data are representative of at least two independent experiments.
Fig 6.
Fig 6.. GPR65 on TAMs is sufficient to drive accelerated tumor growth under conditions of obesity.
(A) Experimental setup to decipher the role of GPR65 expression on macrophages in anti-tumor immunity. Mice were euthanized 25 days post-tumor implantation. (B) Number of CD45.1+ MC38 TAMs in HFD-fed Ccr2−/− CD45.2+ mice. (C) MC38 tumor weights in HFD-fed Ccr2−/− CD45.2+ mice that either received Gpr65+/+ or Gpr65−/− macrophages. (D) TNF-α secretion by CD45.1+ MC38 TAMs in HFD-fed Ccr2−/− mice as determined by flow cytometry (right). Representative flow plots are depicted on the left. A two-tailed t-test was performed for all panels. * is p less than or equal to 0.05, ** is p less than 0.01, *** is p less than 0.001, **** is p less than 0.0001. Data are representative of at least two independent experiments.

References

    1. Obesity and overweight (2021). https://www.who.int/news-room/fact-sheets/detail/obesity-and-overweight.
    1. Adult Obesity Facts (2022). https://www.cdc.gov/obesity/data/adult.html.
    1. Blüher M, Obesity: global epidemiology and pathogenesis. Nat Rev Endocrinol 15, 288–298 (2019). - PubMed
    1. Avgerinos KI, Spyrou N, Mantzoros CS, Dalamaga M, Obesity and cancer risk: Emerging biological mechanisms and perspectives. Metabolism 92, 121–135 (2019). - PubMed
    1. Aune D, Sen A, Prasad M, Norat T, Janszky I, Tonstad S, Romundstad P, Vatten LJ, BMI and all cause mortality: systematic review and non-linear dose-response meta-analysis of 230 cohort studies with 3.74 million deaths among 30.3 million participants. BMJ, i2156 (2016). - PMC - PubMed

Publication types

MeSH terms

Substances