. 2024 Jan 8;18(1):wrae209.
doi: 10.1093/ismejo/wrae209.

Resource sharing of an infant gut microbiota synthetic community in combinations of human milk oligosaccharides

Affiliations

Resource sharing of an infant gut microbiota synthetic community in combinations of human milk oligosaccharides

Athanasia Ioannou et al. ISME J. .

Abstract

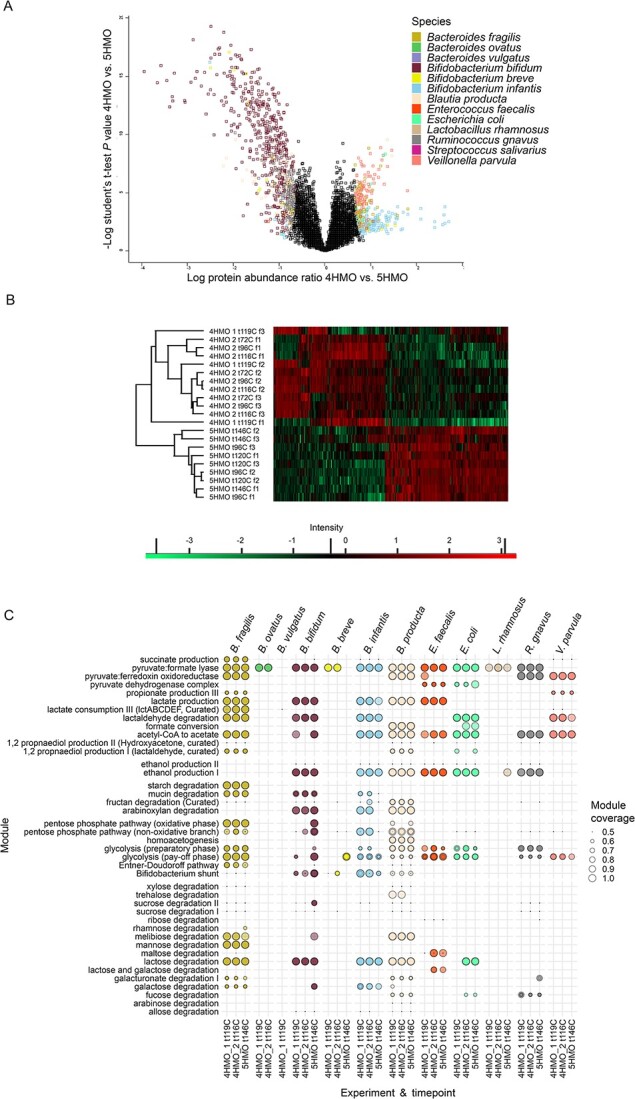
Quickly after birth, the gut microbiota is shaped via species acquisition and resource pressure. Breastmilk, and more specifically, human milk oligosaccharides are a determining factor in the formation of microbial communities and the interactions between bacteria. Prominent human milk oligosaccharide degraders have been rigorously characterized, but it is not known how the gut microbiota is shaped as a complex community. Here, we designed BIG-Syc, a synthetic community of 13 strains from the gut of vaginally born, breastfed infants. BIG-Syc replicated key compositional, metabolic, and proteomic characteristics of the gut microbiota of infants. Upon fermentation of a four and five human milk oligosaccharide mix, BIG-Syc demonstrated different compositional and proteomic profiles, with Bifidobacterium infantis and Bifidobacterium bifidum suppressing one another. The mix of five human milk oligosaccharides resulted in a more diverse composition with dominance of B. bifidum, whereas that with four human milk oligosaccharides supported the dominance of B. infantis, in four of six replicates. Reintroduction of bifidobacteria to BIG-Syc led to their engraftment and establishment of their niche. Based on proteomics and genome-scale metabolic models, we reconstructed the carbon source utilization and metabolite and gas production per strain. BIG-Syc demonstrated teamwork as cross-feeders utilized simpler carbohydrates, organic acids, and gases released from human milk oligosaccharide degraders. Collectively, our results showed that human milk oligosaccharides prompt resource-sharing for their complete degradation while leading to a different compositional and functional profile in the community. At the same time, BIG-Syc proved to be an accurate model for the representation of intra-microbe interactions.

Keywords: bifidobacteria; community dynamics; genome-scale metabolic modelling; human milk oligosaccharides; infant gut microbiota; synthetic community.


Conflict of interest statement

JK, BB, and MM are employees of Danone Nutricia Research.

The remaining authors declare that the research was conducted in the absence of any commercial or financial relationships that could be construed as a potential conflict of interest.

Figures

Figure 1
Figure 1
Assembly of the synthetic community based on computational analysis to select for the strains with desired characteristics. The 13 strains are predicted to belong to the trophic levels of HMO degraders, primary cross-feeders and acetogens.
Figure 2
Figure 2
Top: Composition plots of qPCR and copy number corrected relative abundance of species per fermentor, grouped per timepoint. Bottom: Composition plots of the concentration (mM) of metabolites per fermentor, grouped per timepoint.
Figure 3
Figure 3
A) PCoA plot of the bray–Curtis dissimilarity calculated for the 16S rRNA gene amplicon data of <5 month old infants and BIG-Syc in continuous fermentations, B) Venn diagram of shared core genera between breastfed infants, formula fed infants, and the 4HMO and 5HMO continuous fermentations, C) relative abundance of mean acetate, propionate, lactate, and succinate in the sum of total SCFA, lactate, and succinate, D) Pearson correlation coefficient between different samples for relative abundance of mean acetate, propionate, lactate, and succinate in the sum of total SCFA, lactate, and succinate, E) percentage of bacterial KOs from term infant fecal samples of the EIBER study that are also present in BIG-Syc proteomics.
Figure 4
Figure 4
A) Degradation percentage of 2’-FL, 3-FL, 3’-SL, 6’-SL, LNT and Hex2/lactose per timepoint and condition, B) enzymes related to HMO degradation, grouped per species, fermentor, and condition in the final timepoint. Shortcut labels: “1,3-beta-galactosyl-N-acetylhexosamine phosphorylase [EC:2.4.1.211]” = “acetylhexosamine phosphorylase [EC:2.4.1.211]”, “6-phospho-beta-galactosidase [EC:3.2.1.85]” = “β-galactosidase [EC:3.2.1.85]”, “alpha-L-fucosidase [EC:3.2.1.51]” = “fucosidase [EC:3.2.1.51]”, “alpha-L-fucosidase 2 [EC:3.2.1.51]”=“fucosidase [EC:3.2.1.51]”, “alpha-N-acetylglucosaminidase [EC:3.2.1.50]” = “α-N-acetylglucosaminidase [EC:3.2.1.50]”, “beta-galactosidase [EC:3.2.1.23]” = “β-galactosidase [EC:3.2.1.23]”, “beta-N-acetylhexosaminidase [EC:3.2.1.52]” = “β-N-acetylhexosaminidase [EC:3.2.1.52]”, “hexosaminidase [EC:3.2.1.52]” = “hexosaminidase [EC:3.2.1.52]”,"sialidase-1 [EC:3.2.1.18]” = “sialidase [EC:3.2.1.18]”, “putative endo-beta-galactosidase” = “putative endo-β-galactosidase”, “Exo-alpha sialidase” = “exo-α sialidase”, “Endosialidase” = “endosialidase”, “beta-galactosidase” = “β-galactosidase”, “Endo-beta-N-acetylglucosaminidase” = “endo-beta-N-acetylglucosaminidase”, “Lacto-N-biose phosphorylase-like N-terminal TIM barrel domain-containing protein (Fragment)”=“lacto-N-biose phosphorylase”.
Figure 5
Figure 5
A) Volcano plot of -log t-test P value (y axis) and log protein abundance ratio (t-test difference) (x axis) between 4HMO and 5HMO. Significantly different proteins are colored per species and non-significantly different proteins are in black color. B) Heatmap of hierarchical clustering based on spearman correlation of ANOVA determined significantly different proteins. C) Overview of relevant modules with >0.5 KO coverage. Values are grouped per module, experiment, and species in the final timepoint. Values from the three fermentors overlap so lighter color indicates the module was detected in fewer fermentors. Different coverages between fermentors lead to overlapping circles of different sizes. Modules are ordered by their relation to organic acids, alcohols, complex carbohydrates, main pathways and simple carbohydrates.
Figure 6
Figure 6
A) Top: Composition plots of qPCR and copy number corrected relative abundance of species per fermentor, grouped per timepoint. Bottom: Composition plots of the concentration (mM) of metabolites per fermentor, grouped per timepoint. B) Enzymes related to HMO degradation, grouped per species and fermentor in the final timepoint before and after addition of bifidobacteria. Shortcut labels: “1,3-beta-galactosyl-N-acetylhexosamine phosphorylase [EC:2.4.1.211]” = “acetylhexosamine phosphorylase [EC:2.4.1.211]”, “6-phospho-beta-galactosidase [EC:3.2.1.85]” = “β-galactosidase [EC:3.2.1.85]”, “alpha-L-fucosidase [EC:3.2.1.51]” = “fucosidase [EC:3.2.1.51]”, “alpha-L-fucosidase 2 [EC:3.2.1.51]”=“fucosidase [EC:3.2.1.51]”, “alpha-N-acetylglucosaminidase [EC:3.2.1.50]” = “α-N-acetylglucosaminidase [EC:3.2.1.50]”, “beta-galactosidase [EC:3.2.1.23]”  = “β-galactosidase [EC:3.2.1.23]”, “beta-N-acetylhexosaminidase [EC:3.2.1.52]” = “β-N-acetylhexosaminidase [EC:3.2.1.52]”, “hexosaminidase [EC:3.2.1.52]” = “hexosaminidase [EC:3.2.1.52]”,"sialidase-1 [EC:3.2.1.18]” = “sialidase [EC:3.2.1.18]”, “putative endo-beta-galactosidase” = “putative endo-β-galactosidase”, “Exo-alpha sialidase” = “exo-α sialidase”, “Endosialidase” = “endosialidase”, “beta-galactosidase” = “β-galactosidase”, “Endo-beta-N-acetylglucosaminidase” = “endo-beta-N-acetylglucosaminidase”, “Lacto-N-biose phosphorylase-like N-terminal TIM barrel domain-containing protein (Fragment)”=“lacto-N-biose phosphorylase”.
Figure 7
Figure 7
A) Inflow of carbon sources for each BIG-Syc member and B) outflow of metabolites and gases. C) Carbon source utilization strategies and trophic level interactions of BIG-Syc members grown on HMOs.

References

    1. Ferretti P, Pasolli E, Tett Aet al. . Mother-to-infant microbial transmission from different body sites shapes the developing infant gut microbiome. Cell Host Microbe 2018;24:133–145.e5. 10.1016/j.chom.2018.06.005 - DOI - PMC - PubMed
    1. Zeng X, Xing X, Gupta Met al. . Gut bacterial nutrient preferences quantified in vivo. Cell 2022;185:3441–3456.e19. 10.1016/j.cell.2022.07.020 - DOI - PMC - PubMed
    1. Urashima T, Hirabayashi J, Sato Set al. . Human milk oligosaccharides as essential tools for basic and application studies on galectins. Trends Glycosci Gly 2017;30:SE51–65. 10.4052/tigg.1734.1SE - DOI
    1. Ninonuevo MR, Park Y, Yin Het al. . A strategy for annotating the human milk glycome. J Agric Food Chem 2006;54:7471–80. 10.1021/jf0615810 - DOI - PubMed
    1. Thurl S, Munzert M, Boehm Get al. . Systematic review of the concentrations of oligosaccharides in human milk. Nutr Rev 2017;75:920–33. 10.1093/nutrit/nux044 - DOI - PMC - PubMed

Substances

LinkOut - more resources