. 2024 Oct 18;14(1):24501.
doi: 10.1038/s41598-024-73309-8.

Novel, soluble 3-heteroaryl-substituted tanshinone mimics attenuate the inflammatory response in murine macrophages

Affiliations

Novel, soluble 3-heteroaryl-substituted tanshinone mimics attenuate the inflammatory response in murine macrophages

Elisa Facen et al. Sci Rep. .

Abstract

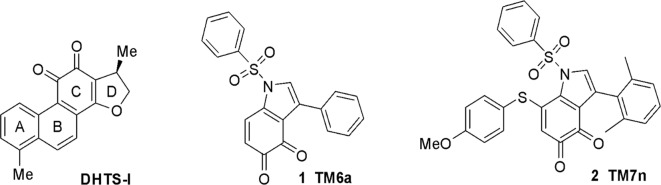
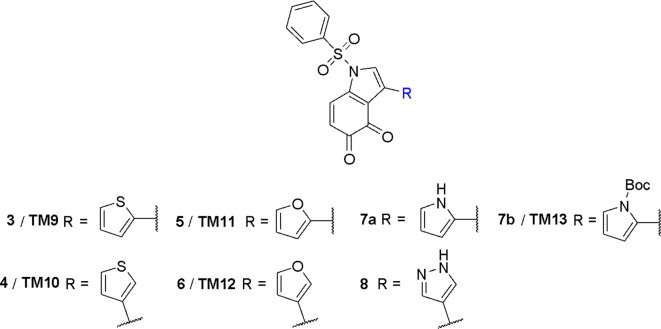
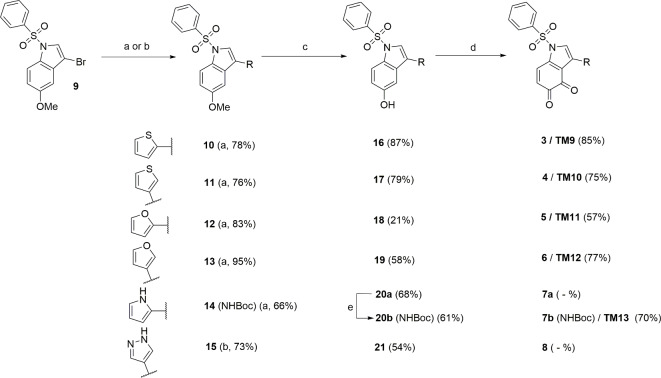
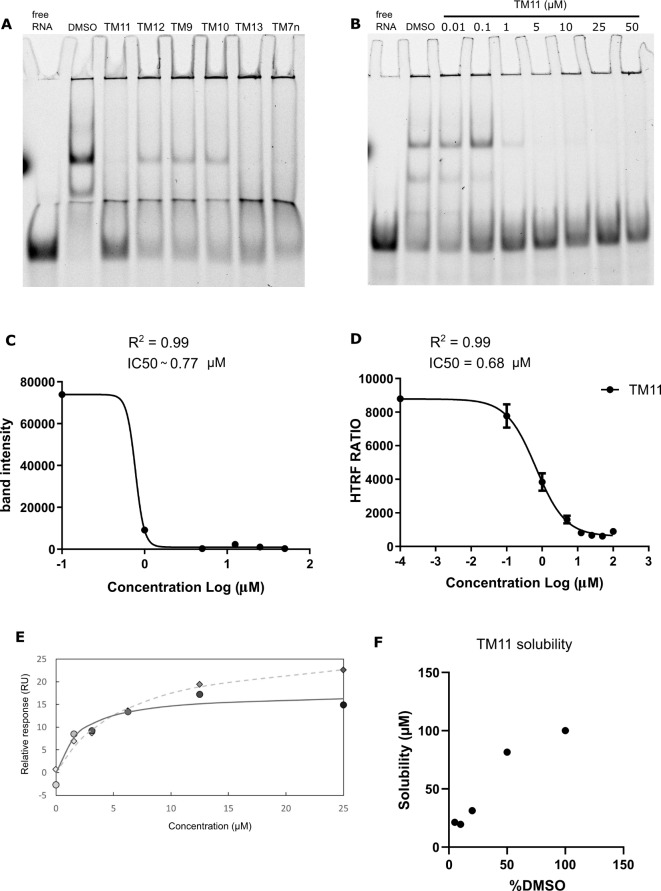
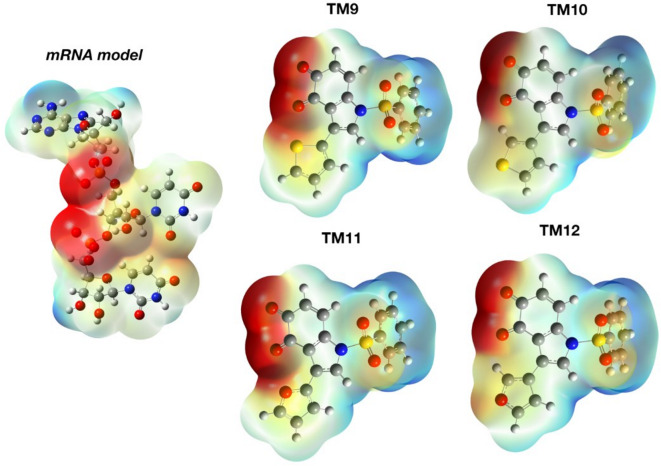
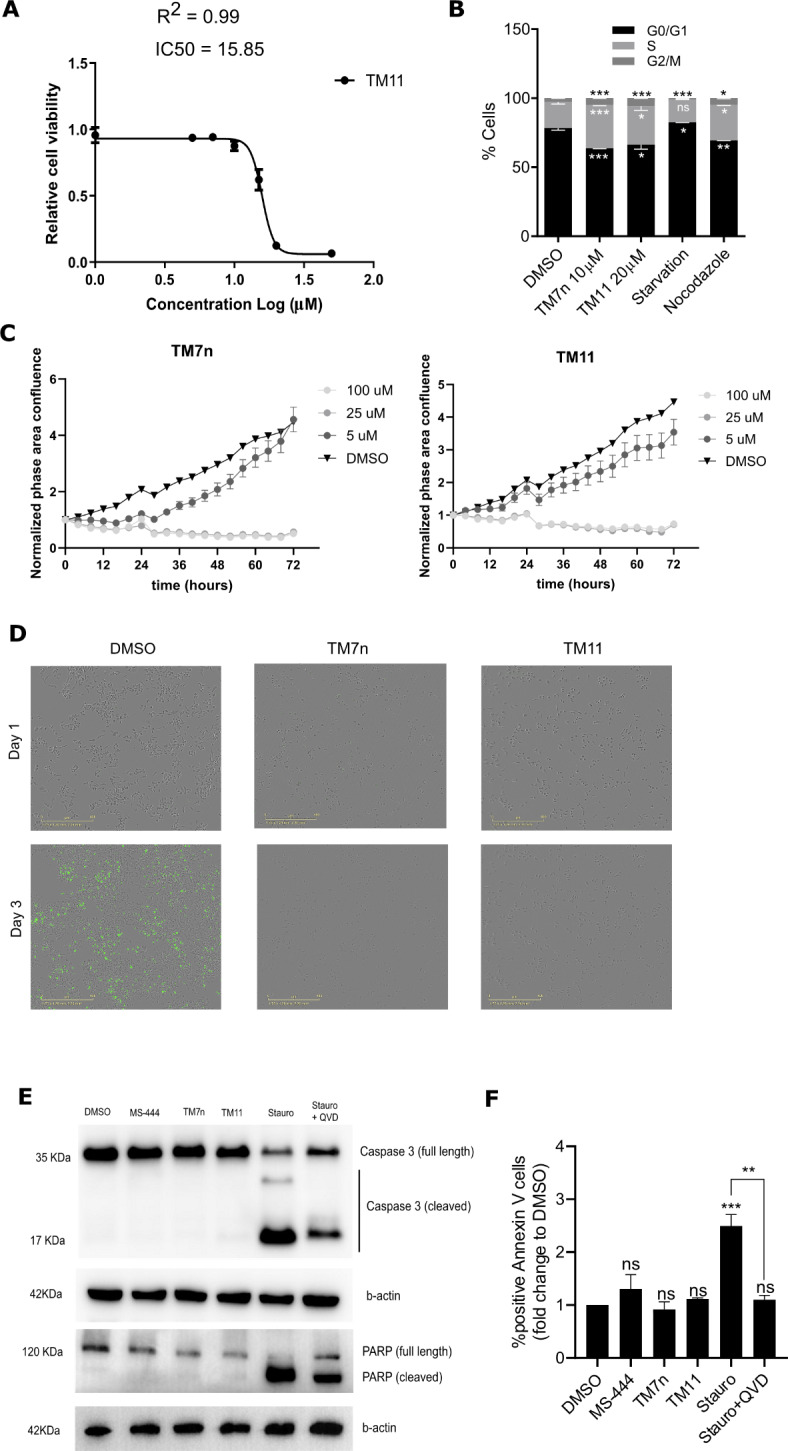
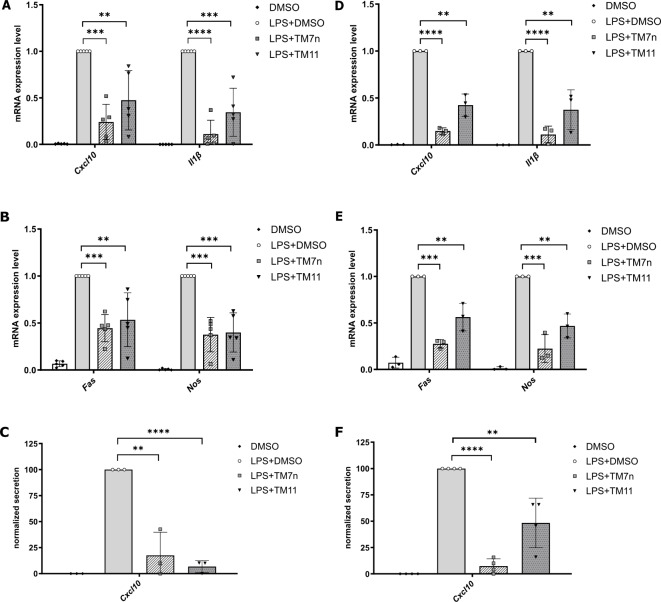
The RNA binding protein Human Antigen R (HuR) has been identified as a main regulator of the innate immune response and its inhibition can lead to beneficial anti-inflammatory effects. To this aim, we previously synthesized a novel class of small molecules named Tanshinone Mimics (TMs) able to interfere with HuR-RNA binding, and that dampen the LPS-induced immune response. Herein, we present a novel series of TMs, encompassing thiophene 3/TM9 and 4/TM10, furan 5/TM11 and 6/TM12, pyrrole 7b/TM13, and pyrazole 8. The furan-containing 5(TM11) showed the greatest inhibitory effect of the series on HuR-RNA complex formation, as suggested by RNA Electromobility Shift Assay and Time-Resolved FRET. Molecular Dynamics Calculation of HuR - 5/TM11 interaction, quantum mechanics approaches and Surface Plasmon Resonance data, all indicates that, within the novel heteroaryl substituents, the furan ring better recapitulates the chemical features of the RNA bound to HuR. Compound 5/TM11 also showed improved aqueous solubility compared to previously reported TMs. Real-time monitoring of cell growth and flow cytometry analyses showed that 5/TM11 preferentially reduced cell proliferation rather than apoptosis in murine macrophages at immunomodulatory doses. We observed its effects on the innate immune response triggered by lipopolysaccharide (LPS) in macrophages, showing that 5/TM11 significantly reduced the expression of proinflammatory cytokines as Cxcl10 and Il1b.

Keywords: Anti-inflammatory agents; ELAVL1; HuR; HuR inhibitors; LPS; Tanshinone mimics.


Conflict of interest statement

The authors declare no competing interests.

Figures

Fig. 1
Fig. 1
Chemical structure of naturally occurring DHTS I, and early leads 1/TM6a and 2/TM7n.
Fig. 2
Fig. 2
Chemical structure of targeted 3-heteroaryl-containing tanshinone mimics 38(TM9–13).
Scheme 1
Scheme 1
Synthesis of 3-heteroaryl tanshinone mimics 36, 7b/TM9-13. (a) ArB(OH)2, Pd(PPh3)4, 2 M K2CO3, 4:1 DME/EtOH, N2, 100 °C, 8 h, then r.t., 18 h; (b) PdCl2(dppf), 2 M K2CO3, dry dioxane, N2, 100 °C, 8 h, then r.t., 18 h; (c) 1 M BBr3 in dry DCM, dry DCM, N2, − 78 °C to 0 °C, 3–5 h; (d) IBX, DMF, r.t., 2 h; (e) Boc2O, DMAP, dry DCM, .r.t., 3 h, then piperidine, DCM, r.t., 6 h.
Fig. 3
Fig. 3
Biochemical and solubility properties of heterocycle-containing tanshinone mimics. (A) REMSA screening of TMs. rM1M2_HuR (3.7 nM) was incubated for 20 min with 1 nM 5ʹ-DY681-labeled RNA probe alone, together with DMSO used as control, or with 2/TM7n, 3–6 and 7b/TM9-13 at 15 µM. The gel was ~ run at 80 V for 100 min. (B) Representative REMSA showing 5/TM11 (0.01–25 µM) dose–response inhibition of the binding between 3.7 nM rM1M2_HuR and 1 nM 5′-DY681-labeled RNA probe. (C) Titration curves of 5/TM11 obtained from REMSA quantification. The calculated half-maximal inhibitory concentration (IC50) is 0.77 µM. (D) Dose–response inhibition by 5/TM11(0.01–100 µM) of the binding between His-tagged rM1M2 HuR protein (20 nM) and 5′-Bi-TNF ARE probe (50 nM), tested in an HTFR assay. The calculated half-maximal inhibitory concentration (IC50) is 0.68 µM; data have been normalized to control (DMSO), and fit nonlinear regression fitting curve according to a one-site binding model in GraphPad Prism. Plots are mean ± s.d. of three independent experiments. (E) Binding of 2/TM7n and 5/TM11 to M1M2 by SPR—representative data from a single measurement. 1:1 binding model fit of steady state responses of 2/TM7n (diamonds, dashed line) and 5/TM11(circles, full line). (F) Solubility of 5/TM11 via LC-MS. The molecule dissolved in DMSO was serially diluted in aqueous medium (phosphate buffer saline, PBS), incubated for 2 h and injected into an LC-MS. Data analysed and plotted with GraphPad Prism as mean ± s.d. of two independent experiments.
Fig. 4
Fig. 4
Molecular dynamics calculation of HuR-5/TM11 interactions. (A) Schematic representation of the HuR-5/TM11 complex from MD simulation. 5/TM11 is shown in orange sticks, HuR RRM1-RRM2 domains shown in light blue cartoon representation. HuR residues involved in specific interaction with 5/TM11 and inter-domain interactions are highlighted as turquoise or ochre sticks, respectively. Hydrogens are hidden for clarity. (B) Heavy atoms RMSD along MD simulation of HuR-5/TM11 complex. Prior to RMSD calculations, trajectory was aligned on the Cα of the secondary structural elements with respect to the initial MD frame. (C) RRM1–RRM2 centre of mass distance along MD simulation of HuR-5/TM11 complex. Hydrogens were not included in the centre of mass calculation.
Fig. 5
Fig. 5
MEPs of the mRNA model (A7, U8, U9) obtained from the mRNA-HuR crystal (PDB Code: 4ED5) and TMs 3–6/TM9-12 calculated at B3LYP/6–31 + G(d, p)-CPCM theory level.
Fig. 6
Fig. 6
Phenotypic effect of 5/TM11 and 2/TM7n on RAW 264.7 murine macrophages. (A) Viability of cells upon treatment with 5/TM11 was assessed via OZ blue viability assay after 48 h of exposure to the compound, ranging from 1 to 50 µM. The calculated IC50 is identified at 15 µM. Plots are mean ± s.d. of three independent experiments. (B) Cell cycle analysis of RAW 264.7 cultures upon TMs treatment. Cells were treated with TMs for 48 h and stained with propidium iodide for fluorescence-activated cell sorting (FACS) analysis. Starvation (24 h culturing in serum free media) and nocodazole treatment were used as controls for G0/G1 and G2/M cell cycle blockage. Data analyzed and plotted with GraphPad Prism as mean ± s.d. of three independent experiments. (C) Growth curve of RAW 264.7 cells upon TMs treatment. Cells were treated with both TMs for 72 h. Data were acquired and analyzed by IncuCyte. Data plotted with GraphPad Prism as mean ± s.d. of three independent experiments. (D) Activation of Caspase 3/7 in RAW 264.7 cultures upon TMs treatment. Cells were co-treated for 48 h with 2/TM7n or 5/TM11 and the CellEvent™ caspase-3/7 detection reagent. Pictures were acquired every 4 h by IncuCyte. Scale bar 400 μm. Data analyzed and plotted with GraphPad Prism as mean ± s.d. of three independent experiments. (E) Western blot of activated Caspase 3 and PARP of RAW264.7 cells treated with TMs (15 µM) and vehicle (DMSO) control for 48 h and with staurosporin (Stauro − 1 µM) and QVD (10 µM) for the last 4 h. (F) Quantification of the percentage of Annexin V positive cells as a fold change of the control DMSO after the treatment with the TMs and apoptosis controls, in the same conditions as previous. Data was acquired with Symphony A1 and analyzed with BD Diva Software.
Fig. 7
Fig. 7
5/TM11 effect on cytokines expression and release in murine macrophages. (A, B) Expression of cytokines in treated RAW264.7 cultures. Cells were co-treated for 6 h with LPS (1 µg/mL) and 2/TM7n, 5/TM11 (10 µM) or DMSO as control. Expression levels were assessed via qRT-PCR, using RPLP0 as housekeeping gene. Data were normalized to LPS + DMSO condition. Data analysed and plotted with GraphPad Prism as mean ± s.d. of at least three independent experiments. (C) Secretion of cxcl10 in RAW264.7. Cxcl10 secretion was measured via ELISA on RAW264.7 supernatant. Cells were co-treated for 6 h with LPS (1 µg/mL) and 2/TM7n, 5/TM11(10 µM) or DMSO as control. The relative quantity of Cxcl10 pg/mL for each sample was normalized according to the number of cells quantified through Crystal Violet assay. Data were normalized to LPS + DMSO as control, and numbers are expressed as a percentage. Data analysed and plotted with GraphPad Prism as mean ± s.d. of three independent experiments. (D, E) Expression of cytokines in treated RAW264.7 cultures. Cells were stimulated for 2 h with LPS (1 µg/mL) and subsequently treated with 2/TM7n, 5/TM11 (10 µM) or DMSO as control for 4 h. Expression levels were assessed via qRT-PCR, using RPLP0 as a housekeeping gene. Data were normalized to LPS + DMSO condition. Data analysed and plotted with GraphPad Prism as mean ± s.d. of at least three independent experiments. (F) Secretion of cxcl10 in RAW264.7 cells. Cxcl10 secretion was measured via ELISA on RAW264.7 supernatant. Cells were stimulated for 2 h with LPS (1 µg/mL) and subsequently treated with 2/TM7n, 5/TM11 (10 µM) or DMSO. The relative quantity of Cxcl10 pg/mL for each sample was normalized according to the number of cells quantified through Crystal Violet assay. Data were normalized to LPS + DMSO as control, and numbers are expressed as a percentage. Data analysed and plotted with GraphPad Prism as mean ± s.d. of three independent experiments.

References

    1. Chaplin, D. D. Overview of the immune response. J. Allergy Clin. Immunol. 125, S3–S23. 10.1016/j.jaci.2009.12.980 (2010). - PMC - PubMed
    1. Tucureanu, M. M. et al. Lipopolysaccharide-induced inflammation in monocytes/macrophages is blocked by liposomal delivery of G. Int. J. Nanomed. 13, 63–76. 10.2147/IJN.S150918 (2018). - PMC - PubMed
    1. Ngkelo, A., Meja, K., Yeadon, M., Adcock, I. & Kirkham, P. A. LPS induced inflammatory responses in human peripheral blood mononuclear cells is mediated through NOX4 and Giα dependent PI-3 kinase signalling. J. Inflamm. 9, 1. 10.1186/1476-9255-9-1 (2012). - PMC - PubMed
    1. Tiedje, C. et al. The RNA-binding protein TTP is a global post-transcriptional regulator of feedback control in inflammation. Nucleic Acids Res. 44, 7418–7440. 10.1093/nar/gkw474 (2016). - PMC - PubMed
    1. Tiedje, C. et al. The p38/MK2-driven exchange between tristetraprolin and HuR regulates AU-rich element-dependent translation. PLoS Genet. 8, e1002977. 10.1371/journal.pgen.1002977 (2012). - PMC - PubMed