

The pericoronary adipose tissue attenuation in CT strongly depends on kernels and iterative reconstructions
- PMID: 39424654
- PMCID: PMC12021981
- DOI: 10.1007/s00330-024-11132-5
The pericoronary adipose tissue attenuation in CT strongly depends on kernels and iterative reconstructions
Abstract
Objectives: To investigate the influence of kernels and iterative reconstructions on pericoronary adipose tissue (PCAT) attenuation in coronary CT angiography (CCTA).
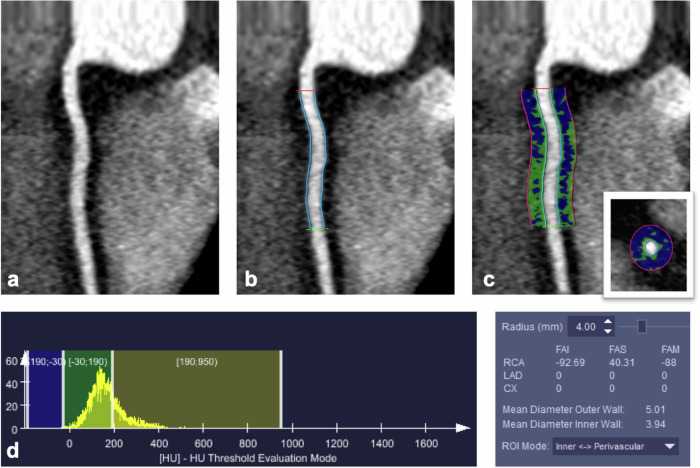
Materials and methods: Twenty otherwise healthy subjects (16 females; median age 52 years) with atypical chest pain, low risk of coronary artery disease (CAD), and without CAD in photon-counting detector CCTA were included. Images were reconstructed with a quantitative smooth (Qr36) and three vascular kernels of increasing sharpness levels (Bv36, Bv44, Bv56). Quantum iterative reconstruction (QIR) was either switched-off (QIRoff) or was used with strength levels 2 and 4. The fat-attenuation-index (FAI) of the PCAT surrounding the right coronary artery was calculated in each dataset. Histograms of FAI measurements were created. Intra- and inter-reader agreements were determined. A CT edge phantom was used to determine the edge spread function (ESF) for the same datasets.
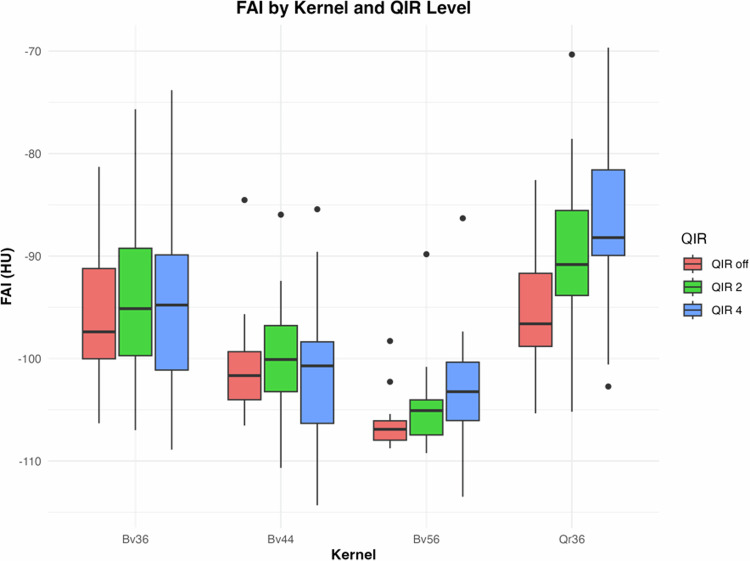
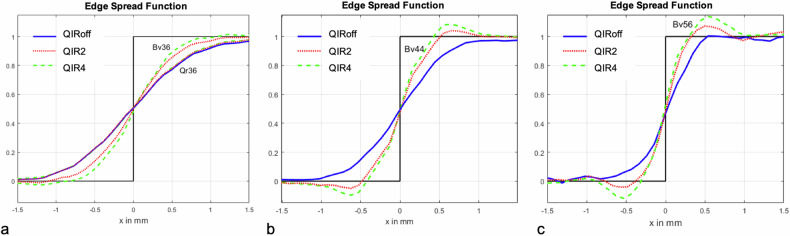
Results: Intra- and inter-reader agreement of FAI was excellent (intra-class correlation coefficient = 0.99 and 0.98, respectively). Significant differences in FAI were observed depending on the kernel and iterative reconstruction strength level (each, p < 0.001), with considerable inter-individual variation up to 34 HU and intra-individual variation up to 33 HU, depending on kernels and iterative reconstruction levels. The ESFs showed a reduced range of edge-smoothing with increasing kernel sharpness, causing an FAI decrease. Histogram analyses revealed a narrower peak of PCAT values with increasing iterative reconstruction levels, causing a FAI increase.
Conclusions: PCAT attenuation determined with CCTA heavily depends on kernels and iterative reconstruction levels both within and across subjects. Standardization of CT reconstruction parameters is mandatory for FAI studies to enable meaningful interpretations.
Key points: Question Do kernels and iterative reconstructions influence pericoronary adipose tissue (PCAT) attenuation in coronary CT angiography (CCTA)? Findings Significant differences in fat-attenuation-index (FAI) were observed depending on the kernel and iterative reconstruction strength level with considerable inter- and intra-individual variation. Clinical relevance PCAT attenuation heavily depends on kernels and iterative reconstructions requiring CT reconstruction parameter standardization to enable meaningful interpretations of fat-attenuation differences across subjects.
Keywords: Computed tomography angiography; Image reconstruction; Inflammation; Pericoronary adipose tissue.
© 2024. The Author(s).
Conflict of interest statement
Compliance with ethical standards. Guarantor: The scientific guarantor of this publication is Professor Hatem Alkadhi. Conflict of interest: Diagnostic and Interventional Radiology Department of University Hospital Zurich reports a relationship with Bayer, Canon, Guerbet, Siemens that includes: funding grants. Hatem Alkadhi and Matthias Eberhard report a relationship with Siemens Healthineers AG that includes a speaking Honorarium. They are also members of the European Radiology Editorial Board. They have not taken part in the review or selection process of this article. Statistics and biometry: No complex statistical methods were necessary for this paper. Informed consent: Informed consent was obtained from all subjects (patients) in this study. Ethical approval: Institutional Review Board approval was obtained. Study subjects or cohorts overlap: No study subjects or cohorts have been previously reported. Methodology: Retrospective Observational Performed at one institution
Figures

References
-
- Mazurek T, Zhang L, Zalewski A et al (2003) Human epicardial adipose tissue is a source of inflammatory mediators. Circulation 108:2460–2466. 10.1161/01.CIR.0000099542.57313.C5 - PubMed
-
- Margaritis M, Antonopoulos AS, Digby J et al (2013) Interactions between vascular wall and perivascular adipose tissue reveal novel roles for adiponectin in the regulation of endothelial nitric oxide synthase function in human vessels. Circulation 127:2209–2221. 10.1161/CIRCULATIONAHA.112.001133 - PubMed
-
- Oikonomou EK, Marwan M, Desai MY et al (2018) Non-invasive detection of coronary inflammation using computed tomography and prediction of residual cardiovascular risk (the CRISP CT study): a post-hoc analysis of prospective outcome data. Lancet 392:929–939. 10.1016/S0140-6736(18)31114-0 - PMC - PubMed
-
- Dai X, Deng J, Yu M et al (2020) Perivascular fat attenuation index and high-risk plaque features evaluated by coronary CT angiography: relationship with serum inflammatory marker level. Int J Cardiovasc Imaging 36:723–730. 10.1007/s10554-019-01758-8 - PubMed
MeSH terms
Grants and funding
LinkOut - more resources
Full Text Sources
Medical
Miscellaneous
