

The Application of ImageJ Software for Roughness Analysis of Dental Implants
- PMID: 39424666
- PMCID: PMC12092845
- DOI: 10.1007/s10278-024-01298-1
The Application of ImageJ Software for Roughness Analysis of Dental Implants
Abstract
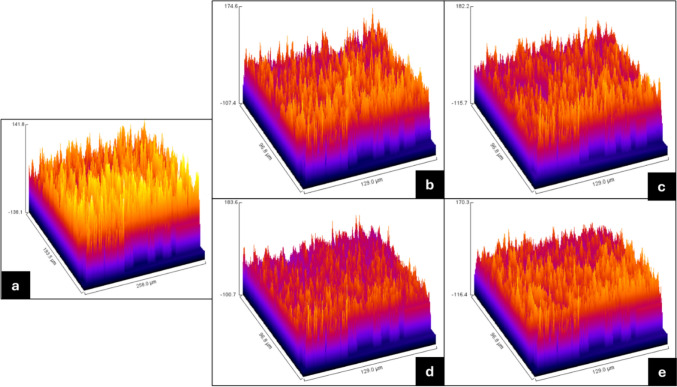
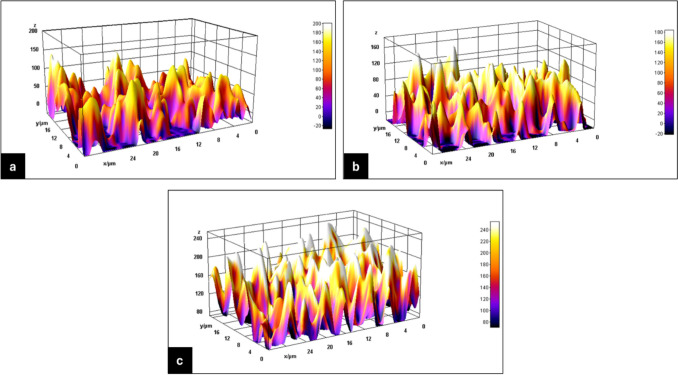
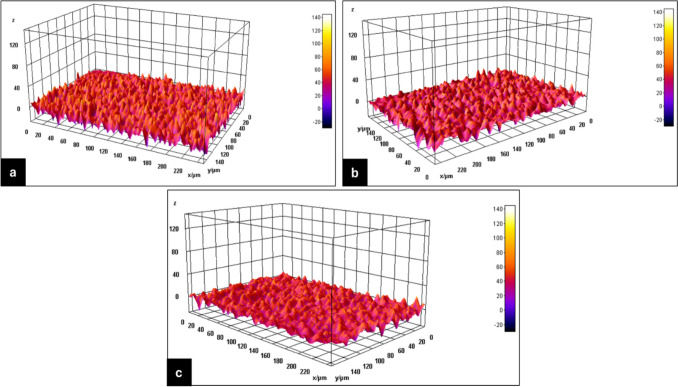
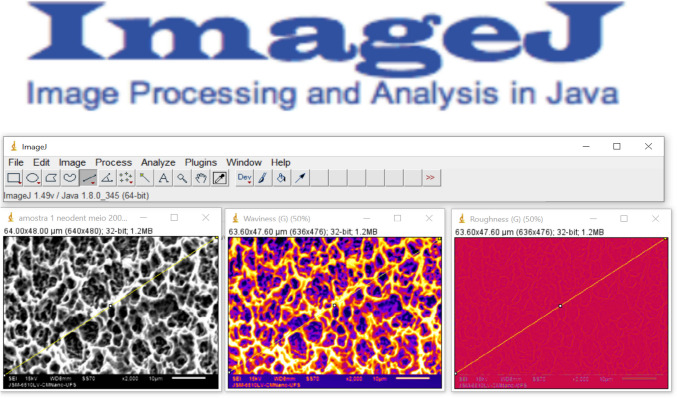
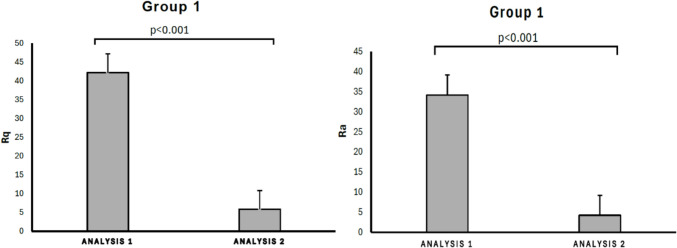
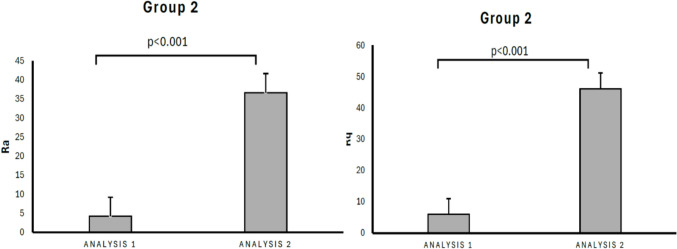
ImageJ software is a versatile, open-source software for visualizing, processing, and analyzing images, which has contributed to its widespread adoption in the scientific community. A notable application of this software is its integration with scanning electron microscope images, where surface roughness can be quantified. This study aims to highlight the need for knowledge and standardization of the technique selected for analysis to ensure the viability of ImageJ software as a reliable alternative for evaluating the surface roughness of dental implants. Images obtained by scanning electron microscopy, depending on the plugin used or the researcher's standardization, yielded different surface roughness values, which were assessed via ImageJ. Thirty grade 4 titanium osseointegrated dental implants via all treated with similar surface treatment methods were studied. Two groups were formed for analysis via ImageJ: Group 1 assessed surface roughness using only the SurfCharJ plugin (n = 12), and Group 2 assessed surface roughness using both the roughness/waviness and SurfCharJ plugin (n = 18). The results showed that the use of different plugins can lead to different outcomes, potentially affecting the quality of the study. This study concluded that a standardized methodology is necessary to ensure consistency in results obtained via ImageJ.
Keywords: Dental implants; Digital profilometry; ImageJ software; Roughness; Scanning electron microscopy; Surface properties.
© 2024. The Author(s) under exclusive licence to Society for Imaging Informatics in Medicine.
Conflict of interest statement
Declarations. Competing Interests: The authors declare no competing interests.
Figures
References
-
- Kang Ch, Hashitsume K, Jang E, Kolya H. Relationship between Wood Anatomical Features and Surface Roughness Characteristics. In: Wood Research, 68 (3), 455–464, 2023.
-
- Balderrama ÍF, de Toledo Stuani V, Cardoso MV, Oliveira RC, Lopes MMR, Greghi, SLA. The influence of implant surface roughness on decontamination by antimicrobial photodynamic therapy and chemical agents: A preliminary study in vitro. Photodiagnosis and Photodynamic Therapy, v. 33, p. 102105, 2021. - PubMed
-
- Martinez MAF, Balderrama ÍDF, Karam PSBH, de Oliveira RC, de Oliveira FA, Grandini CR, et al. Surface roughness of titanium disks influences the adhesion, proliferation and differentiation of osteogenic properties derived from human. International journal of implant dentistry, v. 6, n. 1, p. 1-11, 2020. - PMC - PubMed
MeSH terms
Substances
LinkOut - more resources
Full Text Sources