. 2025 Jan;39(1):189-198.
doi: 10.1038/s41375-024-02431-3. Epub 2024 Oct 18.

Single-cell transcriptomics of pediatric Burkitt lymphoma reveals intra-tumor heterogeneity and markers of therapy resistance

Affiliations

Single-cell transcriptomics of pediatric Burkitt lymphoma reveals intra-tumor heterogeneity and markers of therapy resistance

Clarissa Corinaldesi et al. Leukemia. 2025 Jan.

Abstract

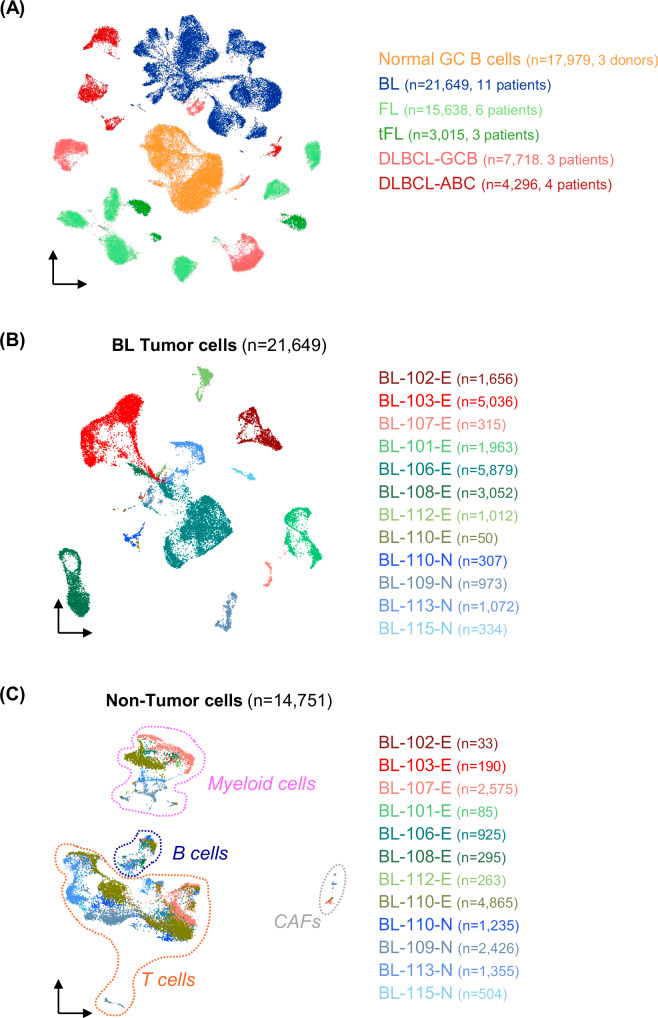
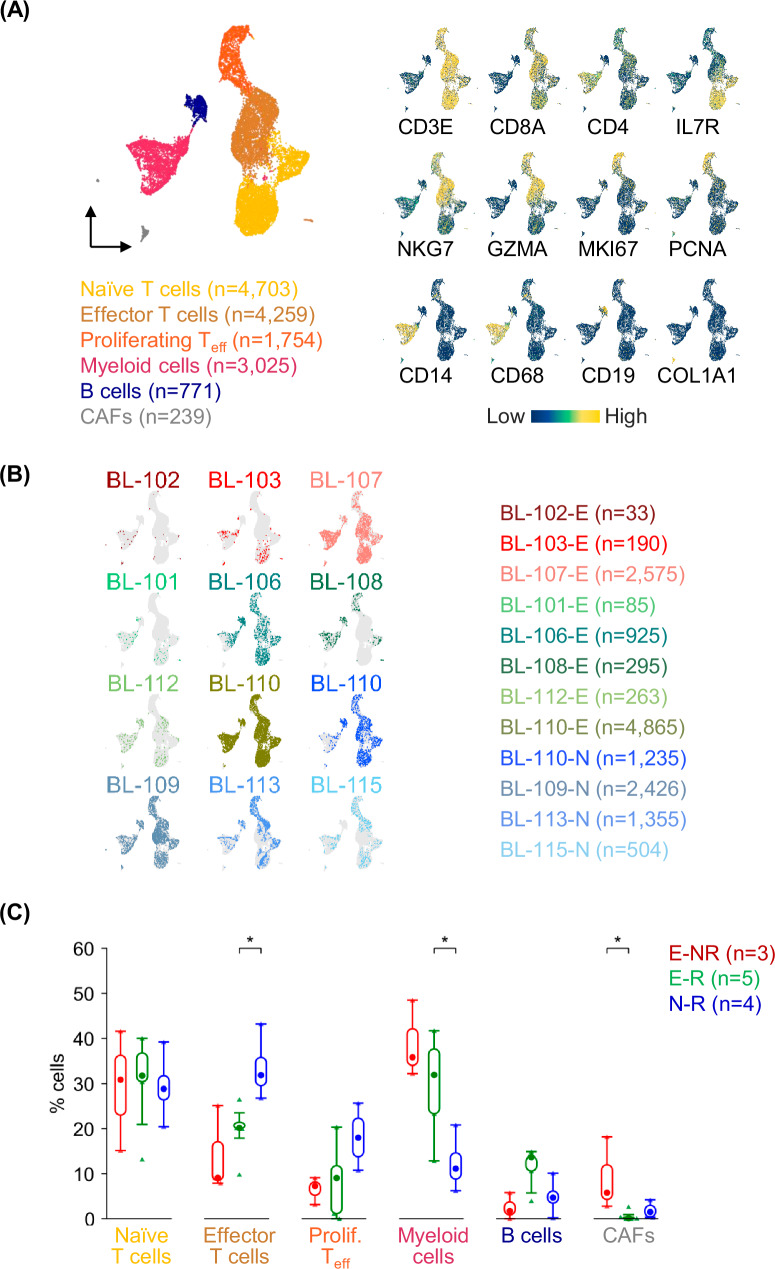
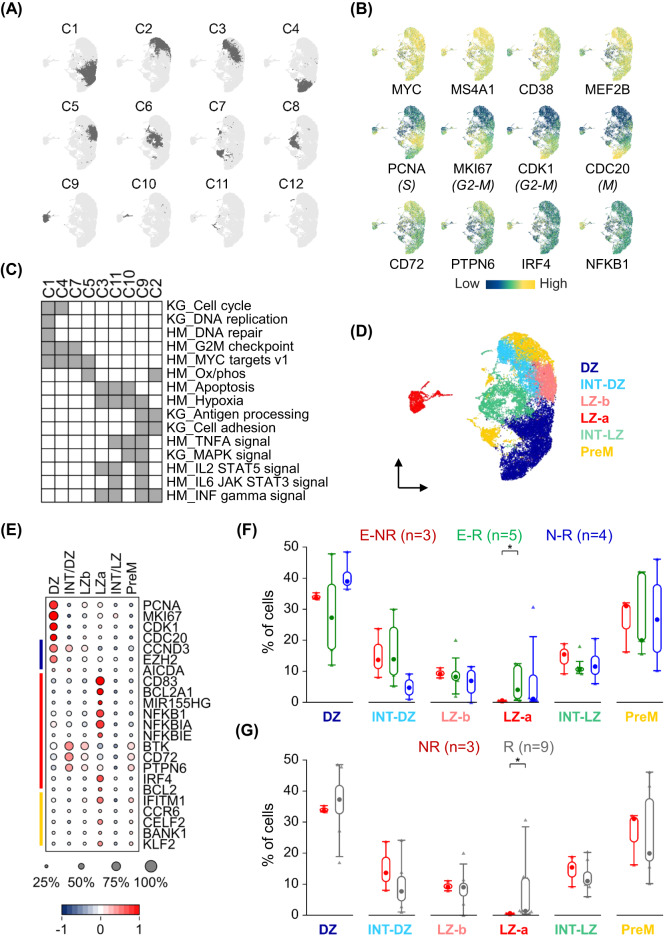
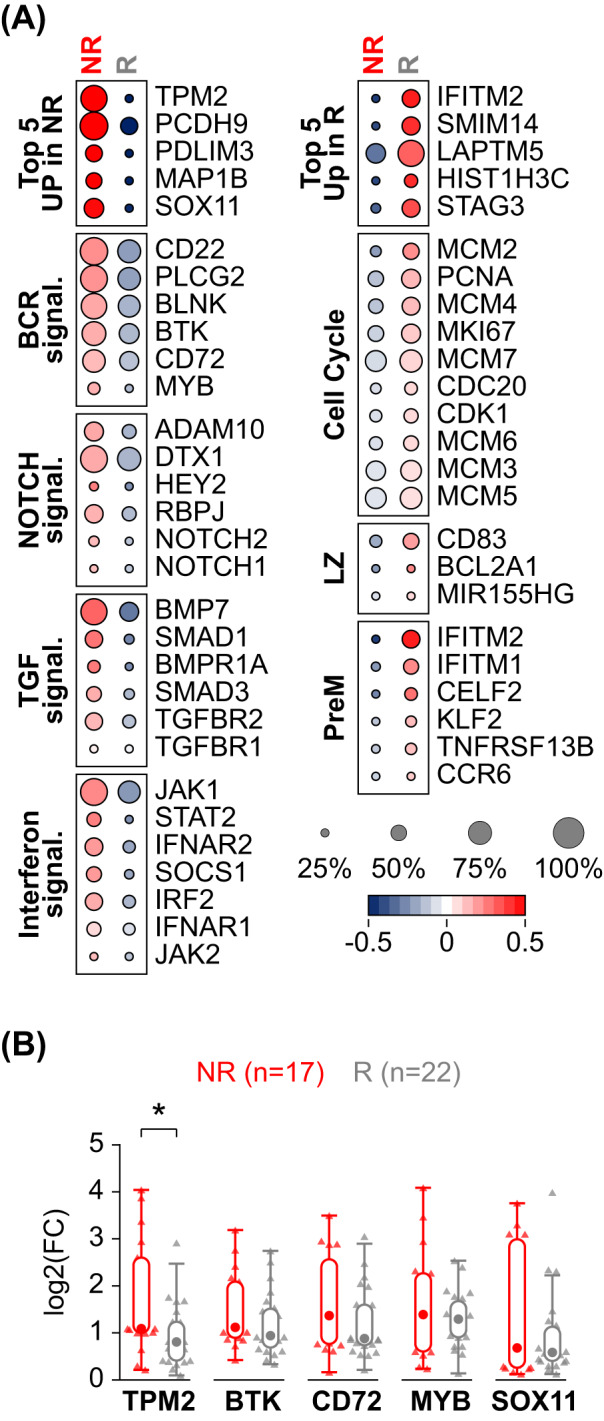
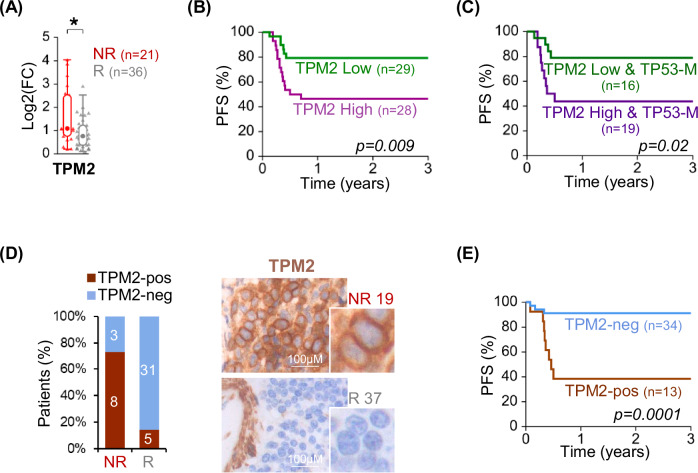
Burkitt lymphoma (BL) is the most frequent B-cell lymphoma in pediatric patients. While most patients are cured, a fraction of them are resistant to therapy. To investigate BL heterogeneity and the features distinguishing therapy responders (R) from non-responders (NR), we analyzed by single-cell (sc)-transcriptomics diagnostic EBV-negative BL specimens. Analysis of the non-tumor component revealed a predominance of immune cells and a small representation of fibroblasts, enriched in NR. Tumors displayed patient-specific features, as well as shared subpopulations that expressed transcripts related to cell cycle, signaling pathways and cell-of-origin signatures. Several transcripts were differentially expressed in R versus NR. The top candidate, Tropomyosin 2 (TPM2), a member of the tropomyosin actin filament binding protein family, was confirmed to be significantly higher in NR both at the transcript and protein level. Stratification of patients based on TPM2 expression at diagnosis significantly correlated with prognosis, independently of TP53 mutations. These results indicate that BL displays transcriptional heterogeneity and identify candidate biomarkers of therapy resistance.


Conflict of interest statement

Competing interests: The authors declare no competing interests.

Figures

Fig. 1
Fig. 1. Heterogeneity in the tumor cell transcriptome of GC-derived lymphomas.
UMAP projections of sc-transcriptomic profiles of: A normal GC B cells and tumor cells isolated from BL, follicular lymphoma (FL), transformed-FL (tFL), and diffuse large B cell lymphoma (DLBCL), including both GCB and ABC subtypes [8, 32, 33]; B 21,649 BL tumor cells isolated from 12 diagnostic specimens (11 patients); C 14,751 normal tumor-infiltrating cells isolated from the same BL specimens. Immunoglobulin gene transcripts were excluded. E Effusion, N nodal; CAFs cancer-associated fibroblasts.
Fig. 2
Fig. 2. Tumor-infiltrating normal cells include multiple immune cell types.
A UMAP projection of sc-transcriptomic profiles of 14,751 normal tumor-infiltrating cells, labeled based on the identified populations. Relative gene expression is displayed as UMAP/heatmap with colors representing the z-scored log2 normalized expression. B UMAP projections of normal tumor-infiltrating cells, as shown in (A), color-coded based on the cells contributed by each specimen. C Box and Whisker plots displaying the distribution of normal tumor-infiltrating cells in the dataset stratified by sample origin (E effusion, N nodal) and response to therapy (non-responders, NR, and responders, R). A Mann-Whitney U Test was used to compare data sets pairwise (*p < 0.05).
Fig. 3
Fig. 3. BL intra-tumor heterogeneity reflects similarities with distinct normal GC subpopulations.
A UMAP projection and cluster identification using sc-transcriptomic profiles of 21,649 BL tumor cells. B Relative gene expression displayed as UMAP/heatmap with colors representing the z-scored log2 normalized expression. C Pathway enrichment analysis for the gene signatures (top 100 upregulated) associated with the clusters identified in (A). Relevant pathways from KEGG (KG) and Hallmark (HM) databases that are significantly enriched (hypergeometric test with Benjamini-Hochberg correction, q < 0.05) are shown in gray. D UMAP projection of BL tumor cells as displayed in (A) and colored based on the highest correlation of each cluster with previously reported signatures of normal GC B cell subpopulations [9]. DZ dark zone, INT intermediate, LZ light zone, PreM memory precursors. E Heat map displaying a subset of differentially expressed genes in the subgroups identified in (D). The color bars on the left indicate genes associated with the DZ (blue), LZ (red) or PreM (yellow) signatures. The size of the dot indicates the percentage of cells with detectable expression, and the color shows the z-scored average (log2) normalized expression within a group. Box and Whisker plots displaying the distribution across the GC-related subgroups of BL tumor cells stratified by: F sample origin (E effusion, N nodal); G response to therapy (NR non-responders, R responders). A Mann-Whitney U Test was used to compare data sets pairwise (*p < 0.05).
Fig. 4
Fig. 4. Identification of transcriptional features related to response to therapy.
A Heat map displaying a subset of differentially expressed genes in sc-transcriptomic profiles of tumor cells from non-responders (NR) and responders (R) to therapy. The size of the dot indicates the percentage of cells with detectable expression, and the color shows the z-scored average (log2) normalized expression within a group. B Box and Whisker plots displaying the expression fold change of selected genes in diagnostic specimens of NR versus R, as detected by qRT-PCR. A Mann-Whitney U Test was used to compare data sets pairwise (*p < 0.05).
Fig. 5
Fig. 5. TPM2 is a prognostic biomarker in pediatric EBV-negative BL.
A Box and Whisker plot displaying TPM2 expression fold change in diagnostic specimens of 21 non-responder (NR) and 36 responder (R) patients, as detected by qRT-PCR. (*p < 0.05 by Mann-Whitney U Test). B Kaplan-Meier plot for progression free survival (PFS) analysis in the BL patients (n = 57) stratified based on expression of TPM2 transcript, as detected by qRT-PCR in (A). “TPM2 low” and “TPM2 high” are patients with TPM2 expression below and above the median expression in the dataset, respectively. C Kaplan-Meier plot for PFS analysis in the subset of patients (n = 35) carrying mutated TP53 and stratified based on expression of TPM2 transcript, as detected by qRT-PCR in (A). D Bar plot displaying the percentage of cases which scored as positive (TPM2-pos) or negative (TPM2-neg) for TPM2 protein expression, as detected by IHC analysis in 11 NR and 36 R patients. (Right) Representative images of TPM2 detection by IHC in BL nodal diagnostic biopsies from a R (R37) and a NR (NR19). TPM2 expression is detectable in the tumor cells of the NR and in the normal muscle, stroma, and macrophages of all specimens. E Kaplan-Meier plot for PFS analysis in BL patients (n = 47) stratified based on TPM2 protein expression in the tumor cells.

References

    1. Burkhardt B, Zimmermann M, Oschlies I, Niggli F, Mann G, Parwaresch R, et al. The impact of age and gender on biology, clinical features and treatment outcome of non-Hodgkin lymphoma in childhood and adolescence. Br J Haematol. 2005;131:39–49. 10.1111/j.1365-2141.2005.05735.x. - PubMed
    1. Roschewski M, Staudt LM, Wilson WH. Burkitt’s lymphoma. N Engl J Med. 2022;387:1111–22. 10.1056/NEJMra2025746. - PubMed
    1. Schmitz R, Ceribelli M, Pittaluga S, Wright G, Staudt LM. Oncogenic mechanisms in Burkitt lymphoma. Cold Spring Harbor Perspect. Med. 2014; 4, 10.1101/cshperspect.a014282. - PMC - PubMed
    1. Magrath I. Epidemiology: clues to the pathogenesis of Burkitt lymphoma. Br J Haematol. 2012;156:744–56. 10.1111/j.1365-2141.2011.09013.x. - PubMed
    1. Basso K, Dalla-Favera R. Germinal centres and B cell lymphomagenesis. Nat Rev Immunol. 2015;15:172–84. 10.1038/nri3814. - PubMed