. 2025 Oct;43(10):1694-1707.
doi: 10.1038/s41587-024-02447-1. Epub 2024 Oct 18.

Droplet Hi-C enables scalable, single-cell profiling of chromatin architecture in heterogeneous tissues

Affiliations

Droplet Hi-C enables scalable, single-cell profiling of chromatin architecture in heterogeneous tissues

Lei Chang et al. Nat Biotechnol. 2025 Oct.

Erratum in

Abstract

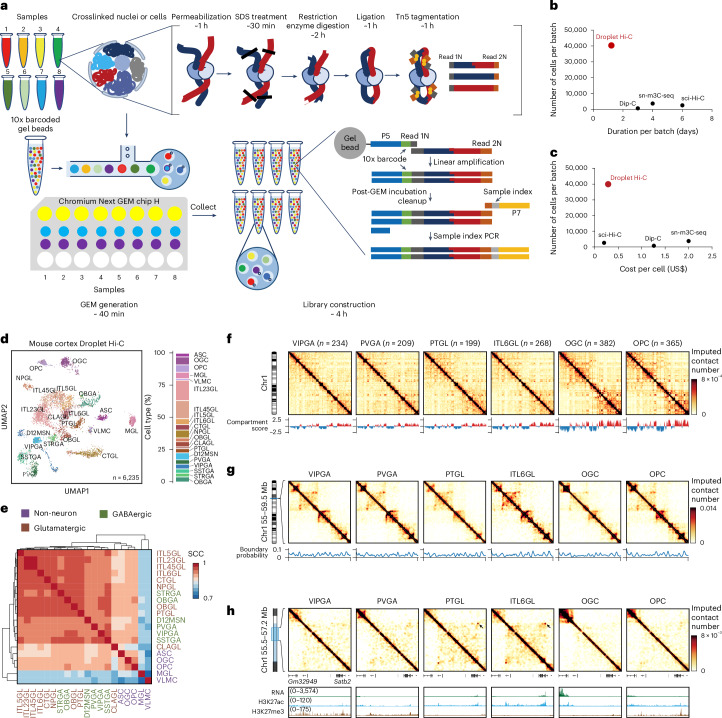
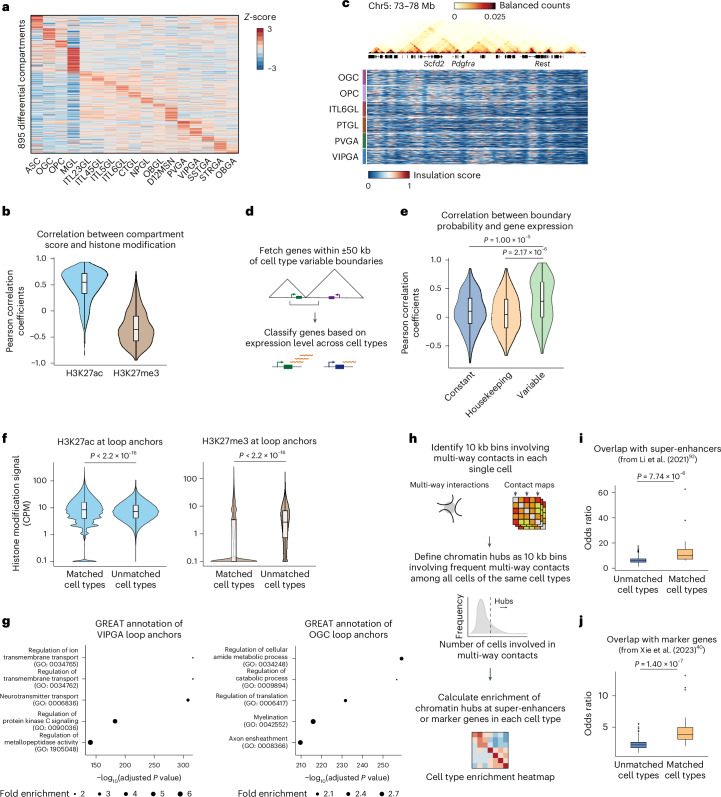
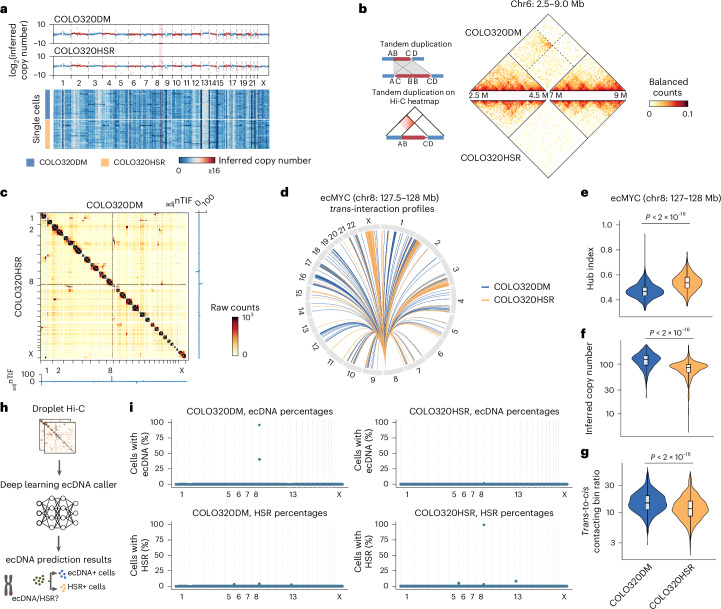
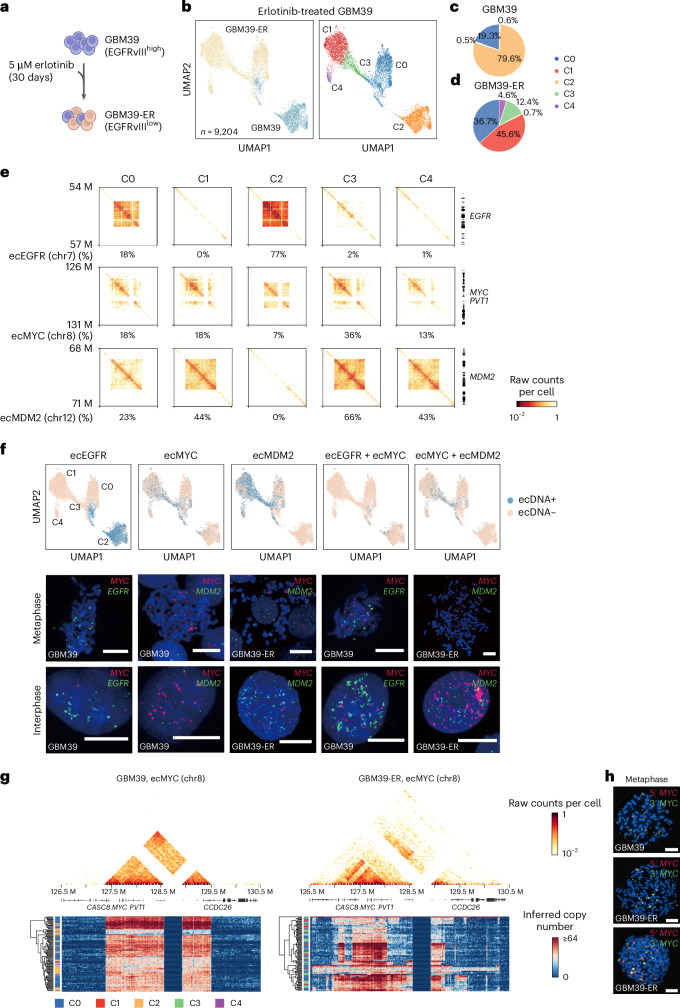
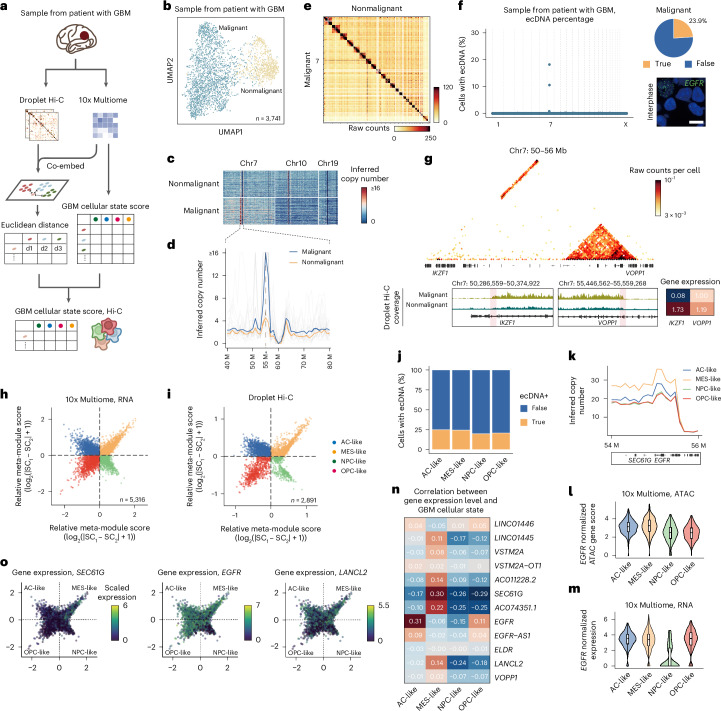
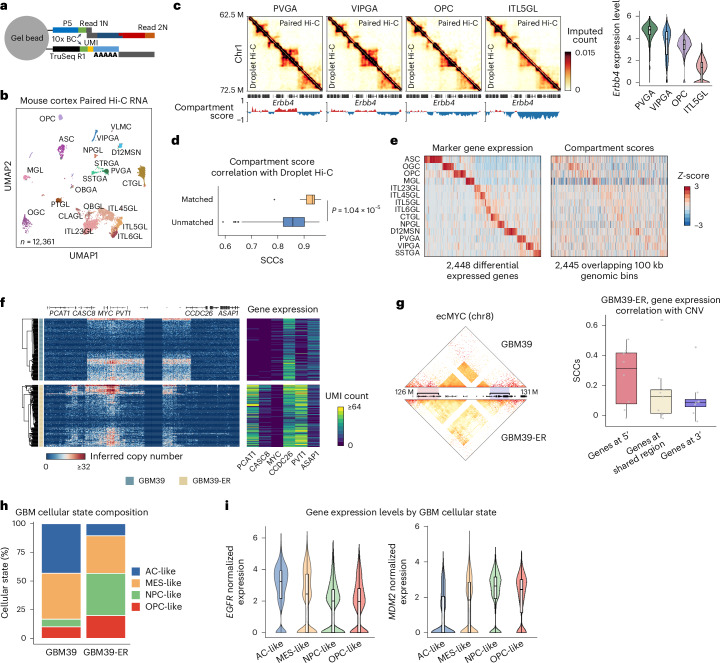
Current methods for analyzing chromatin architecture are not readily scalable to heterogeneous tissues. Here we introduce Droplet Hi-C, which uses a commercial microfluidic device for high-throughput, single-cell chromatin conformation profiling in droplets. Using Droplet Hi-C, we mapped the chromatin architecture of the mouse cortex and analyzed gene regulatory programs in major cortical cell types. In addition, we used this technique to detect copy number variations, structural variations and extrachromosomal DNA in human glioblastoma, colorectal and blood cancer cells, revealing clonal dynamics and other oncogenic events during treatment. We refined the technique to allow joint profiling of chromatin architecture and transcriptome in single cells, facilitating exploration of the links between chromatin architecture and gene expression in both normal tissues and tumors. Thus, Droplet Hi-C both addresses critical gaps in chromatin analysis of heterogeneous tissues and enhances understanding of gene regulation.


Conflict of interest statement

Competing interests: B.R. is a cofounder of Epigenome Technologies, Inc. and has equity in Arima Genomics, Inc. The other authors declare no competing interests.

Figures

Fig. 1
Fig. 1. Overview and performance of Droplet Hi-C.
a, Schematic of the Droplet Hi-C workflow. b,c, Comparison of throughput, sample preparation time (b) and cost (c) among different single-cell Hi-C methods. d, UMAP visualization of Droplet Hi-C data from the adult mouse cortex. ASC, astrocyte; MGL, microglia; VLMC, vascular and leptomeningeal cell; ITL45GL, intratelencephalic projecting neuron in cortical layer 4/5; CTGL, corticothalamic projection glutamatergic neuron in cortex; NPGL, near-projecting glutamatergic neuron in cortex; OBGL, glutamatergic neuron in anterior olfactory nucleus; CLAGL, glutamatergic neuron in claustrum; D12MSN, D1/D2-type medium spiny neuron; SSTGA, Sst+ GABAergic neuron; STRGA, GABAergic neuron in striatum; OBGA, GABAergic neuron in olfactory bulb. e, Genome-wide SCCs among compartment scores from different cell types. f, Cell-type-specific Droplet Hi-C contact maps from chr1 and compartment score at 100 kb resolution. g, Cell-type-specific Droplet Hi-C contact maps and boundary probabilities of the example region (chr1: 55–59.5 Mb) at 25 kb resolution. h, Cell-type-specific Droplet Hi-C contact maps surrounding gene Satb2 (chr1: 55.5–57.2 Mb) at 10 kb resolution, along with a genome browser view showing transcriptome and histone modification profiles in the same cell types from the public datasets. Source data
Fig. 2
Fig. 2. Comparative analysis of the chromatin compartments, TADs, loops and chromatin hubs across different cell types in the adult mouse cortex.
a, Heatmap showing compartment scores of differential compartments among all cell types. b, Distribution of Pearson correlation coefficients between compartment scores and histone modification signals at each 100 kb bin among differential compartments; n = 895 (H3K27ac and H3K27me3). c, Comparison of single-cell insulation scores from example cell types surrounding gene Pdgfra. A bulk contact map at 10 kb resolution is shown above. d, Schematic for correlation analysis between boundary probability and nearby gene expression level. e, Violin plots showing Pearson correlation coefficients between gene expression level and boundary probability at variable domain boundaries among different cell types in the mouse cortex (n = 2 biologically independent experiments), with genes selected for clustering being excluded for analysis. Genes are classified as constant (n = 353), housekeeping (n = 479) or variable (n = 103) based on snRNA-seq reference and literature. P values were calculated by one-sided Wilcoxon rank-sum test. f, Comparison of histone modification signal enrichment at loop anchors among different cell types; n = 265,277 (all groups); P values were calculated by two-sided Wilcoxon signed-rank test. g, Top enriched GO terms for genes at loop anchors in selected cell types, VIPGA and OGC. P values and fold enrichment were calculated by binomial test. Benjamini–Hochberg FDRs were then calculated to select overrepresented GO terms. h, Diagram of the method for identifying chromatin hubs involving multi-way interactions from Droplet Hi-C data. i, Box plots showing the overlap between chromatin hubs and super-enhancers in matched (n = 16) and unmatched (n = 240) mouse cortical cell types. The odds ratio was calculated by Fisher exact test. P values were calculated by one-sided Wilcoxon signed-rank test. Data from ref. . j, Box plots showing the overlap between chromatin hubs and cell-type-specific marker genes in matched (n = 18) and unmatched (n = 306) cortical cell types, similar to i (n = 2 biologically independent experiments). Data from ref. . All box plot (b,e,f,i,j) hinges were drawn from the 25th to 75th percentiles, with the middle line denoting the median and the whiskers denoting 2 × the interquartile range. Source data
Fig. 3
Fig. 3. Droplet Hi-C detects SVs and ecDNAs in cancer cell lines.
a, DNA copy numbers inferred from pseudo-bulk Droplet Hi-C profiles in COLO320DM and COLO320HSR are plotted along the genome (upper panel). The heatmap (lower panel) shows representative single-cell CNVs in each sample. The ecMYC bins in COLO320DM are highlighted in pink. b, Example of a sample-specific SV on chr6, predicted with EagleC. An illustration explaining the rearranged contact pattern is shown on the left. c, Comparison of genome-wide contact maps and adjnTIF between COLO320DM and COLO320HSR. d, A circos plot showing trans-interaction profiles of the genomic bin containing MYC in COLO320DM and COLO320HSR. eg, Distribution of single-cell hub indexes (e), inferred copy numbers (f) and trans-to-cis contacting bin ratios (g) of ecMYC in COLO320DM and COLO320HSR. n = 1,352 (hub index, COLO320DM), 1,366 (hub index, COLO320HSR), 1,426 (inferred copy number and trans-to-cis contacting bin ratio, COLO320DM) and 1,535 (inferred copy number and trans-to-cis contacting bin ratio, COLO320HSR); P values are from a one-sided Wilcoxon signed-rank test. h, Schematic of a deep-learning-based ecDNA caller. i, Dot plots showing genome-wide ecDNA and HSR prediction results from the deep-learning-based ecDNA caller for COLO320DM and COLO320HSR cells. All box plot (eg) hinges were drawn from the 25th to 75th percentiles, with the middle line denoting the median and the whiskers denoting 2 × the interquartile range. Source data
Fig. 4
Fig. 4. Droplet Hi-C reveals heterogeneity and evolution of ecDNAs in the GBM cell line before and after drug treatment.
a, Illustration of the erlotinib treatment procedure for GBM39 cells. b, UMAP embedding visualization and clustering analysis of Droplet Hi-C data from GBM39 before and after erlotinib treatment. c,d, Pie charts showing the cell proportion of each cluster in GBM39 (c) and GBM39-ER (d). e, Comparison of contact maps and percentages of ecDNA-positive cells among all clusters for ecEGFR, ecMYC and ecMDM2. Genomic coordinates for key oncogenes are shown on the right. f, UMAP embedding visualization of ecDNA-positive and ecDNA-negative cells in GBM39 and GBM39-ER. DNA FISH of the indicated ecDNA combinations in metaphase and interphase cells is shown as validation (n = 2 biologically independent experiments). The ecDNA species are specified on top of the UMAP plots. Scale bars, 10 μm. g, Pseudo-bulk contact maps at 10 kb resolution showing the ecMYC local structure in both GBM39 and GBM39-ER samples. Heatmaps representing representative single-cell inferred CNVs in the same genomic range are shown below. h, DNA FISH with probes targeting in 5′ or 3′ regions of the MYC gene in GBM39 and GBM39-ER. Scale bars, 10 μm. Source data
Fig. 5
Fig. 5. Droplet Hi-C reveals intra-tumoral heterogeneity and ecDNA in a primary glioblastoma sample.
a, Schematic of GBM cellular state analysis for Droplet Hi-C data by co-embedding with reference 10x Genomics Multiome data. b, UMAP visualization of Droplet Hi-C data on the sample from the patient with GBM. c, Representative single-cell inferred CNVs on chr7, chr10 and chr19 in malignant and nonmalignant populations identified from Droplet Hi-C. d, Line plot showing copy numbers among single cells in malignant and nonmalignant populations. The colored lines highlight the median profiles. The single-cell copy number profile examples are in gray (n = 20). e, Genome-wide contact maps from malignant and nonmalignant populations. The color bars show the raw contact numbers. f, The ecDNA prediction results of the sample from the patient with GBM. The percentage of cells predicted to contain ecEGFR in the malignant population is shown in a pie chart. An interphase DNA FISH image of EGFR shows cells harboring ecEGFR in the GBM sample (n = 2 technically independent experiments). Scale bar, 10 μm. g, An example of malignant population-specific SV. A genome browser view showing the Droplet Hi-C read coverage at associated genes shown below. Predicted breakpoints of SV are highlighted in pink. The gene expression level (RPKM) of associated genes in different populations from 10x Genomics Multiome is also shown. h,i, Two-dimensional representation of cellular states based on scRNA-seq data from 10x Genomics Multiome (h) and Droplet Hi-C (i) data. Each quadrant corresponds to one cellular state. j, The percentages of ecEGFR-positive cells among the four different GBM cellular states. n = 563 (AC-like), 600 (MES-like), 247 (NPC-like) and 346 (OPC-like). k, Inferred copy number at 100 kb resolution of regions on ecEGFR among different GBM cellular states. l,m, Violin plots showing EGFR ATAC gene scores (l) and EGFR gene expression levels (m) among the four different GBM cellular states from the 10x Genomics Multiome dataset. Only cells with GBM cellular state scores that pass the cutoff (±0.5) are shown. n = 244 (AC-like), 410 (MES-like), 125 (NPC-like) and 263 (OPC-like). n, Heatmap showing SCCs between GBM cellular state scores and gene expression levels for all the genes located on ecEGFR. o, Two-dimensional representation of the GBM cellular states, colored by the expression levels of indicated genes on ecDNA. All box plot (l,m) hinges were drawn from the 25th to 75th percentiles, with the middle line denoting the median and the whiskers denoting 2 × the interquartile range. Source data
Fig. 6
Fig. 6. Joint profiling of chromatin architecture and transcriptome in single cells with Paired Hi-C.
a, Schematic of the Paired Hi-C molecule barcoding step with the 10x Genomics Multiome kit. BC, cell barcode. b, UMAP visualization of mouse cortex Paired Hi-C RNA-seq data. c, Comparison of pseudo-bulk contact maps between Droplet Hi-C and Paired Hi-C at the region surrounding gene Erbb4, along with compartment score profiles from Paired Hi-C in representative cell types (n = 3 biologically independent experiments). The color bar shows the imputed contact number. Violin plots of Erbb4 expression levels in representative cell types are also shown. d, Box plots showing SCCs of compartment scores between matched and unmatched cell types in Droplet Hi-C and Paired Hi-C. n = 15 (matched) and 225 (unmatched). P values were calculated by one-sided Wilcoxon signed-rank test. e, Heatmaps showing marker gene expression levels and compartment scores of corresponding 100 kb bins among all cell types. f, Single-cell inferred copy number heatmaps of the region (chr8: 126.5–130.5 Mb) harboring ecMYC in GBM39 and GBM39-ER. Single-cell UMI count heatmaps of representative genes on ecMYC are also shown. g, SCCs between gene expression levels and copy numbers for ecMYC genes in 5′ or 3′ variable regions or shared regions in GBM39-ER are shown. An illustration of ecMYC variable regions is shown on the left. n = 9 (5′ gene), 10 (shared) and 11 (3′ gene). h, Comparison of cell proportions of the four GBM cellular states between GBM39 and GBM39-ER samples. i, Comparison of expression levels of EGFR and MDM2 among the four GBM cellular states. n = 4,307 (AC-like), 6,791 (MES-like), 4,945 (NPC-like) and 3,123 (OPC-like). All box plot (c,d,g,i) hinges were drawn from the 25th to 75th percentiles, with the middle line denoting the median and the whiskers denoting 2 × the interquartile range. Source data
Extended Data Fig. 1
Extended Data Fig. 1. Comparison between Droplet Hi-C and in situ Hi-C on cultured cells.
a, Scatter plot showing proportion of human and mouse DNA reads in each cell in the Droplet Hi-C species mixing experiment. b, UMAP visualization of Droplet Hi-C data on three human cell line (HeLa S3, GM12878 and K562) mixing sample. c, Genome-wide Spearman’s correlation coefficients of compartment score between pseudo-bulk Droplet Hi-C data and bulk in-situ Hi-C datasets. d, Comparison of contact frequency by distance between Droplet Hi-C and in situ Hi-C datasets of HeLa S3, GM12878, K562 and mitotic cells. e, Comparison of contact maps between Droplet Hi-C and bulk in situ Hi-C for HeLa S3, GM12878, K562 and mitotic cells on chromosome 11 at 100-kb resolution. f, Scatter plot showing compartment scores between Droplet Hi-C and in situ Hi-C for HeLa S3, GM12878 and K562 cells. Spearman’s correlation coefficients (SSC) are also shown. g-h, Comparison of compartment score (g) and insulation score (h) profiles on the example region (chr11: 23-28 Mb) from Droplet Hi-C and in situ Hi-C datasets for HeLa S3, GM12878 and K562 cells. i, UMAP visualization of Droplet Hi-C data from the cell line mixing experiment with two normal-like human cell lines (GM12878 and WTC-11). j, Genome-wide Spearman’s correlation coefficients of compartment score between Droplet Hi-C data with reference bulk Hi-C data. k, Contact frequency by distance from pseudo-bulk Droplet Hi-C profiles in three identified clusters. l, Droplet Hi-C pseudo-bulk contact map on chromosome 3 for mitosis population. Source data
Extended Data Fig. 2
Extended Data Fig. 2. Performance metrics of Droplet Hi-C on adult mouse cortex.
a, Comparison of library complexity by read pairs between two datasets generated with 10x Genomics Chromium Single Cell ATAC kit v1.1 and v2. n = 3,329 (v1.1), 2,906 (v2). b, Distribution of cis-short, cis-long or tran contact number per nucleus (n = 2 biologically independent experiments). c, Comparison of cis-long contact ( > 1 kb) number among different cell types (n = 2 biologically independent experiments); n = 180 (ASC), 382 (OGC), 356 (OPC), 318 (MGL), 69 (VLMC), 989 (ITL23GL), 877 (ITL45GL), 283 (ITL5GL), 268 (ITL6GL), 383 (CTGL), 183 (NPGL), 245 (OBGL), 91 (CLAGL), 199 (PTGL), 340 (D12MSN), 209 (PVGA), 234 (VIPGA), 204 (SSTGA), 184 (STRGA), 241 (OBGA). d, Comparison of cis-long contact ( > 1 kb) per cell among different single-cell Hi-C methods. n = 3,329 (Droplet Hi-C), 620 (sci-Hi-C), 250 (Dip-C), 10,000 (sn-m3C-seq), 183 (HiRes), 10 (sc Hi-C), 36 (sn Hi-C). e, Pseudo-bulk and representative single-cell genome-wide contact maps from mouse cortex. Color bar showed the raw contact number. f-g, Comparison of contact frequency by distance (f) and contact ratio (g) in mouse cortex datasets generated by Droplet Hi-C, sn-m3C-seq and Dip-C. The cis-long interactions in (g) represent contacts separated by more than 1 kb. h, Comparison of cis-long contact ratio per cell among different single-cell Hi-C methods and bulk in situ Hi-C. Cell number in single cell Hi-C method groups are identical as (d). n = 11 (4DN in-situ Hi-C). i, Comparison of multi-scale genome organization on chromosome 1 between Droplet Hi-C and sn-m3C-seq. j, The compartmentalization strength among Droplet Hi-C, sn-m3C-seq and Dip-C. k, Enrichment of sequencing reads over mouse cortex candidate cis-regulatory elements (cCREs) among Droplet Hi-C, sn-m3C-seq, Dip-C and bulk ATAC-seq. l-o, The compartment scores (l-m) and insulation scores (n-o) among Droplet Hi-C, sn-m3C-seq and Dip-C are shown. All box plot (b, c, d, h) hinges were drawn from the 25th to 75th percentiles, with the middle line denoting the median and whiskers denoting 2× the interquartile range. Source data
Extended Data Fig. 3
Extended Data Fig. 3. Validation of cell type identities characterized by Droplet Hi-C in mouse cortex.
a, Schematic of the Droplet Hi-C annotation strategy using single-cell gene associating domain (scGAD) score for co-embedding. b, UMAP visualization of reference mouse cortex single-nucleus RNA-seq data used for co-embedding. c, Distribution of cell type prediction scores for Droplet Hi-C cells co-embedded with reference snRNA-seq data. d, Distribution of single-cell prediction scores among different annotated cell types. e, Volcano plot showing differential scGAD score of genes between neuronal subtypes PVGA and ITL6GL. Genes with adjusted P value < 0.01 and fold change > 2 are colored in red. P values were calculated by one-sided Wilcoxon rank-sum test. Benjamini–Hochberg FDRs were then calculated to select significant genes. f, Comparison of chromatin contacts between PVGA and ITL6GL at Erbb4 (chr1: 66.25-70.65 Mb) locus. Compartment scores from the corresponding cell types are shown below the contact maps. Color bar showed the imputed contact number. g, Volcano plot showing the differential scGAD of genes between inhibitory neuronal subtypes PVGA and VIPGA, with significant genes colored in red. h, Comparison of imputed contact maps between PVGA and VIPGA around Sox6os gene region (chr7: 114-118 Mb) at 25-kb resolution. Compartment scores from the corresponding cell types are also shown. Color bar showed the imputed contact number. i, Heatmap of aggregated scGAD score at cell type-specific markers among all cell types from Droplet Hi-C data, along with single-cell gene expression heatmap of the same marker genes from snRNA-seq. j, Box plots showing Spearman’s correlation coefficients of compartment score between matched (n = 16) and unmatched (n = 484) cell types in Droplet Hi-C and sn-m3C-seq. P value was calculated by one-sided Wilcoxon rank-sum test. k, Heatmap showing overlap score of cell type annotations between Droplet Hi-C and sn-m3C-seq. Overlap score is calculated as the overlap between the original annotations and the joint cluster. l, Scatter plot showing relationship between cell number and percentage coverage of 10-kb genomic bins defined as chromatin hubs in each cell type. m, Specificity of identified chromatin hubs among different cell types. All box plot (d, j) hinges were drawn from the 25th to 75th percentiles, with the middle line denoting the median and whiskers denoting 2× the interquartile range. Source data
Extended Data Fig. 4
Extended Data Fig. 4. Droplet Hi-C illuminates ecDNA and HSR differences in cancer cells.
a, Contact maps of the region containing ecMYC in COLO320DM and COLO320HSR. Inferred copy number from pseudo-bulk profiles as well as representative single cells are shown below. b, Single-cell hub index calculated with normal and shuffle contact profiles in COLO320DM and COLO320HSR. N = 1,352 (COLO320DM, normal), 1,359 (COLO320DM, shuffled), 1,366 (COLO320HSR, normal), 1,374 (COLO320HSR, shuffled). P values are calculated from one-sided Wilcoxon signed-rank test. Box plot (b) hinges were drawn from the 25th to 75th percentiles, with the middle line denoting the median and whiskers denoting 2× the interquartile range. Source data
Extended Data Fig. 5
Extended Data Fig. 5. Flowchart of ecDNA caller algorithms.
a, Workflow of multivariate logistic regression model-based ecDNA caller used to predict ecDNA identity for each genomic region and cells containing the candidate ecDNA. b, ecDNA prediction results from the logistic regression model-based ecDNA caller in COLO320DM and COLO320HSR. c, Schematic of deep learning-based ecDNA caller used to predict HSR/ecDNA identity of genomic regions, and cells containing the candidate HSR/ecDNA. d, Confusion matrix of prediction results versus original labels from deep learning-based ecDNA caller on COLO320DM and COLO320HSR validation datasets. Source data
Extended Data Fig. 6
Extended Data Fig. 6. Dynamics of ecDNA in GBM39 under erlotinib treatment.
a, Scatter plots showing inferred copy number on chromosomes containing ecDNA candidates (chromosome 7, 8, 12) among all the clusters in GBM39 and GBM39-ER. EcDNA candidate regions are highlighted in pink. b, Genome-wide contact maps for GBM39 and GBM39-ER cells. c, Scatter plots showing genome-wide ecDNA prediction results from deep learning-based ecDNA caller for GBM39 and GBM39-ER. d, Representative single-cell contact map and percentage of cells containing a rare ecDNA (ecChr18) found by deep learning-based ecDNA caller. e, Scatter plot showing HSR prediction results in GBM39-ER with the deep learning-based ecDNA caller. The 1-Mb genomic bin overlap with MYC gene on chr8 is predicted to be HSR. f, MYC HSR is validated by DNA FISH in GBM39-ER metaphase and interphase cells (n = 2 biologically independent experiments). Scale bar: 10 μm. g, Genome-wide contact maps at cluster and representative single-cell levels. h, Comparison of ecMYC interaction profiles for ecDNA positive cells within C0 from GBM39 and GBM39-ER. Source data
Extended Data Fig. 7
Extended Data Fig. 7. Intra-tumoral heterogeneity of chromatin architecture in a primary GBM sample.
a, UMAP visualization of GBM Droplet-HiC data. Pseudo color of each cell indicates the inferred copy number of the 1-Mb genomic bin (chr7: 55-56 Mb) harboring EGFR. b, Box plots showing distribution of single-cell inferred copy number of 1-Mb genomic bin harboring EGFR in malignant or nonmalignant populations. n = 581 (Nonmalignant), 1,704 (Malignant). P values are calculated from one-sided Wilcoxon signed-rank test. c, An example of malignant population-specific SV on chromosome 1 from the GBM sample. SV is highlighted with black rectangle. d, Comparison of A/B compartment profiles on chromosome 3 between malignant cells and nonmalignant populations. e, Heatmap showing Spearman’s correlation coefficients (SCC) of 10x Genomics Multiome gene expression profiles and Droplet Hi-C compartment scores among different cellular states. f, Compartment profiles of CSMD1 gene region (chr8: 2.5-5.5 Mb) in different GBM cellular states. g, Normalized expression of CSMD1 in different GBM cellular states. h, Heatmap showing switched compartments between MES-like and OPC-like populations. i, Venn diagram of overlap between switched compartments and compartments with differentially expressed (DE) genes between MES-like and OPC-like populations. j, Enrichment of differentially expressed genes in switched compartments from (i). P value is calculated by Fisher exact test. k, Gene Ontology (GO) analysis of differentially expressed genes overlapped with switched compartments in MES-like and OPC-like populations using Enrichr. Combined score is determined as the product of the Fisher exact test P value and the Z-score of the deviation from the expected rank. l, Comparison of balanced contact maps and insulation profiles in an example region (chr10: 113-123 Mb) between malignant and nonmalignant populations. Example region with differential insulation score is highlighted in pink. All box plot (b, g) hinges were drawn from the 25th to 75th percentiles, with the middle line denoting the median and whiskers denoting 2× the interquartile range. Source data
Extended Data Fig. 8
Extended Data Fig. 8. Droplet Hi-C reveals chromatin architecture changes in a BMMC patient before and after treatment.
a, Illustration of the treatment procedure and sample collection. b, Pseudo-bulk genome-wide contact maps for BMMC samples from patient before and after treatment. c, Proportions of cells containing known tumor-associated mutations in BMMC samples before and after treatment. Aggregated genome-wide contact maps from mutant-carrying cells are also shown. d-e, Contact map showing a chromatin loop between MYC and its enhancer region (BENC) on ecMYC before treatment. Normalized aggregate peak analysis (APA) scores of before- and after-treated samples are shown aside.
Extended Data Fig. 9
Extended Data Fig. 9. Joint analysis of chromatin architecture and transcriptome using Paired Hi-C.
a, Scatter plot showing proportion of human and mouse Hi-C read pairs in each cell from Paired Hi-C species mixing experiment. b, Scatter plot showing proportion of human and mouse RNA UMI in each cell from Paired Hi-C species mixing experiment. c, Distribution of UMI, gene number, and contacts per nucleus in Paired Hi-C data from adult mouse cortex (n = 3 biologically independent experiments). n = 12,360. d, UMAP visualization of single-nucleus transcriptome profiles from Paired Hi-C experiment co-embedded with the reference BICCN and SCENIC+ datasets. e, The overlap scores of shared annotations between BICCN single-nucleus RNA-seq dataset and Paired Hi-C single-nucleus RNA-seq dataset. f, Dot plot showing expression level of marker genes in each cell type. g, Box plots showing Spearman’s correlation coefficients of compartment score between matched and unmatched cell types in sn-m3C-seq and Paired Hi-C. n = 241 (Unmatched), 15 (Matched). P value is calculated from one-sided Wilcoxon signed-rank test. h, Overlap of predicted annotations when using Droplet Paired-Tag snRNA-seq dataset as reference versus using Paired Hi-C snRNA-seq dataset as reference to co-embed Droplet Hi-C data. i, Violin plots showing UMI per cell distribution in Paired Hi-C RNA modality, compared to 10x Genomics Multiome or DOGMA-seq under different conditions. LLL (low-loss lysis) cell lysis condition; DIG (digitonin) lysis condition. n = 7,585 (Paired Hi-C), 9,480 (10x Genomics Multiome), 8,591 (LLL), 11,868 (DIG). j, Violin plots showing gene number per cell distribution in Paired Hi-C RNA modality versus other methods. k, UMAP visualization of human PBMC Paired Hi-C data clustered and annotated based on the transcriptome profiles. l, Dot plot showing scaled expression of marker genes across 19 predicted human PBMCs cell types in Paired Hi-C dataset. m, Balanced pseudo-bulk contact map of all PBMC cells on chromosome 3 at 100-kb resolution. n, Pseudo-bulk contact maps of aggregated T cells versus monocytes at the same region as in (m). Cell types used to aggregate are shown. All box plot (c, g, i, j) hinges were drawn from the 25th to 75th percentiles, with the middle line denoting the median and whiskers denoting 2× the interquartile range. Source data
Extended Data Fig. 10
Extended Data Fig. 10. Paired Hi-C reveals alterations in gene expression associated with variations in chromatin structure.
a, Comparison of expression levels for ecMYC trans-contacting genes between GBM39 and GBM39-ER cells (n = 2 biologically independent experiments). Only genes showed expression (RPKM > 0.1) in at least one groups were retained for analysis. n = 1,169 (GBM39-ER specific), 256 (GBM39 specific). P values are calculated from two-sided Wilcoxon signed-rank test. b, Violin plots showing the inferred copy number of 500-kb genomic bins at ecMYC interaction hotspots between GBM39 and GBM39-ER cells. n = 387 (GBM39-ER specific), 32 (GBM39 specific). P values were calculated from two-sided Wilcoxon signed-rank test. c, Summary of changes in A/B compartments in GBM39 and GBM39-ER sample. d, Expression of genes classified by the underlying A/B compartment transitions in GBM39 and GBM39-ER cells. n = 22,193 (A to A), 1,409 (A to B), 4,132 (B to A), 8,720 (B to B). P values were calculated from two-sided Wilcoxon signed-rank test. All box plot (a, b, d) hinges were drawn from the 25th to 75th percentiles, with the middle line denoting the median and whiskers denoting 2× the interquartile range. Source data

References

    1. Du, Z. et al. Allelic reprogramming of 3D chromatin architecture during early mammalian development. Nature547, 232–235 (2017). - PubMed
    1. Ke, Y. et al. 3D chromatin structures of mature gametes and structural reprogramming during mammalian embryogenesis. Cell170, 367–381. e320 (2017). - PubMed
    1. Xu, J. et al. Subtype-specific 3D genome alteration in acute myeloid leukaemia. Nature611, 387–398 (2022). - PMC - PubMed
    1. Xu, Z. et al. Structural variants drive context-dependent oncogene activation in cancer. Nature612, 564–572 (2022). - PMC - PubMed
    1. Dixon, J. R. et al. Chromatin architecture reorganization during stem cell differentiation. Nature518, 331–336 (2015). - PMC - PubMed