. 2024 Oct 19;15(1):9026.
doi: 10.1038/s41467-024-52706-7.

TDP43 aggregation at ER-exit sites impairs ER-to-Golgi transport

Affiliations

TDP43 aggregation at ER-exit sites impairs ER-to-Golgi transport

Hongyi Wu et al. Nat Commun. .

Abstract

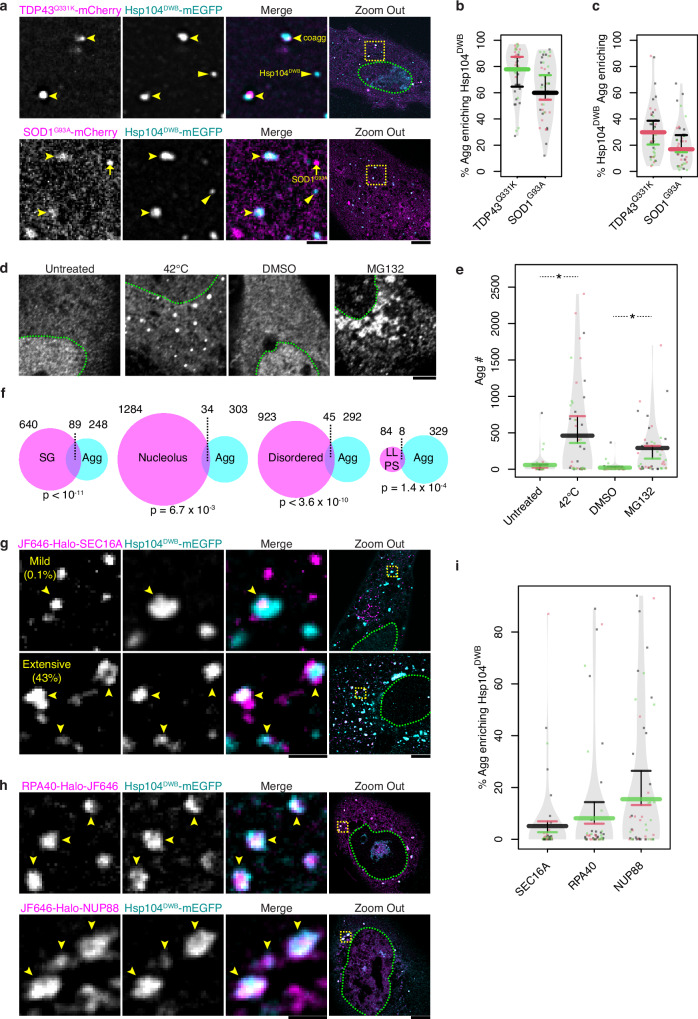
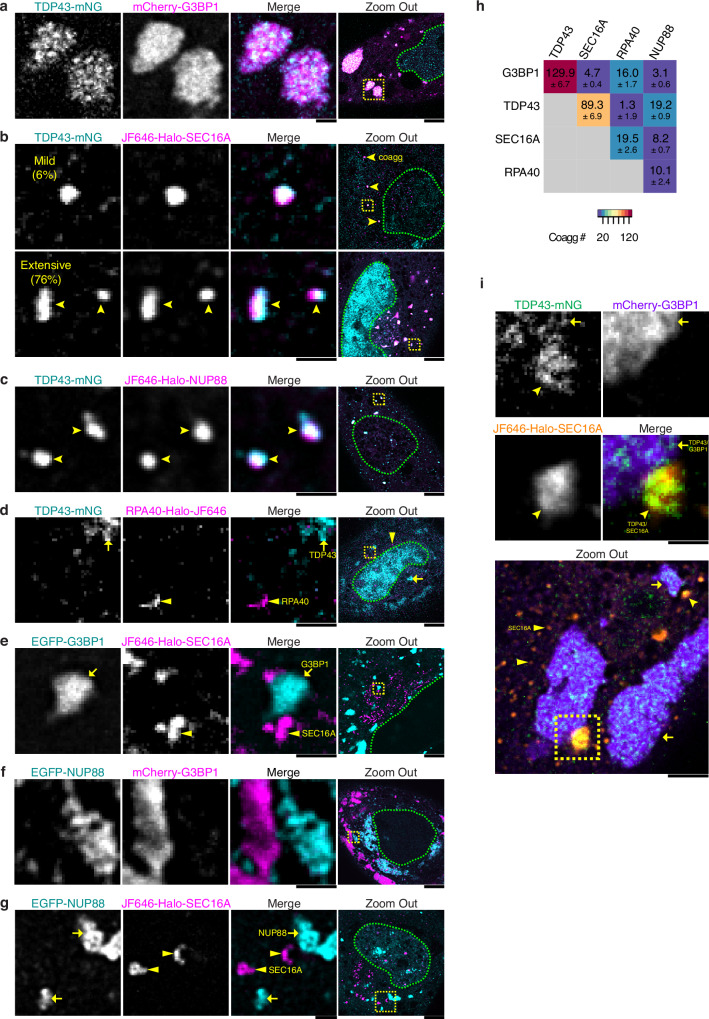
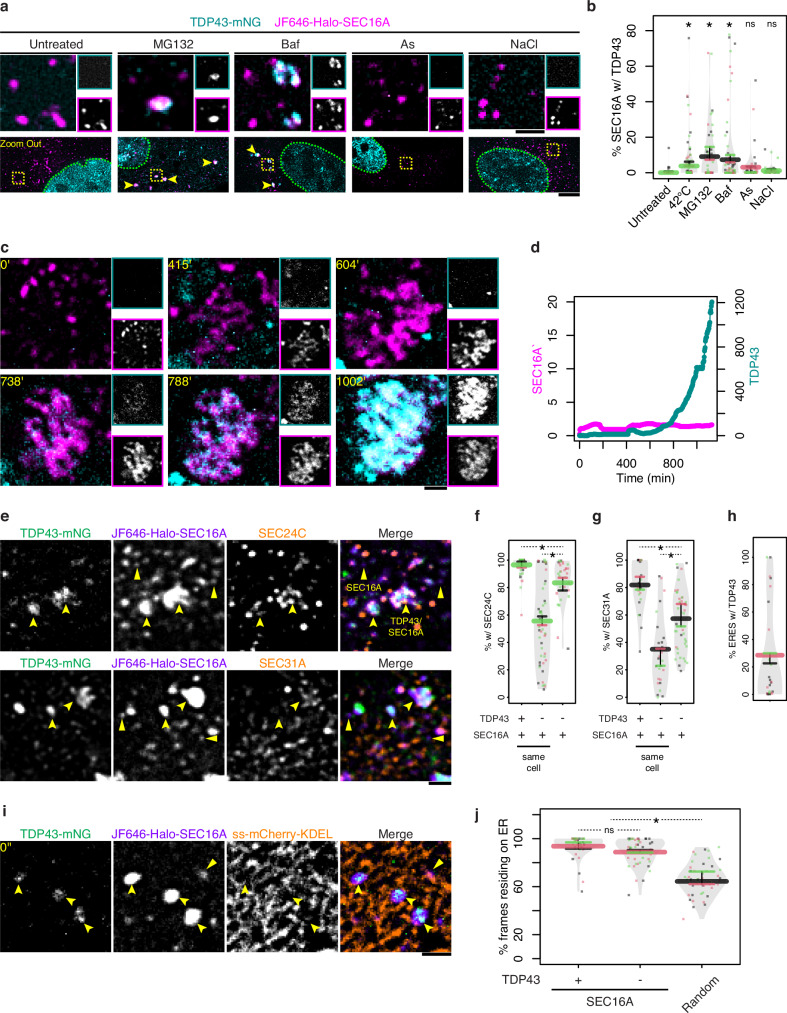
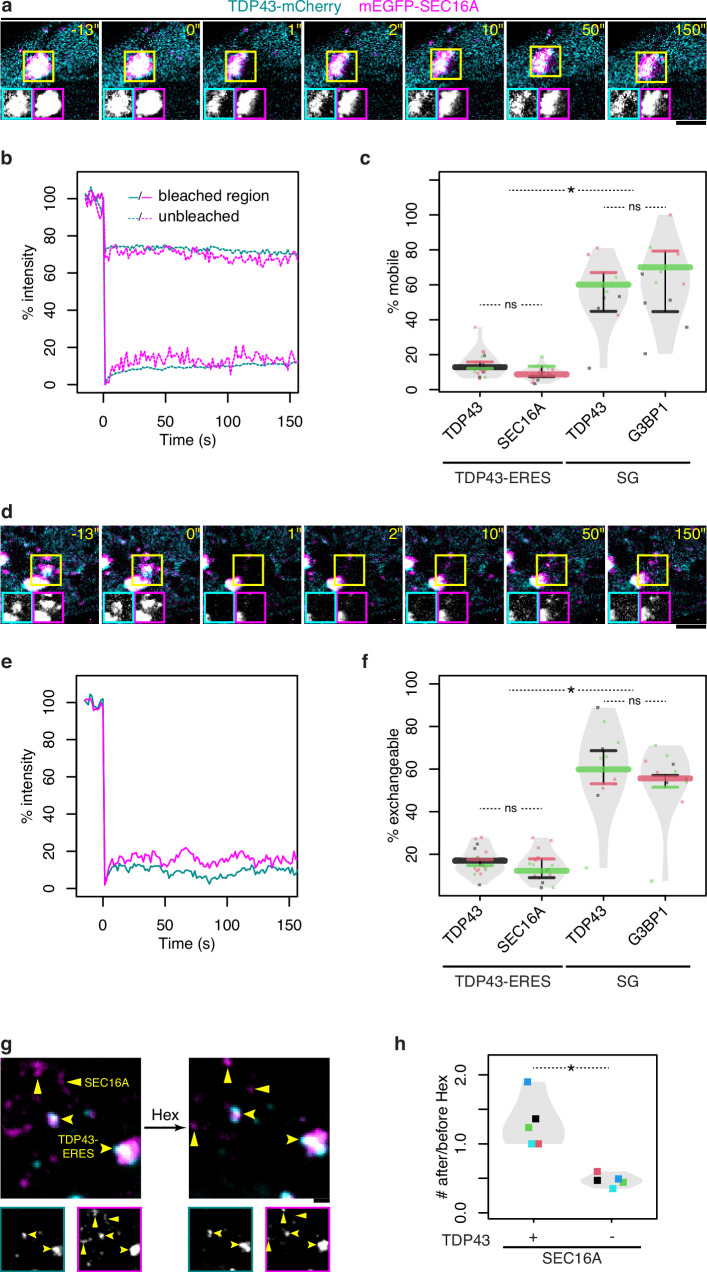
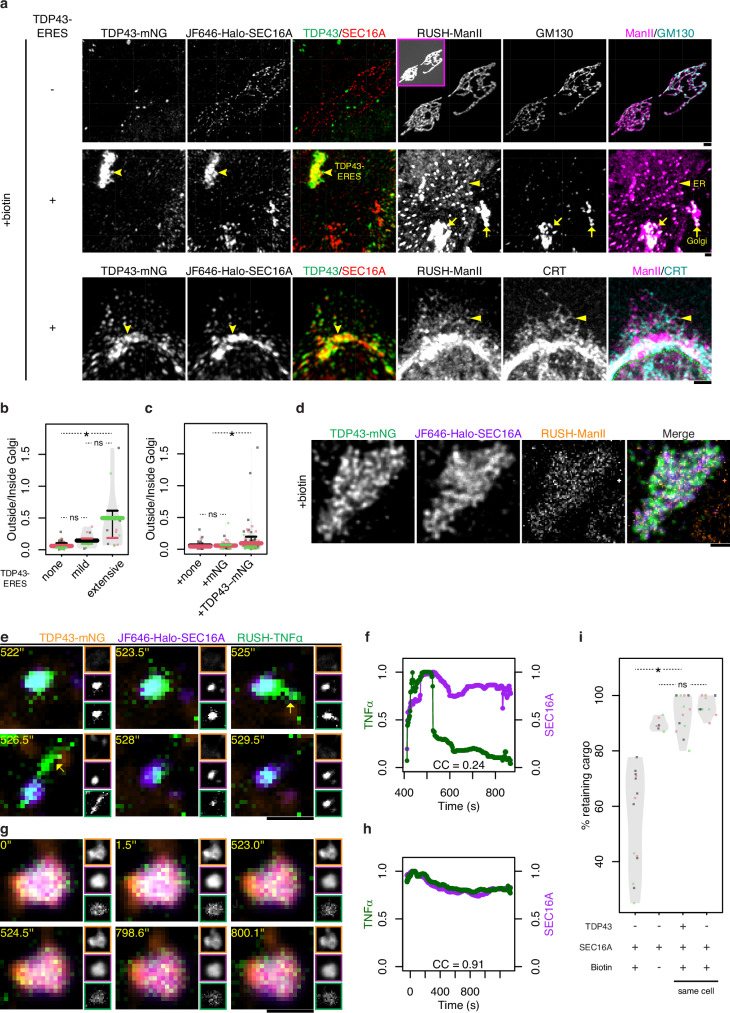
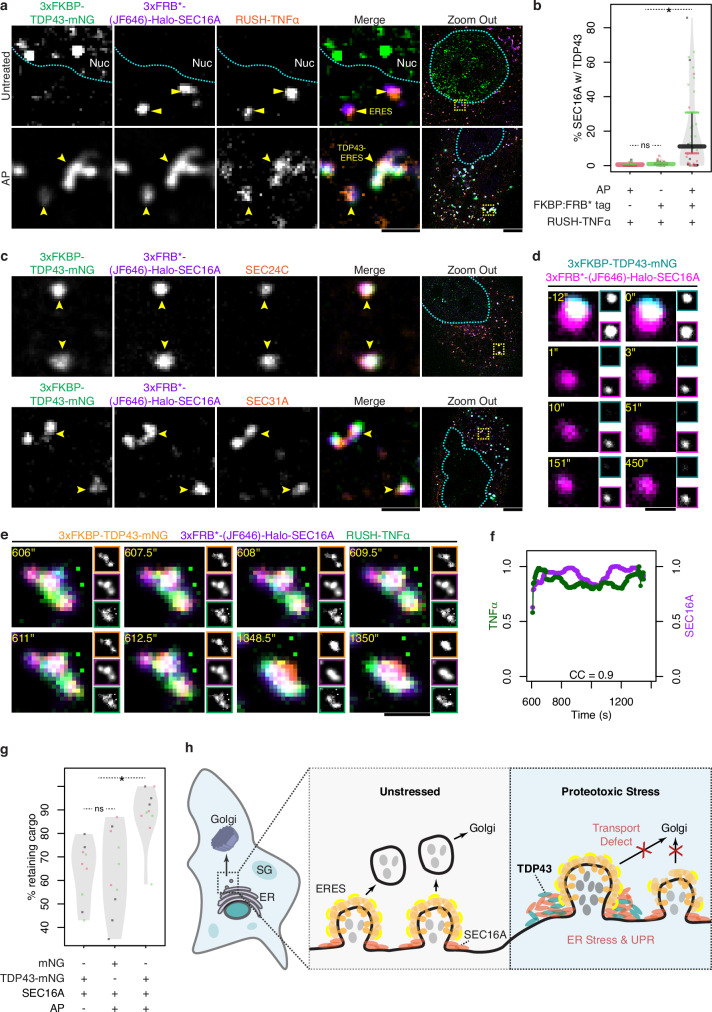
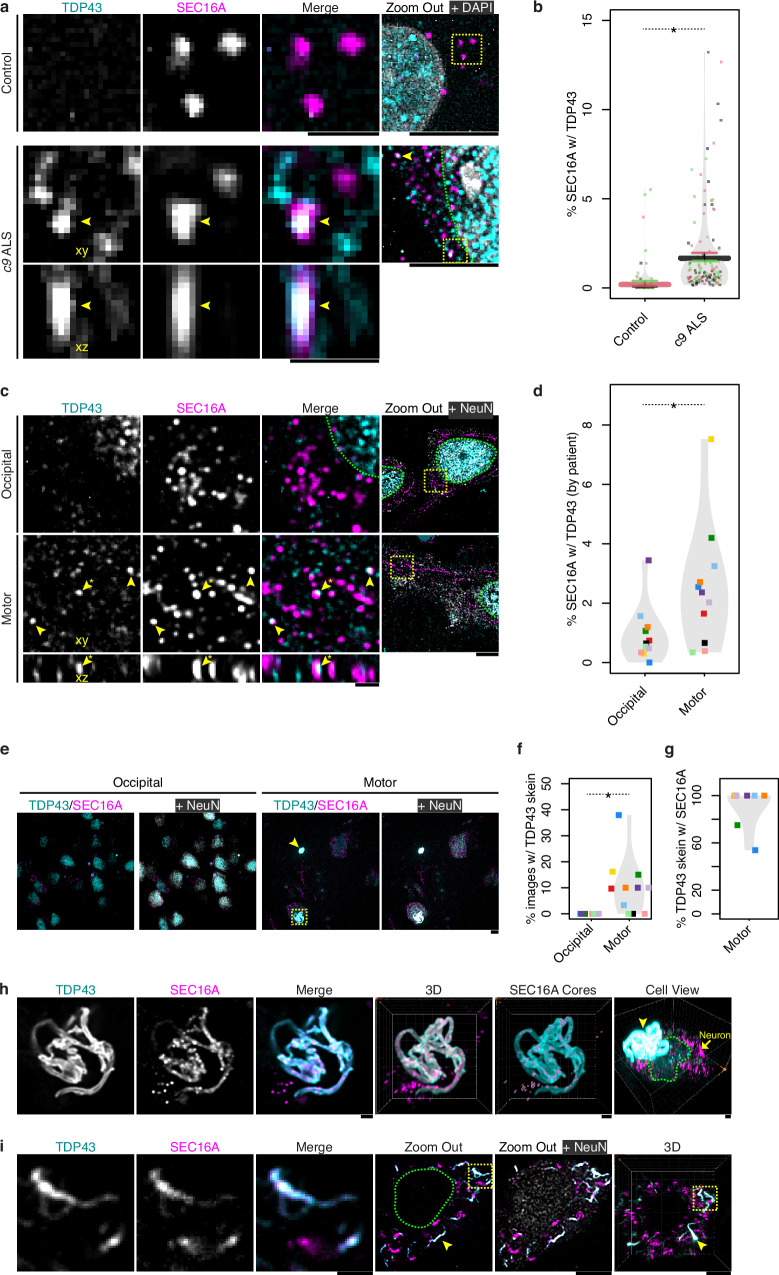
Protein aggregation plays key roles in age-related degenerative diseases, but how different proteins coalesce to form inclusions that vary in composition, morphology, molecular dynamics and confer physiological consequences is poorly understood. Here we employ a general reporter based on mutant Hsp104 to identify proteins forming aggregates in human cells under common proteotoxic stress. We identify over 300 proteins that form different inclusions containing subsets of aggregating proteins. In particular, TDP43, implicated in Amyotrophic Lateral Sclerosis (ALS), partitions dynamically between two distinct types of aggregates: stress granule and a previously unknown non-dynamic (solid-like) inclusion at the ER exit sites (ERES). TDP43-ERES co-aggregation is induced by diverse proteotoxic stresses and observed in the motor neurons of ALS patients. Such aggregation causes retention of secretory cargos at ERES and therefore delays ER-to-Golgi transport, providing a link between TDP43 aggregation and compromised cellular function in ALS patients.


Conflict of interest statement

The authors declare no competing interests.

Figures

Fig. 1
Fig. 1. Hsp104DWB enables visualization of aggregates and identification of aggregate proteins in human cells.
a Representative images showing the colocalization between Hsp104DWB and aggregates formed by TDP43Q331K or SOD1G93A after RPE-1 cells were incubated at 42 °C for 12–16 hr. Representative slices of confocal z-stacks are displayed. Arrowheads indicate Hsp104DWB-labeled TDP43Q331K or SOD1G93A aggregates (i.e. co-aggregate or coagg); arrows indicate SOD1G93A aggregates without Hsp104DWB; triangles indicate Hsp104DWB aggregates without TDP43Q331K or SOD1G93A. The region displayed in individual channels and Merge views is indicated by the yellow box in “Zoom Out”, and green dashes demarcate the nucleus. Scale bars except in “Zoom Out” represent 1 μm, and represent 5 μm in “Zoom Out”. b Quantification of the experiments as in (a) showing the percentage (% by number) of TDP43Q331K or SOD1G93A aggregates (Aggs) marked by Hsp104DWB. n = 45 cells examined over 3 independent experiments. The values of individual cells are plotted as dots, and the mean values of cells in the same experiment as horizontal segments, the median of which is elongated and thickened. Different colors denote different experiments. c Quantification of the experiments as in (a) showing the percentage of Hsp104DWB aggregates that enriched for TDP43Q331K or SOD1G93A. n = 45 cells examined over 3 independent experiments. The values of individual cells are plotted as dots, and the mean values of cells in the same experiment as horizontal segments, the median of which is elongated and thickened. Different colors denote different experiments. d Representative images showing stress-induced aggregates of endogenous proteins labeled by Hsp104DWB-mEGFP in cells without or with heat stress (42 °C), or treated with DMSO or 10 μM MG132 for 12–16 hr. The scale bar represents 1 μm. e Quantification of the experiments as in (d) comparing the numbers (#) of aggregates in each cell under different conditions. n = 45 cells examined over 3 independent experiments. The values of individual cells are plotted as dots, and the mean values of cells in the same experiment as horizontal segments, the median of which is elongated and thickened. Different colors denote different experiments. Asterisks (*) indicate p-value ≤ 0.05 in two-sided t-tests between experimental means. f Venn diagrams showing the overlaps between proteins identified in Hsp104DWB-bound aggregates and the protein components of stress granule (SG) and nucleolus and proteins that contain significant disordered regions or undergo in vitro liquid-liquid phase separation (LLPS). P-values of hypergeometric tests are displayed. g Representative images of aggregates containing SEC16A and their colocalization with Hsp104DWB. Examples for SEC16A inclusions enriching Hsp104DWB mildly (<10%) and more extensively (≥ 10%) are shown. Arrowheads indicate SEC16A aggregates recognized by Hsp104DWB. Scale bars except in “Zoom Out” represent 1 μm, and represent 5 μm in “Zoom Out”. Experiments hereafter were performed in RPE-1 cells stressed at 42 °C for 12–16 hr unless indicated otherwise. h Representative images of the aggregates formed by RPA40 and NUP88 and their colocalization with Hsp104DWB. Scale bars except in “Zoom Out” represent 1 μm, and represent 5 μm in “Zoom Out”. i Quantification of the experiments as in (g and h) showing the percentage of SEC16A, RPA40 and NUP88 aggregates labeled by Hsp104DWB in each cell. n = 45 cells examined over 3 independent experiments. The values of individual cells are plotted as dots, and the mean values of cells in the same experiment as horizontal segments, the median of which is elongated and thickened. Different colors denote different experiments.
Fig. 2
Fig. 2. Selective co-aggregation among aggregate-forming proteins.
a Representative images showing that, when co-transfected into RPE-1 cells, TDP43 co-aggregated with G3BP1 in stress granule (SG). In “Zoom out”, the yellow box indicates the region shown in zoom-in views, and green dashes demarcate the nucleus. Scale bars except in “Zoom Out” represent 1 μm, and represent 5 μm in “Zoom Out”. b Representative images for SEC16A inclusions enriching TDP43 mildly (<10%) and more extensively (≥ 10%) are shown. Arrowheads: co-aggregates (coaggs). Scale bars except in “Zoom Out” represent 1 μm, and represent 5 μm in “Zoom Out”. c Representative images showing TDP43 co-aggregation with NUP88 in the cytoplasm. Scale bars except in “Zoom Out” represent 1 μm, and represent 5 μm in “Zoom Out”. d Representative images showing that TDP43 rarely co-aggregated with RPA40. Arrows: TDP43 aggregates; triangles: RPA40 aggregates. Scale bars except in “Zoom Out” represent 1 μm, and represent 5 μm in “Zoom Out”. e Representative images showing that G3BP1 rarely co-aggregated with SEC16A. Arrows: G3BP1 aggregates; triangles: SEC16A aggregates. Scale bars except in “Zoom Out” represent 1 μm, and represent 5 μm in “Zoom Out”. f Representative images showing that G3BP1 rarely co-aggregated with NUP88. Scale bars except in “Zoom Out” represent 1 μm, and represent 5 μm in “Zoom Out”. g Representative images showing that NUP88 rarely co-aggregated with SEC16A. Arrows: NUP88 aggregates; triangles: SEC16A aggregates. Scale bars except in “Zoom Out” represent 1 μm, and represent 5 μm in “Zoom Out”. h Co-aggregation matrix of TDP43, G3BP1 and newly identified aggregation-prone proteins SEC16A, RPA40 and NUP88. The number in each colored square is the mean number of coaggs per cell ± standard deviation (s.d.) derived from analysis of the experiments as in (ag) and Supplementary Fig. 3a. n = 45 cells examined over 3 independent experiments. i TDP43/SEC16A, TDP43/G3BP1 coaggs (i.e. TDP43-containing SGs) and SEC16A inclusions without TDP43 in the same cell, which are marked by arrowheads, arrows and triangles, respectively. Representative images from 3 independent experiments are shown. Scale bars except in “Zoom Out” represent 1 μm, and represent 5 μm in “Zoom Out”.
Fig. 3
Fig. 3. Proteotoxic stress induces TDP43 aggregation with preformed ERES.
a Representative images showing TDP43/SEC16A coaggs in cells treated with 10 μM MG132 or 100 nM Bafilomycin A1 (Baf) for 12-16 hr. In comparison, untreated cells, cells treated with 0.5 mM sodium arsenite (As) for 1 hr, or cells treated with 200 mM NaCl for 4 hr were shown. Cyan box: TDP43-mNG channel; magenta box: JF646-Halo-SEC16A channel. In “Zoom Out”, arrowheads indicate coaggs, yellow boxes indicate regions shown in zoom-in views, and green dashes demarcate the nuclei. Scale bars except in “Zoom Out” represent 1 μm, and represent 5 μm in “Zoom Out”. b Quantification of the experiments as in (a) and Fig. 2b showing the volume percentage (% [v/v]) of SEC16A inclusions that enrich TDP43 under the indicated conditions. n = 45 cells examined over 3 independent experiments. The values of individual cells are plotted as dots, and the mean values of cells in the same experiment as horizontal segments, the median of which is elongated and thickened. Different colors denote different experiments. Asterisks and “ns” respectively stand for significant (unadjusted p-value ≤ 0.05) and non-significant (unadjusted p-value > 0.05) in two-sided t-tests between the experimental means of untreated and each other condition. c Selected frames from a timelapse recording of ERES in a cell shifted to 42 °C. Imaging started at 60 min after the temperature shift. Cyan: TDP43-mNG; Magenta: JF646-Halo-SEC16A. The scale bar represents 1 μm. A representative timelapse of 3 independent experiments is shown. d Quantification of the experiment in (c) showing the relative intensities of SEC16A and TDP43 over time in ERES (normalized to their respective initial values). e Representative images of SEC24C or SEC31A immunostaining in cells with TDP43/SEC16A coaggs. Arrowheads: coaggs; triangles: SEC16A inclusions without TDP43. The scale bar represents 1 μm. f, g Quantification of the experiments as in (e) showing the percentage of TDP43/SEC16A coaggs that contained SEC24C (f) or SEC31A (g), compared with that of SEC16A inclusions without TDP43 in the same cells or in cells without TDP43/SEC16A coaggs. n = 60 cells examined over 3 independent experiments. The values of individual cells are plotted as dots, and the mean values of cells in the same experiment as horizontal segments, the median of which is elongated and thickened. Different colors denote different experiments. Asterisks stand for significant (p-value ≤ 0.05) in two-sided t-tests. h Quantification of the experiments as in (e) showing that the volume percentage of mature ERES (defined as SEC16A/SEC31A inclusions) that contained TDP43 in cells with TDP43-ERES. n = 60 cells examined over 3 independent experiments. The values of individual cells are plotted as dots, and the mean values of cells in the same experiment as horizontal segments, the median of which is elongated and thickened. Different colors denote different experiments. i Representative images of the ER-localization of TDP43/SEC16A coaggs (indicated by arrowheads) and SEC16A inclusions without TDP43 (indicated by triangles). The scale bar represents 1 μm. The timelapse recording can be found in Supplementary Movie 3. j Quantification of the experiments as in (i) and Supplementary Movie 3 showing the percentage of frames in which all TDP43/SEC16A coaggs or all SEC16A inclusions without TDP43 were associated with the ER. As a control, the percentage of ER-residing frames of simulated, randomly distributed particles of the same number and sizes as TDP43/SEC16A coaggs is shown. n = 45 cells examined over 3 independent experiments. The values of individual cells are plotted as dots, and the mean values of cells in the same experiment as horizontal segments, the median of which is elongated and thickened. Different colors denote different experiments. The asterisk and “ns” respectively stand for significant (p-value ≤ 0.05) and non-significant (p-value > 0.05) in two-sided t-tests.
Fig. 4
Fig. 4. TDP43-ERES are non-dynamic (solid-like) aggregates.
a Selected frames from a representative timelapse recording of a TDP43-ERES coagg after partial photobleaching. Insets show individual channels of the yellow boxed region. Each scale bar represents 1 μm. b Quantification of the experiment in (A) showing the relative intensities of TDP43 (cyan lines) and SEC16A (magenta lines) in bleached (solid lines) and unbleached regions (dashed lines) over time. c Quantification of partial-FRAP experiments as in (a) and Supplementary Fig. 7a comparing the mobile fractions of proteins in TDP43-ERES versus SGs. n = 15 aggregates examined over 3 independent experiments. The values of individual aggregates are plotted as dots, and the mean values of aggregates in the same experiment as horizontal segments, the median of which is elongated and thickened. Different colors denote different experiments. Asterisks and “ns” respectively stand for significant (p-value ≤ 0.05) and non-significant (p-value > 0.05) in two-sided t-tests. d Selected frames from a representative timelapse recording of a TDP43-ERES after photobleaching in its entirety. The yellow box marks the position of the coagg immediately before photobleaching. The scale bar represents 1 μm. e Quantification of the experiment in (d) showing the relative intensities of TDP43 (cyan line) and SEC16A (magenta line) over time. f Quantification of full-FRAP experiments as in (d) and Supplementary Fig. 7c comparing the exchangeable fraction of proteins in TDP43-ERES versus SGs. n = 15 aggregates examined over 3 independent experiments. The values of individual aggregates are plotted as dots, and the mean values of aggregates in the same experiment as horizontal segments, the median of which is elongated and thickened. Different colors denote different experiments. Asterisks and “ns” respectively stand for significant (p-value ≤ 0.05) and non-significant (p-value > 0.05) in two-sided t-tests. g Representative images showing TDP43-ERES (indicated by arrowheads) and SEC16A inclusions without TDP43 (indicated by triangles) in a cell before and after 3.5% [v/v] 1,6-hexanediol (Hex) treatment for 15 min. Insets show individual TDP43-mCherry (cyan) and mEGFP-SEC16A (magenta) channels. The scale bar represents 1 μm. h Quantification of the experiments as in (g) comparing the after/before ratios of TDP43-ERES and SEC16A inclusions without TDP43. n = 50 cells examined over 5 independent experiments. The median values of cells in the same experiments are plotted as dots. The asterisk stands for significant (p-value ≤ 0.05) in two-sided t-test.
Fig. 5
Fig. 5. TDP43-ERES aggregation impairs ER-to-Golgi transport.
a Representative images of RUSH assays in cells without or with TDP43 co-aggregation with ERES. After biotin addition for 1 hr, the subcellular localization of ManII-SBP-mCherry (RUSH-ManII) was imaged with GM130 (Golgi marker) or calreticulin (CRT – ER marker) visualized by using immunofluorescence staining. The inset shows a contrast-adjusted view; arrowheads indicate TDP43-ERES; arrows point to fragmented Golgi; triangles point to RUSH-ManII retention in the ER; green dashes demarcate the nucleus. The 3D projections (view from top) of these cells are displayed. Each scale bar represents 1 μm. b Quantification of the experiments as in (a) and Supplementary Fig. 8c showing the ratios between RUSH-ManII intensity outside and inside Golgi. Cells were categorized based on their volume percentage of TDP43-ERES (none: 0%; mild: 0-10%; severe: ≥ 10%). n = 45 cells examined over 3 independent experiments. The values of individual cells are plotted as dots, and the mean values of cells in the same experiment as horizontal segments, the median of which is elongated and thickened. Different colors denote different experiments. The asterisk and “ns” respectively stand for significant (p-value ≤ 0.05) and non-significant (p-value > 0.05) in two-sided t-tests. c Quantification of cells transfected with RUSH-ManII and Halo-SEC16A only or additionally with mNG or TDP43-mNG showing the outside/inside Golgi ratios of RUSH-ManII intensity. n = 45 cells examined over 3 independent experiments. The values of individual cells are plotted as dots, and the mean values of cells in the same experiment as horizontal segments, the median of which is elongated and thickened. Different colors denote different experiments. The asterisk and “ns” respectively stand for significant (p-value ≤ 0.05) and non-significant (p-value > 0.05) in two-sided t-tests. d Representative images of TDP43-ERES trapping RUSH-ManII after biotin addition for 1 hr. A representative slice of the z-stack is displayed. The scale bar represents 1 μm. e Selected frames of a representative timelapse recording of an ordinary ERES (in a cell without TDP43-ERES) during RUSH-TNFα transport from ER to Golgi. Biotin was added at 0”. Arrows indicate the budding of a tubular transport intermediate. The scale bar represents 1 μm. f Quantification of relative RUSH-TNFα intensity over time (normalized to the max intensity), compared to the relative intensity of SEC16A in the ERES tracked in (e). CC: cross-correlation between RUSH-TNFα intensity and SEC16A intensity. g Selected frames of a representative timelapse recording of a TDP43-ERES during RUSH-TNFα assay. The scale bar represents 1 μm. h Quantification of RUSH-TNFα and SEC16A intensities over time (normalized to their respective max intensities) in the TDP43-ERES tracked in (g). i Quantification of the percentage of TDP43-ERES and ERES without TDP43 in either the same or different cells that retained RUSH-TNFα in the experiments as in (eh) and Supplementary Fig. 9d, e. The criterion for cargo retention is CC ≥ 0.5. n = 9 cells examined over 3 independent experiments. Cells without biotin supplement were included as a control. n = 6 cells examined over 3 independent experiments. Each dot represents one cell, and different colors denote different experiments. The asterisk and “ns” respectively stand for significant (p-value ≤ 0.05) and non-significant (p-value > 0.05) in two-sided t-tests.
Fig. 6
Fig. 6. Artificially induced TDP43-ERES retain secretory cargo.
a Representative images of cells cultured in biotin-free media expressing 3xFKBP-TDP43-mNG, 3xFRB*-Halo-SEC16A and RUSH-TNFα without or with AP21967 (AP) treatment for 6-10 hr. Arrowheads and triangles indicate TDP43-ERES and ordinary ERES, respectively. In “Zoom out”, yellow boxes mark the regions displayed in zoom-in views, and cyan dashes demarcate the nuclei. Scale bars except in “Zoom Out” represent 1 μm, and represent 5 μm in “Zoom Out”. b Quantification of the experiments as in (a) and Supplementary Fig. 9 g showing the volume percentage of SEC16A inclusions that enriched TDP43 under the indicated conditions. n = 45 cells examined over 3 independent experiments. The values of individual cells are plotted as dots, and the mean values of cells in the same experiment as horizontal segments, the median of which is elongated and thickened. Different colors denote different experiments. The asterisk and “ns” respectively stand for significant (p-value ≤ 0.05) and non-significant (p-value > 0.05) in two-sided t-tests. c SEC24C or SEC31A immunostaining in cells with AP-induced TDP43/SEC16A coaggs. Scale bars except in “Zoom Out” represent 1 μm, and represent 5 μm in “Zoom Out”. Representative images of 3 independent experiments are shown. d Selected frames from a timelapse recording of an AP-induced TDP43-ERES after photobleaching. Insets show individual channels. 3xFKBP-TDP43-mNG was entirely photobleached whereas 3xFRB*-(JF646)-Halo-SEC16A was partially bleached. The scale bar represents 0.5 μm. A representative timelapse of 3 independent experiments are shown. e Selected frames of a representative timelapse recording of an AP-induced TDP43-ERES during RUSH-TNFα assay. The scale bar represents 1 μm. f Quantification of RUSH-TNFα and SEC16A intensities over time (normalized to their respective max intensities) in the TDP43-ERES tracked in (e). g Quantification of the percentage of AP-induced TDP43(-mNG)-ERES, mNG-ERES and ERES without TDP43 (in cells without AP treatment) that retained RUSH-TNFα in the experiments as in (e) and Supplementary Fig. 9h–k. n = 9 cells examined over 3 independent experiments. Each dot represents one cell, and different colors denote different experiments. The asterisk and “ns” respectively stand for significant (p-value ≤ 0.05) and non-significant (p-value > 0.05) in two-sided t-tests. h Working model of TDP43 aggregation at ERES causing retention of transport cargos. TDP43-ERES also exert a dominant effect over ordinary ERES in the same cells possibly through sequestration of essential transport factors. The ER-to-Golgi transport defect caused by TDP43-ERES co-aggregation may further induce ER stress.
Fig. 7
Fig. 7. Co-aggregation of TDP43 with ERES in ALS-affected motor neurons.
a Representative images of immunofluorescence staining of TDP43 and SEC16A in MNs induced from a non-ALS (Control) hiPSC line (BJ) and an ALS patient hiPSC line (NDS00270) that carries the c9orf72 mutation (c9). In “Zoom out”, yellow boxes mark the regions displayed in zoom-in views, and green dashes demarcate the nuclei. The sectioning of the TDP43/SEC16A coagg along the xz plane is displayed beneath the xy view. Scale bars except in “Zoom Out” represent 1 μm, and represent 5 μm in “Zoom Out”. b Quantification of the experiments as in (a) showing the volume percentage of SEC16A inclusions that contained TDP43. n = 90 cells examined in 3 normal or 3 patient hESC/hiPSC lines. The values of individual cells are plotted as dots, and the mean values of cells derived from the same hESC/hiPSC as horizontal segments, the median of which is elongated and thickened. Different colors denote different hESC/hiPSC. The asterisk stands for significant (p-value ≤ 0.05) in two-sided t-test. c Representative images of the immunofluorescence staining of TDP43, SEC16A and the neuronal marker NeuN (RBFOX3) in the post-mortem sections of the occipital cortex and motor cortex from the same sALS patient. The arrowheads with asterisk indicate the same TDP43/SEC16A coagg in xy and xz views. Scale bars except in “Zoom Out” represent 1 μm, and represent 5 μm in “Zoom Out”. d Quantification of the experiments as in (c) showing the volume percentage of SEC16A inclusions containing TDP43 in the occipital cortex versus motor cortex of 11 different ALS patients. n = 330 z-stacks each taken from the occipital and motor cortex of 11 patients. The mean values of cells from the same patients are plotted as dots. Different colors denote different patients. The same color coding applies in (f), (g), Supplementary Fig. 10d–f. The asterisk stands for significant (p-value ≤ 0.05) in two-sided t-test. e Representative images of TDP43, SEC16A and NeuN immunostaining in the occipital cortex and motor cortex of the same sALS patient. 2 skein-like TDP43/SEC16A aggregates in the motor cortex are boxed and indicated by arrowhead, with their respective zoom-in views displayed in (h) and Supplementary Fig. 10g. The max intensity projection of confocal z-stacks is shown. The scale bar represents 5 μm. f Quantification of the percentage of confocal z-stack images containing skein-like TDP43 aggregates in the occipital versus motor cortex of 11 ALS patients (color-coded) in the experiments as in (e). n = 330 z-stacks each taken from the occipital and motor cortex of 11 patients. The values of individual patients are plotted as dots. The asterisk stands for significant (p-value ≤ 0.05) in two-sided t-test. g Quantification of the percentage of TDP43 skeins that contained SEC16A in the motor cortex of ALS patients in the experiments as in (e). n = 330 z-stacks taken from the motor cortex of 11 patients. The values of individual patients are plotted as dots. h Zoom-in views of the TDP43/SEC16A skein-like aggregate boxed in (e). “SEC16A Cores” shows the contours of high SEC16A fluorescence intensity; “Cell View” shows a neuron (indicated by the arrow) beneath the TDP43/SEC16A skein (indicated by the arrowhead), and the nucleus of this neuron is demarcated by green dashes. Each scale bar represents 1 μm. i Representative images showing the intracellular TDP43/SEC16A skein-like aggregates found in 2 different postmortem sections of sALS Patient 132’s motor cortex. Green dashes demarcate the nucleus. Scale bars except in “Zoom Out” and “3D” represent 1 μm, and represent 5 μm in “Zoom Out” and “3D”.

References

    1. Zeskind, B. J. et al. Nucleic acid and protein mass mapping by live-cell deep-ultraviolet microscopy. Nat. Methods4, 567–569 (2007). - PubMed
    1. Ellis, R. J. Macromolecular crowding: an important but neglected aspect of the intracellular environment. Curr. Opin. Struct. Biol.11, 114–119 (2001). - PubMed
    1. Uversky, V. N. Intrinsically disordered proteins in overcrowded milieu: membrane-less organelles, phase separation, and intrinsic disorder. Curr. Opin. Struct. Biol.44, 18–30 (2017). - PubMed
    1. Saad, S. & Jarosz, D. F. Protein self-assembly: A new frontier in cell signaling. Curr. Opin. cell Biol.69, 62–69 (2021). - PMC - PubMed
    1. Ellis, R. J. & Minton, A. P. Protein aggregation in crowded environments. Biol. Chem.387, 485–497 (2006). - PubMed

Publication types

MeSH terms