. 2024 Oct 18;15(10):757.
doi: 10.1038/s41419-024-07125-3.

Sirtuin 1 regulates the phenotype and functions of dendritic cells through Ido1 pathway in obesity

Affiliations

Sirtuin 1 regulates the phenotype and functions of dendritic cells through Ido1 pathway in obesity

Jean de Lima et al. Cell Death Dis. .

Abstract

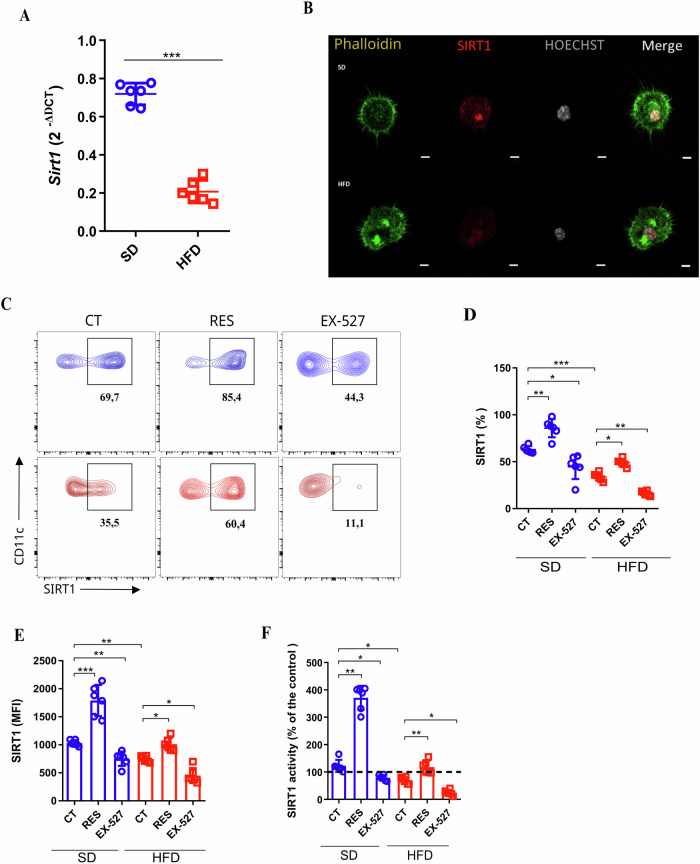
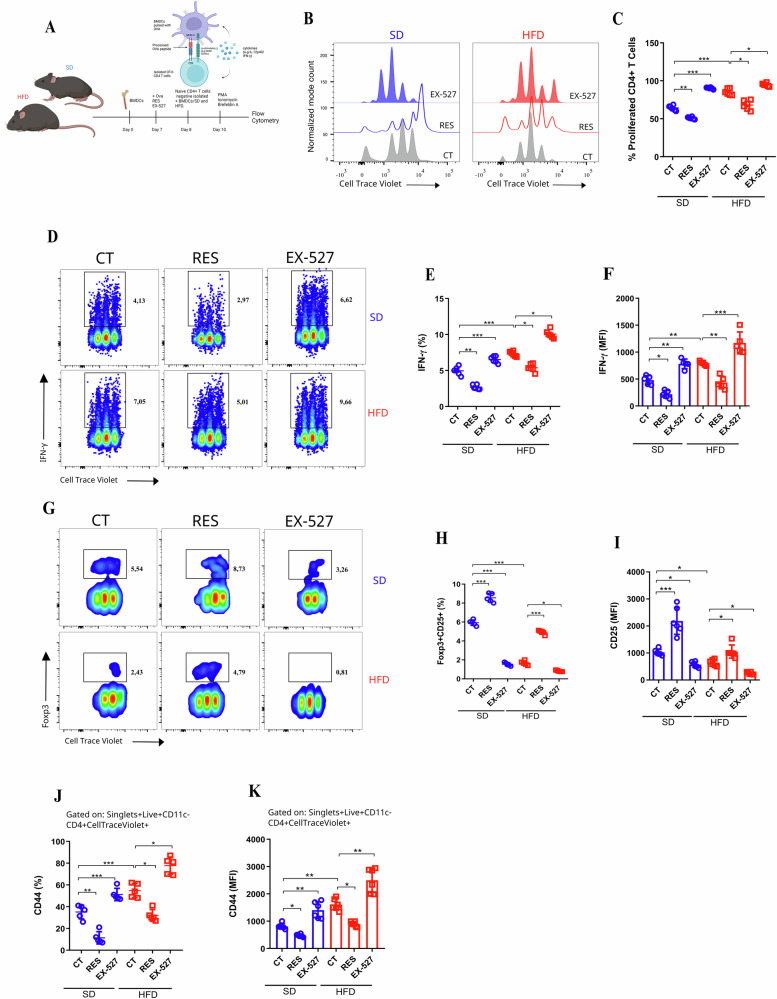
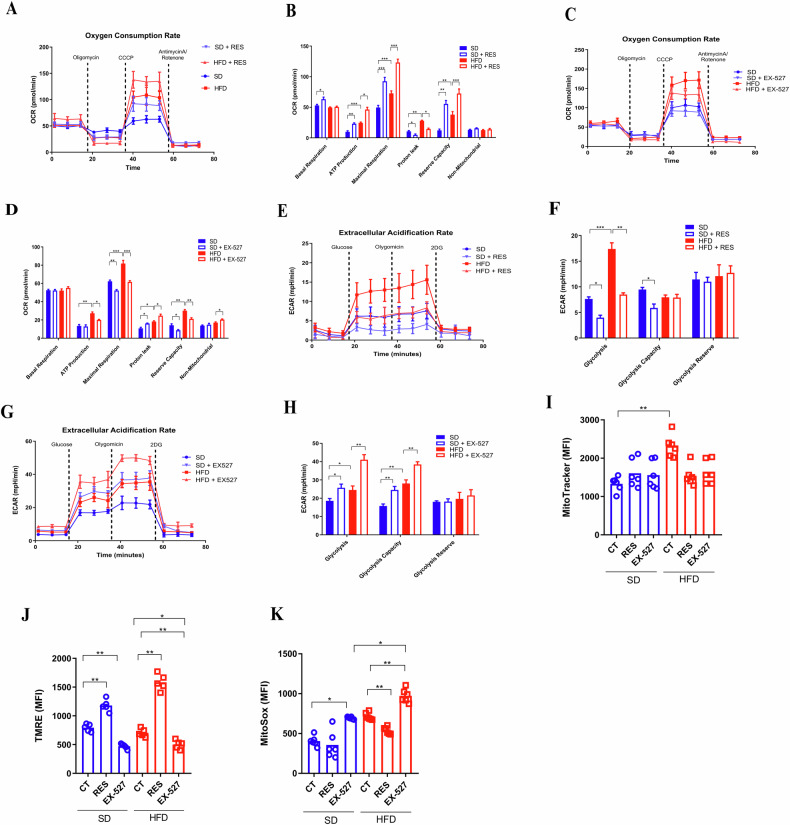
Sirtuin 1 (SIRT1) is a class III histone deacetylase (HDAC3) that plays a crucial role in regulating the activation and differentiation of dendritic cells (DCs) as well as controlling the polarization and activation of T cells. Obesity, a chronic inflammatory condition, is characterized by the activation of immune cells in various tissues. We hypothesized that SIRT1 might influence the phenotype and functions of DCs through the Ido1 pathway, ultimately leading to the polarization towards pro-inflammatory T cells in obesity. In our study, we observed that SIRT1 activity was reduced in bone marrow-derived DCs (BMDCs) from obese animals. These BMDCs exhibited elevated oxidative phosphorylation (OXPHOS) and increased extracellular acidification rates (ECAR), along with enhanced expression of class II MHC, CD86, and CD40, and elevated secretion of IL-12p40, while the production of TGF-β was reduced. The kynurenine pathway activity was decreased in BMDCs from obese animals, particularly under SIRT1 inhibition. SIRT1 positively regulated the expression of Ido1 in DCs in a PPARγ-dependent manner. To support these findings, ATAC-seq analysis revealed that BMDCs from obese mice had differentially regulated open chromatin regions compared to those from lean mice, with reduced chromatin accessibility at the Sirt1 genomic locus in BMDCs from obese WT mice. Gene Ontology (GO) enrichment analysis indicated that BMDCs from obese animals had disrupted metabolic pathways, including those related to GTPase activity and insulin response. Differential expression analysis showed reduced levels of Pparg and Sirt1 in BMDCs from obese mice, which was challenged and confirmed using BMDCs from mice with conditional knockout of Sirt1 in dendritic cells (SIRT1∆). This study highlights that SIRT1 controls the metabolism and functions of DCs through modulation of the kynurenine pathway, with significant implications for obesity-related inflammation.


Conflict of interest statement

The authors declare no competing interests.

Figures

Fig. 1
Fig. 1. SIRT-1 expression is compromised in dendritic cells exposed to a high-fat diet.
Bone marrow-derived dendritic cells (BM-DCs) were generated from mice under standard diet (SD) and high-fat diet (HFD). qPCR of Sirt1 from BMDCs from SD and HFD (A). Confocal microscopy of BMDCs/SD and BMDCs/HFD, showing SIRT1 (red) on BMDCs/SD and HFD (B). Flow cytometry representing the SIRT1 MFI (mean fluorescence intensity MFI) and percentage of SIRT1+ BMDCs (gated on Live & Dead-CD11c+IA/IE+CD115+) from SD and HFD animals, with or without RES (50 µM/24 h) and EX-527 (10 µM/24 h) (CE). SIRT1 activity fluorometric assay of total protein extract from BMDCs from SD and HFD mice, formerly treated with RES (50 µM/24 h) or EX-527 (10 µM/24 h) or untreated (F). Significance values (p) are indicated as follows: *p < 0.05; **p < 0.01; ***p < 0.001; ****p < 0.0001, One-way ANOVA or t-test when necessary, using GraphPad Prism®. The graphs and illustrations represent a representative experiment of three distinct experiments with 3–6 animals per group.
Fig. 2
Fig. 2. Pro-inflammatory activation of dendritic cells by a high-fat diet is inversely related to SIRT1 expression.
Bone-marrow-derived Dendritic cells (BM-DCs) were generated from mice on a standard diet (SD) and a high-fat diet (HFD). MHC-IIhigh (top gate) and MHC-IIlow (bottom gate) contour plot from flow cytometry of BMDCs from SD and BMDCs from HFD (with RES [50 µM], EX-527 [10 µM], or no treatment) (A). Quantification of percentage (B) and MFI (C) (mean fluorescent intensity) of MHC-IIhigh is represented. MFI (mean fluorescent intensity) of CD86 (D) and CD40 (E) from the same BMDCs under the mentioned conditions. Heat-map representing qPCR data (2-ΔΔCT) of the main cytokines produced by BMDCs/SD and BMDCs/HFD, untreated or treated with RES [50 µM] and EX-527 [20 µM] for 24 h (F). Heat-map of cytokine production was measured by ELISA for IL-1β, IL-6, IL-12p40, IL-10, and TGF-β in BMDCs from SD and HFD under the same conditions (G). The significance values (p) are indicated as follows: *p < 0.05; **p < 0.01; ***p < 0.001; ****p < 0.0001, determined by One-way ANOVA or t-test when necessary, using GraphPad Prism®. The graphs and illustrations represent a representative experiment of three distinct experiments, with 3–6 animals per group.
Fig. 3
Fig. 3. High-fat diet-induced pro-inflammatory DC favors Th1 generation by SIRT1 levels.
Experimental design representation for BMDCs (OVA pulsed)-CD4 T cells (OT-II) co-culture approach (A). Histogram from flow cytometry representing Cell-Trace Violet-labeled OT-II CD4 T cells proliferation, which were co-cultured (72 h) with OVA-pulsed BMDCs/SD and BMDCs/HFD under RES [50 µM], EX-527 [10 µM] treatment, or untreated (CT) (B). Percentage of OT-II CD4 T cells proliferation (Cell-Trace Violet) after co-culture (72 h) with BMDCs/SD and BMDCs/HFD under treatment or no treatment (RES, EX-527, or CT respectively) (C). Pseudo color plot (D), percentage (E), and MFI mean fluorescence intensity) (F) of IFN-γ production from CD4 T cells (OT-II) co-cultured with BMDCs/SD and BMDCs/HFD under RES, EX-527 treatment, or no treatment (CT). Pseudo color smooth plot (G), percentage (H) of Foxp3 and CD25, and MFI (MFI mean fluorescence intensity) (I) of regulatory CD4 T cells (OT-II) previously co-cultured with BMDCs/SD and BMDCs/HFD under RES, EX-527 treatment, or no treatment. Percentage of CD44 (J) and MFI (mean fluorescence intensity) of CD44 (K) from CD4 T cells (OT-II) co-cultured with BMDCs/SD and BMDCs/HFD treated (RES or EX-527) or untreated. *p < 0.05; **p < 0.01; ***p < 0.001; ****p < 0.0001, determined by One-way ANOVA or t-test when necessary, using GraphPad Prism®. The graphs and illustrations represent a representative experiment of three distinct experiments, with 3–6 animals per group.
Fig. 4
Fig. 4. SIRT1 is a key regulator of canonical metabolic pathways in BMDCs.
SIRT1 levels regulate metabolism of DCs. Oxygen consumption rate (OCR [pmol/min]) from Mitostress Assay of BMDCs/SD and BMDCs/HFD under RES [50 µM] OR no treatment (CT [DMSO]) (A, B). OCR of BMDCs/SD and BMDCs/HFD under EX-527 [10 µM] or CT (C, D). Extracellular Acidification rate (ECAR [mph/min]) of BMDCs/SD and BMDCs/HFD under RES [50 µM] or CT (E, F). ECAR of BMDCs/SD and BMDCs/HFD under EX-527 [10 µM] or CT (G and H). Mitotracker Green (MFI mean fluorescence intensity) (I), TMRE (MFI) (J) and MitoSox (MFI) (K) of BMDCs/SD and BMDCs/HFD under RES [50 µM], EX-527 [10 µM] or CT. The significance values (p) followed the order: *p < 0.05; **p < 0.01; ***p < 0.001; ****p < 0.0001, which were treated by the One-way ANOVA test or t-test when necessary, using GraphPad Prism®. The graphs illustrations are a representative experiment of three distinct experiments, which contained 3–6 animals per group.
Fig. 5
Fig. 5. Decreased IDO1 in BMDCs induced by a high-fat diet can be modulated by SIRT1.
qPCR of Ido1 from BMDCs/SD and BMDCs/HFD, under RES [50 μM], EX-527 [20 μM] treatment or no treatment (A). Liquid Chromatography coupled to Mass Spectrometry (LC–MS/MS) of kynurenine pathway intermediates molecules, Tryptophan (TRP), Kynurenine (KYN) and Quinolinic Acid (QA), from BMDCs/SD and BMDCs/HFD, under RES, EX-527 treatment or no treatment (B). LC–MS/MS Kynurenine pathway enzymes (Indoleamine dioxygenase 1(IDO1), Kynurenine 3-monooxygenase (KMO), Kynureninase (KYNU), 3-Hhydroxyanthranillic acid dioxygenase (3-HAAO), quinolinate phosporibosyltransferase (QPRT), Neuraminidase (NA), mononucleotide adenylyltransferase (NMNAT) and Nicotinamidase (NADS)) from BMDCs/SD and BMDCs/HFD, under RES, EX-527 treatment or no treatment (C). LC–MS/MS Kynurenine pathway metabolites (Tryptophan (TRP), Kynurenine (KYN), Quinolinic Acid (QA), 3-Hydroxykynurenine 3-HK), 3-hydroxyanthranillic acid (3-HANA), nicotinic acid mononucleotide (NaMN) and nicotinic acid mononucleotide (NaMN)) from BMDCs/SD and BMDCs/HFD, under RES, EX-527 treatment or no treatment (D). MFI of MHC-II, and CD40 from BMDCs/SD and BMDCs/HFD, under RES, EX-527 treatment or no treatment, extracted from WT and IDOKO (Ido Knockout) mice (EH). ELISA of IL-12p40 and TGF-β (pg/ml) in the supernatant from BMDCs/SD and BMDCs/HFD, under RES, EX-527 treatment or no treatment, extracted from WT and IDOKO mice (IL). qPCR analysis of Sirt1 in BMDCs from SD and HFD groups, including BMDCs from WT and IDO KO mice (M). The significance values (p) followed the order: *p < 0.05; **p < 0.01; ***p < 0.001; ****p < 0.0001, which were treated by the One-way ANOVA test or t-test when necessary, using GraphPad Prism®. The graphs illustrations are a representative experiment of three distinct experiments, which contained 3–5 animals per group.
Fig. 6
Fig. 6. IDO1 can support SIRT1 functionality in BMDCs through NAD+ synthesis.
Kynurenine pathway schema representing the hypothesis of the IDO1-SIRT1 axis (A). MFI (mean fluorescent intensity) of MHC-II and CD40 of BMDCs (with or without 2 mM of Acetylated-NAD) extracted from WT or IDOKO mice on 12 weeks of SD or HFD treatment (BE). ELISA of IL-12p40 in BMDCs supernatant (with or without 2 mM of Acetylated-NAD) extracted from WT or IDOKO mice on 12 weeks of SD or HFD treatment (F and G). The significance values (p) followed the order: *p < 0.05; **p < 0.01; ***p < 0.001; ****p < 0.0001, which were determined by the One-way ANOVA test or t-test when necessary, using GraphPad Prism®. The graphs and illustrations represent a representative experiment of three distinct experiments, with 3–6 animals per group.
Fig. 7
Fig. 7. Obesity inherently affects SIRT1 levels at the epigenetic level in dendritic cells.
Principal Component Analysis (PCA) from ATAC-seq of BMDCs/SD and HFD replicates (A). GO Enrichment analysis from increased and decreased accessibility at promoters of targets in different pathways (p < 0.01) (B, C). Global chromatin accessibility analysis from ATAC-seq of BMDCs/SD and HFD at promoters (D). Genomic SIRT1 locus with accessibility and differential accessibility peaks from ATAC-seq of BMDCs/SD and HFD (E). Volcano plot of differential accessibility in promoter regions from BMDCs/SD and HFD ATAC-seq data (F). Protein-Protein Interaction Networks Functional Enrichment Analysis (STRING) revealing high scores of confidence (>0.900) for PPARγ and interaction with SIRT1 in mice (G) and human (H). The significance values (p) or adjusted p-values followed the order: *p < 0.05; **p < 0.01; ***p < 0.001; ****p < 0.0001, which were determined by ANOVA test or t-test when necessary, using GraphPad Prism®. The graphs and illustrations represent a representative experiment from one to three distinct experiments, with 2–6 animals per group.
Fig. 8
Fig. 8. Conditional knockout of Sirt1 in dendritic cells disrupts global metabolism, possibly affecting NAD+ production via the kynurenine pathway.
Body weight (g) from SIRT1Δ and control mice (SIRT1 flox) on a standard diet (SD) and high-fat diet (HFD) (A). Blood glucose tolerance test (GTT) levels, including Area Under the Curve (AUC) data (B, C). Insulin resistance test with AUC (D, E). Mean Fluorescent Intensity (MFI) of MHC-II, CD40, and ELISA of IL-12p40 in BMDCs (with or without 2 mM of Acetylated-NAD) extracted from SIRT1Δ and SIRT1 flox mice after 12 weeks on SD or HFD (FH). Ido1 qPCR in BMDCs from SIRT1Δ and SIRT1 flox mice on SD and HFD (with or without 2 mM of Acetylated-NAD) (I). Intracellular flow cytometry staining of Peroxisome Proliferator-Activated Receptor Gamma (PPARγ) for percentage (J) and MFI (K) in BMDCs from SIRT1Δ and SIRT1 flox mice on SD and HFD. Significance values are indicated as follows: *p < 0.05; **p < 0.01; ***p < 0.001; ****p < 0.0001. Statistical analyses were performed using ANOVA or t-test where appropriate, with data analyzed using GraphPad Prism®. The graphs and illustrations represent data from one to three independent experiments, with 2–6 animals per group.

References

    1. Asfaha Y, Schrenk C, Alves Avelar LA, Hamacher A, Pflieger M, Kassack MU, et al. Recent advances in class IIa histone deacetylases research. Bioorg Med Chem. 2019;27:115087. - PubMed
    1. Eckschlager T, Plch J, Stiborova M, Hrabeta J. Histone deacetylase inhibitors as anticancer drugs. Int J Mol Sci. 2017;18:1414. - PMC - PubMed
    1. Haberland M, Montgomery RL, Olson EN. The many roles of histone deacetylases in development and physiology: implications for disease and therapy. Nat Rev Genet. 2009;10:32–42. - PMC - PubMed
    1. Jiang M, Zheng J, Peng Q, Hou Z, Zhang J, Mori S, et al. Sirtuin 1 activator SRT2104 protects Huntington’s disease mice. Ann Clin Transl Neurol. 2014;1:1047–52. - PMC - PubMed
    1. Leite JA, Ghirotto B, Targhetta VP, de Lima J, Câmara NOS. Sirtuins as pharmacological targets in neurodegenerative and neuropsychiatric disorders. Br J Pharmacol. 2022;179:1496–511. - PubMed