. 2024 Oct 18;15(1):9007.
doi: 10.1038/s41467-024-53241-1.

The socioeconomic and environmental niche of protected areas reveals global conservation gaps and opportunities

Affiliations

The socioeconomic and environmental niche of protected areas reveals global conservation gaps and opportunities

David Mouillot et al. Nat Commun. .

Abstract

The global network of protected areas has rapidly expanded in the past decade and is expected to cover at least 30% of land and sea by 2030 to halt biodiversity erosion. Yet, the distribution of protected areas is highly heterogeneous on Earth and the social-environmental preconditions enabling or hindering protected area establishment remain poorly understood. Here, using fourteen socioeconomic and environmental factors, we characterize the multidimensional niche of terrestrial and marine protected areas, which we use to accurately establish, at the global scale, whether a particular location has preconditions favourable for paestablishment. We reveal that protected areas, particularly the most restrictive ones, over-aggregate where human development and the number of non-governmental organizations are high. Based on the spatial distribution of vertebrates and the likelihood to convert non-protected areas into strictly protected areas, we identify 'potential' versus 'unrealistic' conservation gains on land and sea, which we define as areas of high vertebrate diversity that are, respectively, favourable and unfavourable to protected area establishment. Where protected areas are unrealistic, alternative strategies such as other effective area-based conservation measures or privately protected areas, could deliver conservation outcomes.


Conflict of interest statement

The authors declare no competing interests.

Figures

Fig. 1
Fig. 1. Global distribution of protected areas (PAs) and unprotected areas in a social-environmental space.
This 2-dimensional space was built with 14 local and national social-environmental factors (Tables 1 and 2) on land and sea using an ecological niche factor analysis (ENFA) (see ‘Methods’). Most restrictive PAs (IUCN category I only) are represented in darker colours, while PAs from all IUCN categories (IUCN categories I–VI) are represented in lighter colours. Thin lines in the central panels denote the extent of the niche for each cell category. The influence of social-environmental factors on the construction of the niche spaces is represented by bar plots in the lower panels (orange bars for socioeconomic factors and green bars for environmental factors). Marginal distributions of each grid cell category along the two first axes are represented with density plots. Source data and codes are provided at 10.5281/zenodo.11183846.
Fig. 2
Fig. 2. Examples of protected areas and vertebrate species included in our study.
The tropical Viñales Valley (Cuba) is an IUCN protected area Category II (a). The valley is encircled by rocky mountains with the presence of traditional agricultural production, particularly of tobacco (photo credit Simon Berger). Alpine ibex (Capra ibex) in the Ristolas—Mont-Viso (France) an IUCN protected area category IV (b) (photo credit Wilfried Thuiller). The Cap Corse and Agriate marine protected area (France) is an IUCN category V (c). The Corsica Island is relatively remote in the overcrowded Mediterranean Sea (photo credit David Mouillot). Yellowtail kingfish (Seriola lalandi) and Galapagos sharks (Carcharhinus galapagensis) in the Rapa Nui marine park (Chile), which is an IUCN Category IV protected area (d) (Photo Credit Manu San Felix).
Fig. 3
Fig. 3. Importance of socioeconomic and environmental factors predicting the relative likelihood of protected area occurrence on land and at sea.
Circular histograms show the relative importance (standardised to 0–1 based on permutations, see Methods) of each factor in explaining the relative likelihood of protected area occurrence (all IUCN categories vs. IUCN I only) on land (a, c) and sea (b, d) using random forest models. Socioeconomic factors are in orange, while environmental factors are in green. Their average relative importance is represented by a bar plot in the middle of each circular plot. See Supplementary Figs. 3 and 4 for error bars across the 10-fold spatial cross-validation procedure and Supplementary Data 1 for factor abbreviations and descriptions. Source data and codes are provided at 10.5281/zenodo.11183846.
Fig. 4
Fig. 4. Partial response plots between the relative likelihood of PA occurrence on land and sea and the nine most important socioeconomic and environmental factors.
We used modelled partial relationships between the relative likelihood of protected area presence on land (dark and light orange lines) and sea (dark and light blue lines) and the most important factors detected by the random forest models (ai), while controlling for the other factors, e.g., kept constant at their means. The plain lines are for all IUCN PA categories, while the dashed lines are for the most restrictive IUCN I PA category only. Other factors are presented in Supplementary Fig. 6. Source data and codes are provided at 10.5281/zenodo.11183846.
Fig. 5
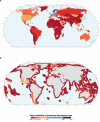
Fig. 5. Mean probability of protecting currently unprotected areas per country.
Random Forest models estimate the average relative likelihood per country that unprotected areas are turned into IUCN-I protected areas given the social-environmental context on both land (a) and sea (b). Source data and codes are provided at 10.5281/zenodo.11183846.
Fig. 6
Fig. 6. Potential and unrealistic conservation gains for terrestrial and marine vertebrates.
We define as low vs. high conservation gains (x-axis) the bottom vs. top-ranked (10%) unprotected areas for the conservation of vertebrates according to the maximisation of species range size coverage on land (a birds and mammals) and sea (b fish). We define as potential vs. unrealistic conservation gains (y-axis), the unprotected areas being the most likely (‘low-hanging fruits’) vs. unlikely (‘high-hanging fruits’) to be protected according to their social-environmental context. On global maps, established protected areas are in green, while we only represent the potential vs. unrealistic high conservation gains on land (c) and sea (d). The gradient of colours corresponds to the relative likelihood that these unprotected areas are turned into protected areas according to the 14 social-environmental factors (Tables 1 and 2) and Random Forest models (see ‘Methods’). So, potential high conservation gains are in dark blue, while unrealistic high gains are in dark red. See Fig. 5 for the average relative likelihood of PA establishment per country on land and sea. These patterns could be biased by missing PAs in the Word Database on Protected Areas. Source data and codes are provided at 10.5281/zenodo.11183846.

References

    1. Zeng, Y., Koh, L. P. & Wilcove, D. S. Gains in biodiversity conservation and ecosystem services from the expansion of the planet’s protected areas. Sci. Adv.8, eabl9885 (2022). - PMC - PubMed
    1. Sala, E. et al. Protecting the global ocean for biodiversity, food and climate. Nature592, 397–402 (2021). - PubMed
    1. Naidoo, R. et al. Evaluating the impacts of protected areas on human well-being across the developing world. Sci. Adv.5, eaav3006 (2019). - PMC - PubMed
    1. Ban, N. C. et al. Well-being outcomes of marine protected areas. Nat. Sustain.2, 524–532 (2019).
    1. Gill, D. A. et al. Capacity shortfalls hinder the performance of marine protected areas globally. Nature543, 665–667 (2017). - PubMed

Publication types

LinkOut - more resources