. 2024 Oct 18;12(1):62.
doi: 10.1038/s41413-024-00362-4.

Mapping RANKL- and OPG-expressing cells in bone tissue: the bone surface cells as activators of osteoclastogenesis and promoters of the denosumab rebound effect

Affiliations

Mapping RANKL- and OPG-expressing cells in bone tissue: the bone surface cells as activators of osteoclastogenesis and promoters of the denosumab rebound effect

Bilal M El-Masri et al. Bone Res. .

Abstract

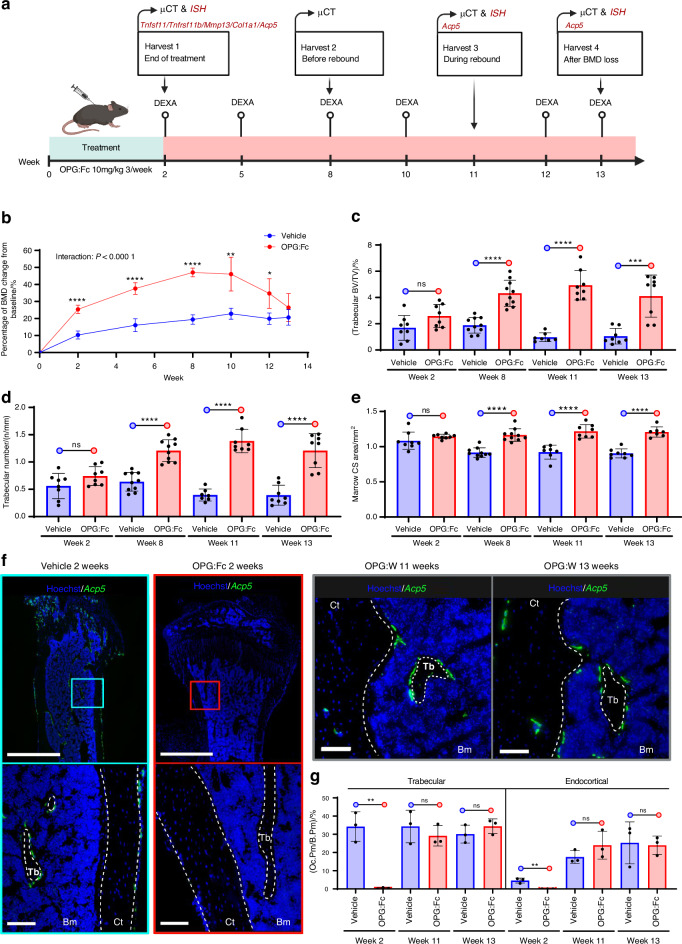
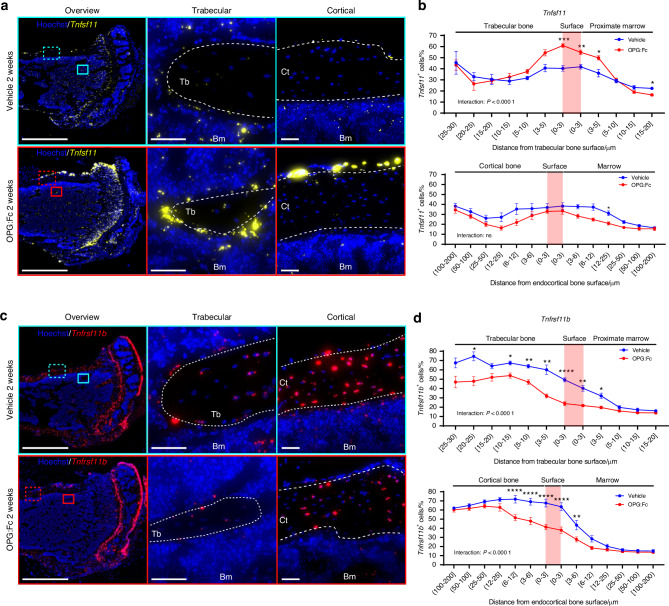
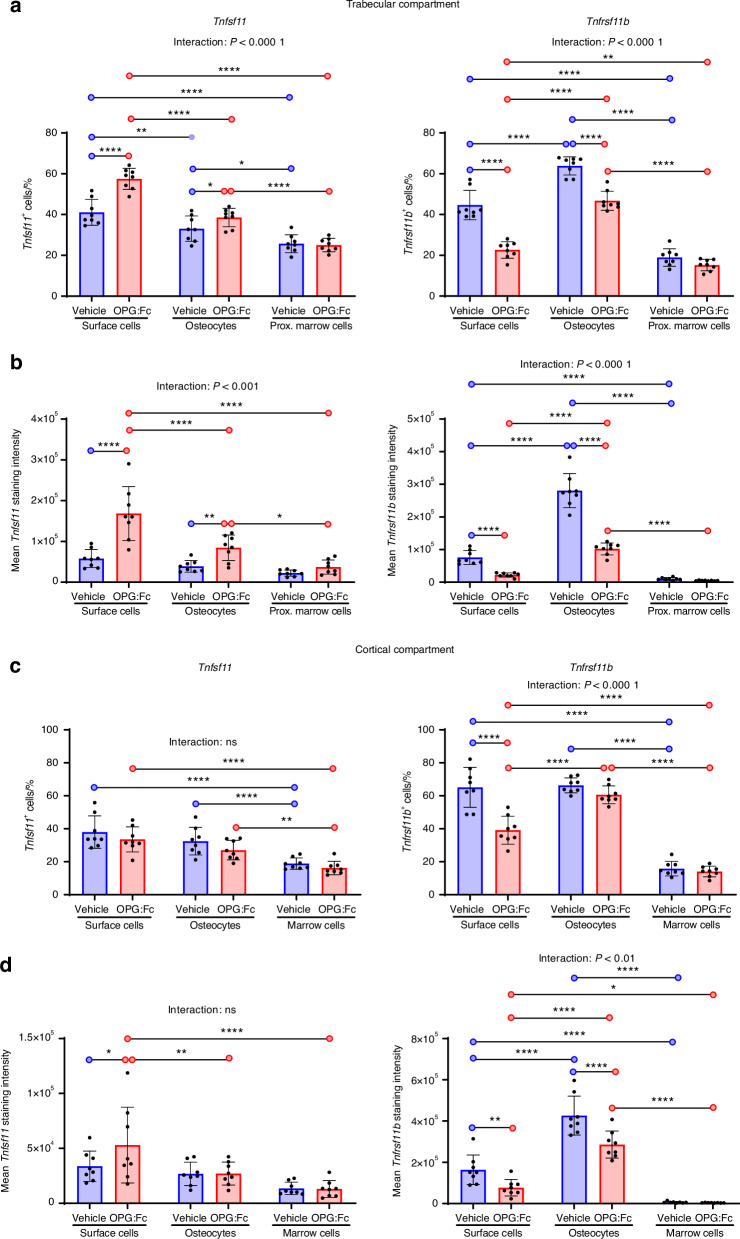
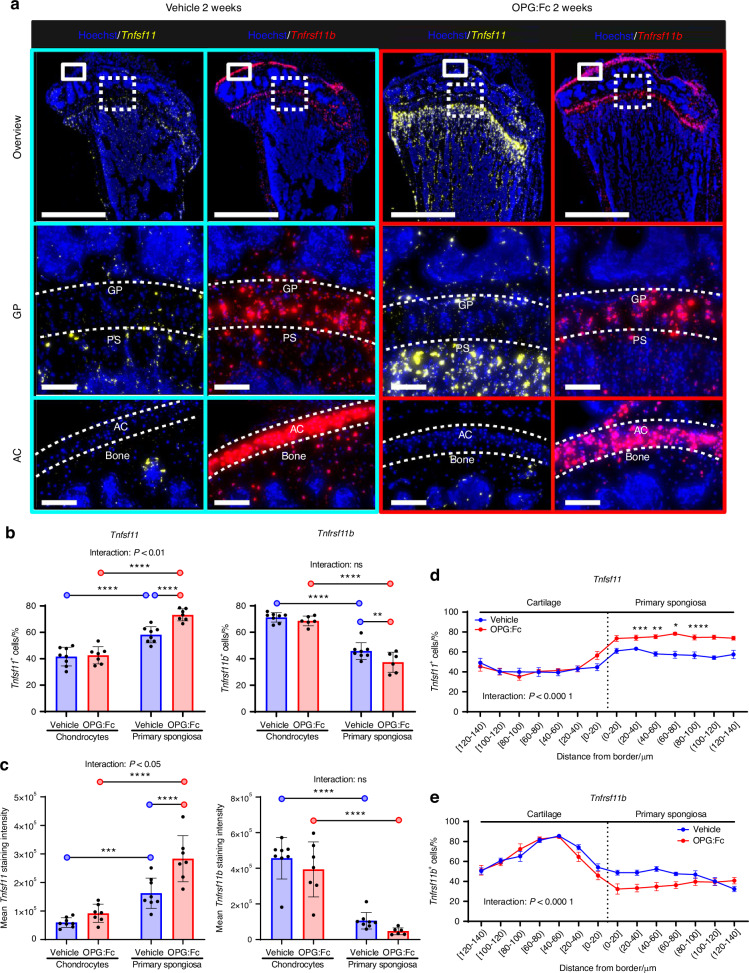
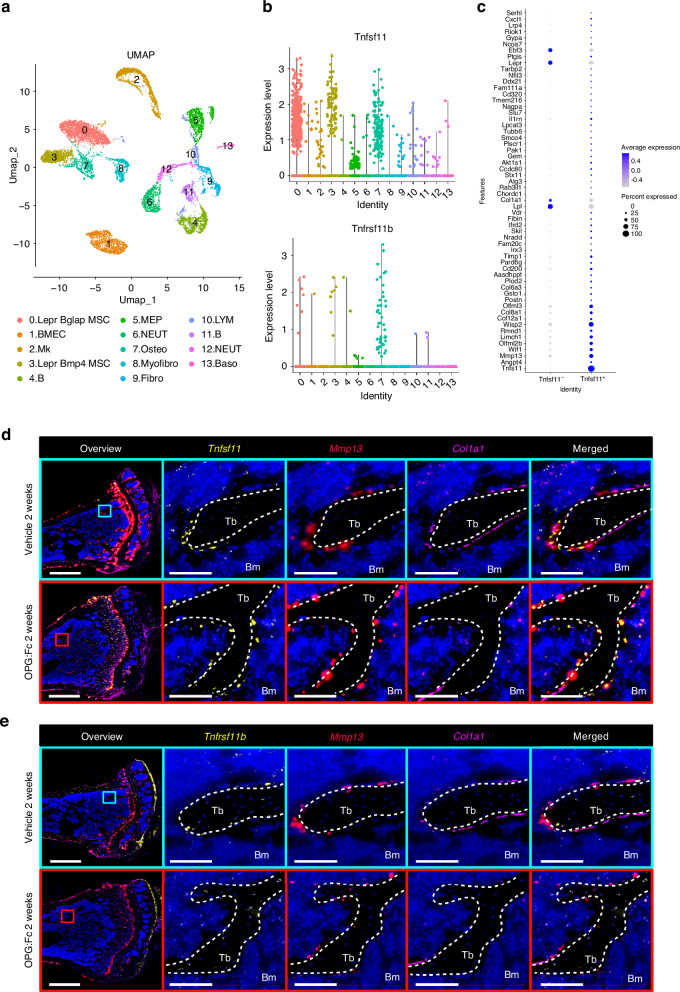
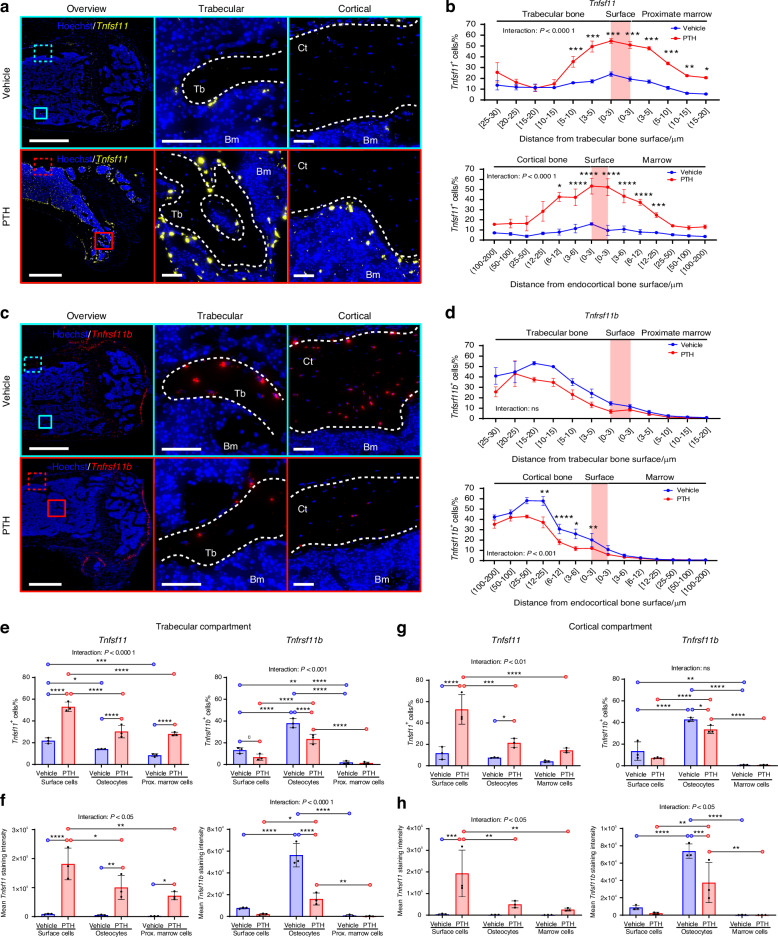
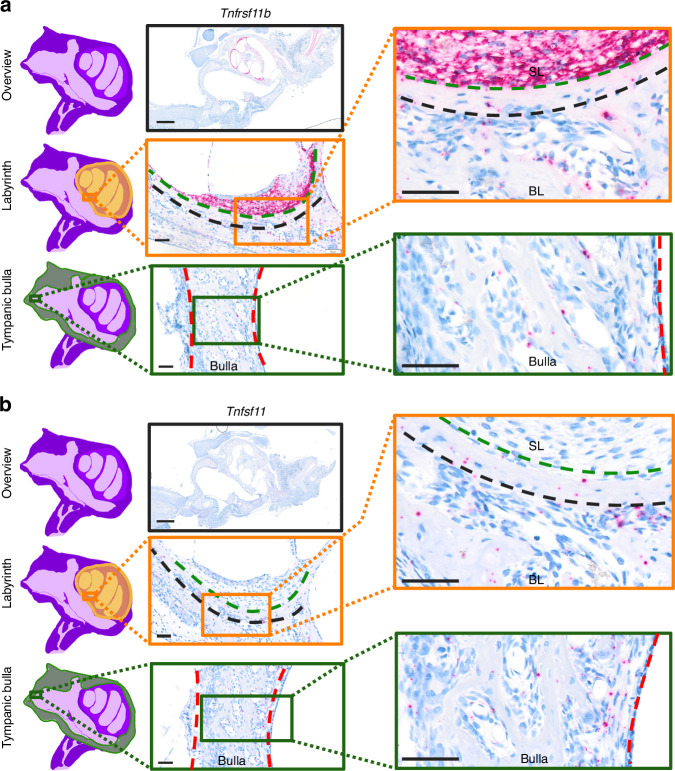
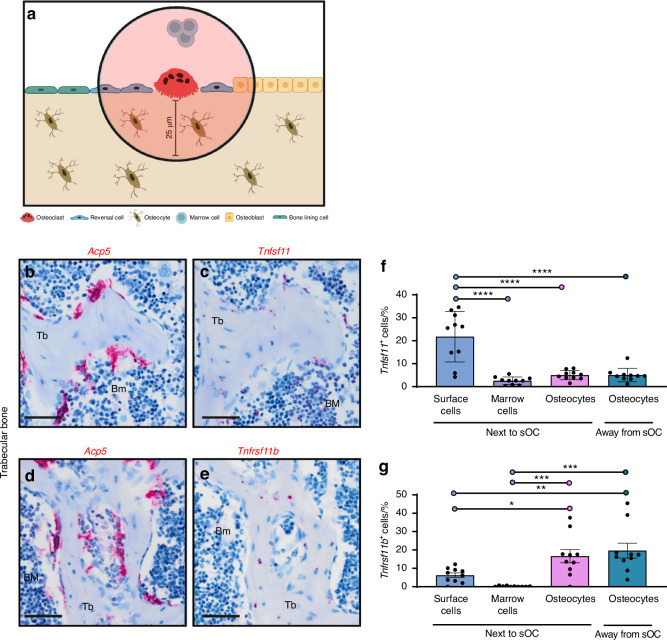
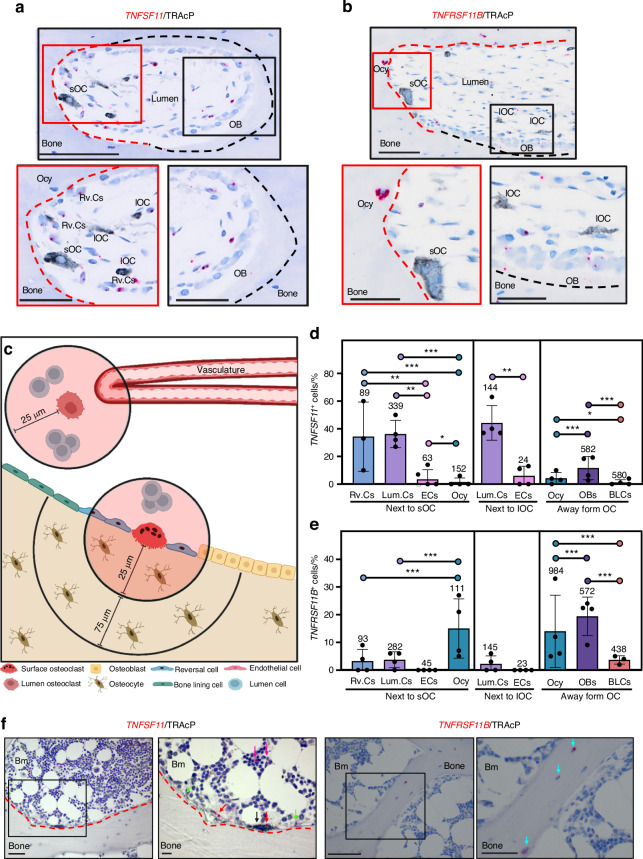
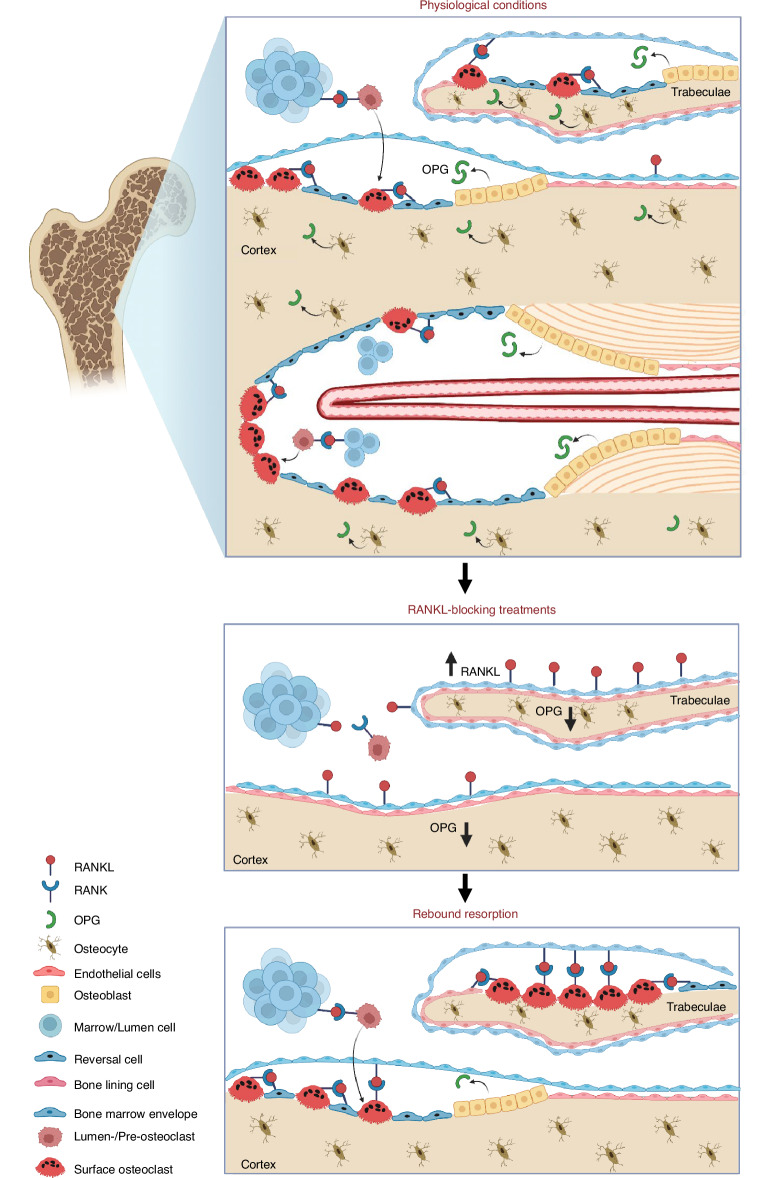
Denosumab is a monoclonal anti-RANKL antibody that inhibits bone resorption, increases bone mass, and reduces fracture risk. Denosumab discontinuation causes an extensive wave of rebound resorption, but the cellular mechanisms remain poorly characterized. We utilized in situ hybridization (ISH) as a direct approach to identify the cells that activate osteoclastogenesis through the RANKL/OPG pathway. ISH was performed across species, skeletal sites, and following recombinant OPG (OPG:Fc) and parathyroid hormone 1-34 (PTH) treatment of mice. OPG:Fc treatment in mice induced an increased expression of RANKL mRNA mainly in trabecular, but not endocortical bone surface cells. Additionally, a decreased expression of OPG mRNA was detected in bone surface cells and osteocytes of both compartments. A similar but more pronounced effect on RANKL and OPG expression was seen one hour after PTH treatment. These findings suggest that bone surface cells and osteocytes conjointly regulate the activation of osteoclastogenesis, and that OPG:Fc treatment induces a local accumulation of osteoclastogenic activation sites, ready to recruit and activate osteoclasts upon treatment discontinuation. Analysis of publicly available single-cell RNA sequencing (scRNAseq) data from murine bone marrow stromal cells revealed that Tnfsf11+ cells expressed high levels of Mmp13, Limch1, and Wif1, confirming their osteoprogenitor status. ISH confirmed co-expression of Mmp13 and Tnfsf11 in bone surface cells of both vehicle- and OPG:Fc-treated mice. Under physiological conditions of human/mouse bone, RANKL is expressed mainly by osteoprogenitors proximate to the osteoclasts, while OPG is expressed mainly by osteocytes and bone-forming osteoblasts.


Conflict of interest statement

M.M.M. and X.G.D. have received honoraria from Amgen. J.F.C. has participated in Alexion, Kyowa Kirin and Amgen advisory boards. J.F.C. has received funding from Novartis. M.B. and J.S.T. have received a research grant from Keros Therapeutics for an unrelated study. T.L.A. has collaborated with Amgen and is the custodian of the biopsies from the FREEDOM study, and in part received free reagents from ACD bioscience (now part of the Bio-Techne Corporation) for the specific study. Amgen Inc provided the OPG:Fc under a material transfer agreement.

Figures

Fig. 1
Fig. 1
OPG:Fc treatment Increases BMD and ablates osteoclasts, while treatment withdrawal results in rebound resorption. a Study design illustrating 6–8-week-old, female mice that were injected with vehicle or OPG:Fc (10 mg/kg) 3 times a week for 2 weeks followed by a withdrawal period. b Longitudinal DEXA scans of the left hind limb were carried out every second or third week, and at the end of the study. ce Ex vivo µCT femoral parameters at week 2, 8 11 or 13. f ISH of Acp5 using tissue sections of the tibia shows Acp5+ osteoclasts (green) present on trabecular and endocortical bone surfaces in vehicle-treated but not in OPG:Fc-treated mice, with return of Acp5+ cells following treatment withdrawal. g Oc.Pm/B.Pm determined using Acp5 ISH-stained sections after 2 weeks of treatment and at week 11 and 13 following withdrawal. f White dashed lines highlight trabecular, endocortical, and periosteal bone surfaces. cg Data is expressed as mean ± SD. P values are calculated using a mixed-effects analysis in (b), and using an unpaired t test in (ce), and (g). ****P values < 0.000 1, ***P values < 0.001, **P values < 0.01, *P values < 0.05. n = 3–8/group. Scale bars: (f) overview = 1 mm and high magnifications = 100 µm. Ct cortical, Tb trabecular, Bm bone marrow, OPG:W OPG:Fc withdrawal, Oc.Pm/B.Pm osteoclast perimeter/Bone perimeter, CS cross-sectional
Fig. 2
Fig. 2
OPG:Fc treatment induces a changed Tnfsf11 and Tnfrsf11b expression pattern. Tibiae from 8-week-old female mice were harvested after being injected thrice weekly for two weeks with either vehicle or OPG:Fc (10 mg/kg). Following the final dose of OPG:Fc at the end of the two-week period, Tnfsf11 and Tnfrsf11b ISH was performed on tissue sections. a Tnfsf11 (yellow) illustrated in bone sections from vehicle and OPG:Fc-treated mice. b Percentage of Tnfsf11+ cells against the distance from the trabecular or endocortical bone surface. c Tnfrsf11b (red) illustrated in bone sections from vehicle and OPG:Fc-treated mice. d Percentage of Tnfrsf11b+ cells against the distance from the trabecular or endocortical bone surface. a, c White dashed lines highlight trabecular, endocortical, and periosteal bone surfaces. Data is expressed as mean ± SEM. P values are calculated using a two-way ANOVA. ****P values < 0.000 1, ***P values < 0.001, **P values < 0.01, *P values < 0.05. n = 8/group. Scale bars: (a, b) overview = 1 mm and high magnifications (a) = 100 µm, (b) = 50 µm. Ct cortical, Tb trabecular, Bm bone marrow, OPG:W OPG:Fc withdrawal
Fig. 3
Fig. 3
OPG:Fc treatment has differential effects on Tnfsf11 and Tnfrsf11b expression in cortical and trabecular bone. Tnfsf11+ and Tnfrsf11b+ cell percentage and cell staining intensities were quantified in bone surface cells, osteocytes, and marrow cells and compared across cell types and between vehicle and OPG:Fc-treated mice. All data is collected from ISH stained sections of the tibia. a Percentage of Tnfsf11+ and Tnfrsf11b+ trabecular surface cells, trabecular osteocytes, and proximate marrow cells. b Mean Tnfsf11 and Tnfrsf11b cell staining intensities in trabecular surface cells, trabecular osteocytes and proximate marrow cells c Percentage of Tnfsf11+ and Tnfrsf11b+ endocortical surface cells, cortical osteocytes and marrow cells. d Mean Tnfsf11 and Tnfrsf11b cell staining intensities in endocortical surface cells, cortical osteocytes, and marrow cells. Data are shown as mean ± SD. P values are calculated using a two-way ANOVA. ****P values < 0.000 1, ***P values < 0.001, **P values < 0.01, *P values < 0.05. n = 8/group
Fig. 4
Fig. 4
Chondrocytes of the epiphysial growth plate of the tibia express high levels of Tnfrsf11b, while cells residing in the primary spongiosa express high levels of Tnfsf11. All results on this figure are female mice treated with vehicle or OPG:Fc for two weeks. a ISH of Tnfrsf11b (red) present at high levels in the growth plate of the tibia and articular cartilage and Tnfsf11 (yellow), present at the primary spongiosa. b Percentage of Tnfsf11+ and Tnfrsf11b+ cells, and Tnfsf11+/Tnfrsf11b+ cell ratios in chondrocytes and cells within the primary spongiosa. c Mean staining intensities of Tnfsf11 and Tnfrsf11b, and Tnfsf11/Tnfrsf11b staining intensity ratios in chondrocytes and cells within the primary spongiosa. d, e Percentage of Tnfsf11+ and Tnfrsf11b+ cells against the distance from the border between the primary spongiosa and chondrocytes. b, c Data are shown as mean ± SD. d, e Data are shown as mean ± SEM. P values are calculated using a two-way ANOVA or a mixed-effects analysis. be ****P values < 0.000 1, ***P values < 0.001, **P values < 0.01, *P values < 0.05. n = 8/group. Scale bars: Overview = 1 mm, high magnification images = 100 µm. GP growth plate, AC articular cartilage, PS primary spongiosa
Fig. 5
Fig. 5
Single cell RNA-seq data of enriched bone marrow stroma of male mice and multiplex ISH of tissue sections from OPG:Fc-treated female mice. a Bone marrow cells were classified into 13 cell clusters by UMAP: (0) Lepr+ Bglap+ mesenchymal stem cell (MSC), (1) bone marrow endothelial cell (BMEC), (2) megakaryocyte (Mk), (3) Lepr+ Bmp4hi MSC, (4) B cell, (5) myeloerythroid progenitor (MEP), (6) neutrophil (NEUT), (7) osteolineage cell (Osteo), (8) myofibroblast (Myofibro), (9) fibroblast (Fibro), (10) lymphocyte (LYM), (11) B cell, (12) neutrophil (NEUT), (13) basophil (Baso). b Expression of Tnfrsf11b and Tnfsf11 within each bone marrow cell cluster. c All differentially expressed genes identified in Tnfsf11+ cell compared to Tnfsf11 cells within clusters 0, 3, 7. d Tnfsf11/Mmp13/Col1a1, or (e) Tnfrsf11b/Mmp13/Col1a1 multiplex ISH conducted on adjacent sections of tibiae collected from mice treated with either vehicle or OPG:Fc for two weeks. d, e White dashed lines outline trabecular bone surfaces. Tb Trabecular, Bm bone marrow
Fig. 6
Fig. 6
PTH treatment induces a changed Tnfsf11 and Tnfrsf11b expression pattern. Tnfsf11 and Tnfrsf11b ISH performed on sections of femora obtained from 12-week-old female mice, 1 h after they were injected with a single dose of PTH (80 µg/kg). a Tnfsf11 (yellow) ISH illustrated in sections of the femur from vehicle and PTH treated mice. b Percentage of Tnfsf11+ cells against the distance from the trabecular or endocortical bone surface. c Tnfrsf11b (red) ISH illustrated in bone sections from vehicle and PTH treated mice. d Percentage of Tnfrsf11b+ cells against the distance from the trabecular or endocortical bone surface. e Percentage of Tnfsf11+ and Tnfrsf11b+ trabecular surface cells, trabecular osteocytes, and proximate marrow cells. f Mean Tnfsf11 and Tnfrsf11b cell staining intensities in trabecular surface cells, trabecular osteocytes and proximate marrow cells. g Percentage of Tnfsf11+ and Tnfrsf11b+ endocortical surface cells, cortical osteocytes and marrow cells. h Mean Tnfsf11 and Tnfrsf11b cell staining intensities in endocortical surface cells, cortical osteocytes, and marrow cells. ac White dashed lines highlight trabecular, endocortical, and periosteal bone surfaces. In (b, d) data is expressed as mean ± SEM. In (eh) data is expressed as mean ± SD. P values are calculated using a two-way ANOVA or mixed-effects analysis. ****P values < 0.000 1, ***P values < 0.001, **P values < 0.01, *P values < 0.05. n = 3/group. Scale bars: (a, b) Overview = 1 mm and high magnifications (a) = 100 µm or (b) = 50 µm. Ct cortical, Tb trabecular, Bm bone marrow
Fig. 7
Fig. 7
Fibrocytes of the spiral ligament express high levels of Tnfrsf11b. All data are obtained from a 10-day-old Sprague-Dawley rat. ISH on sections through the inner and middle ear, with representative overview image and high magnification images of the spiral ligament lining the bony labyrinth of the inner ear and the tympanic bulla of the middle ear for (a)Tnfrsf11b and (b) Tnfsf11 ISH of an adjacent section. The green dashed line separates the fibrocytes of the spiral ligament from the bony labyrinth. The black dashed line separates bone protected from remodeling from bone undergoing remodeling. The red dashed line outlines a region of the tympanic bulla of the middle ear. Scale bars: overview = 1 mm, high magnification images = 50 µm. BL bony labyrinth, SL spiral ligament
Fig. 8
Fig. 8
Surface cells proximate to osteoclasts mostly express Tnfsf11 while osteocytes express Tnfrsf11b. Representative images in this figure are of adjacent vertebral bone sections from a 12-week-old female mouse, while quantifications are from male and female mice. a Methodological approach. b Acp5 ISH and c Tnfsf11 ISH on adjacent section. d Acp5 ISH and (e) Tnfrsf11b ISH on adjacent section. Histograms illustrate the mean percentage of (f) Tnfsf11+ and (g) Tnfrsf11b+ cells. f, g Data are shown as mean ± SD and P values are calculated using one-way ANOVA. ****P values < 0.000 1, ***P values < 0.001, **P values < 0.01, *P values < 0.05. n = 10/group. Scale bars: = 50 µm. Tb Trabecular, Bm bone marrow. Illustrations were created using BioRender.com
Fig. 9
Fig. 9
TNFSF11 and TNFRSF11B expression in human cortical and trabecular bone. ae Data is obtained from cortical femoral bone specimens acquired from 4 adolescent females, and (f) from iliac crest bone sections from healthy humans. a Representative image of a selected cutting cone from TNFSF11 ISH (red), combined with a TRAcP (black) immunostained section. b Representative images of a selected cutting cone from TNFRSF11B (red) ISH, combined with a TRAcP (black) immunostained section. Red and black dashed lines in (a, b), respectively indicate eroded and formative surfaces, as determined by Masson’s Trichrome stained adjacent sections. c Methodological approach. d Histograms illustrate the mean percentage of TNFSF11+ cells located either next to surface osteoclasts, away from surface osteoclasts, or next to lumen osteoclasts. e Histogram illustrating the mean percentage of TNFRSF11B+ located either next to surface osteoclasts, away from surface osteoclasts, or next to lumen osteoclasts. The number above each bar is the number of cells quantified. f Representative images of human iliac crest bone sections stained for TNFSF11 or TNFRSF11B ISH (red), combined with a TRAcP immunostaining (black). TRAcP+ Osteoclasts (black arrow), TNFSF11+ Canopy cells (red arrows), reversal cells (green arrows), marrow cells (purple arrows), and TNFRSF11B+ osteocytes (blue arrows). d, e Data are shown as mean ± SD. Clustered logistic regression was utilized to determine the likelihood of TNFSF11 or TNFRSF11B being expressed in one cell population compared with another. ***P values < 0.001, **P values < 0.01, *P values < 0.05. P values, odds ratios, and corresponding 95% confidence intervals are shown in Table S1. Scale bars: overview = 100 µm, high magnification images = 50 µm. sOC surface osteoclast, lOC lumen osteoclast, Ocy osteocyte, OB osteoblast, Rv.C reversal cell, Lum.C lumen cell, EC vascular endothelial cell, BLC bone lining cell, Illustrations were created using BioRender.com
Fig. 10
Fig. 10
Concluding figure illustrating key findings. Under physiological conditions surfaces are activated by e.g. PTH stimulus and occupied by osteoclasts that resorb bone. Osteoprogenitors are recruited to the bone surface, where they continue providing the necessary RANKL for continuous recruitment of osteoclasts until bone formation is initiated where osteoblasts, together with osteocytes provide inhibitory OPG. During inhibition of RANKL (by e.g. OPG:Fc or denosumab treatment), osteoclasts are abolished, also leading to the abolishment of osteoblast lineage cells due to the coupling of bone resorption and formation. Moreover, trabecular bone surface cells increase the production of RANKL, while OPG production is decreased in trabecular surface cells and osteocytes. RANKL production remains unchanged in endocortical surface cells and osteocytes, while OPG is reduced in bone surface cells and osteocytes near the surface. Taken together, this reflects an accumulation of local activation sites with an increase in RANKL production in trabecular, but not endocortical bone surfaces, and a decrease in OPG in bone surface cells, and osteocytes close to the trabecular and endocortical surfaces. This shift in local RANKL/OPG production eventually sets stage for rebound bone resorption upon treatment discontinuation. Illustrations were created using BioRender.com

References

    1. Delaisse, J. M. et al. Re-thinking the bone remodeling cycle mechanism and the origin of bone loss. Bone141, 115628 (2020). - PubMed
    1. FROST, H. M. Dynamics of bone remodeling. Bone Biodyn. 315-334 (1964).
    1. Lassen, N. E. et al. Coupling of bone resorption and formation in real time: New knowledge gained from human Haversian BMUs. J. Bone Min. Res.32, 1395–1405 (2017). - PubMed
    1. Parfitt, A. M. The coupling of bone-formation to bone-resorption - a critical analysis of the concept and of its relevance to the pathogenesis of osteoporosis. Metab. Bone Dis. Relat.4, 1–6 (1982). - PubMed
    1. Andersen, T. L. et al. Understanding coupling between bone resorption and formation: Are reversal cells the missing link? Am. J. Pathol.183, 235–246 (2013). - PubMed

LinkOut - more resources