. 2024 Oct 18;15(1):9021.
doi: 10.1038/s41467-024-53355-6.

Modal-nexus auto-encoder for multi-modality cellular data integration and imputation

Affiliations

Modal-nexus auto-encoder for multi-modality cellular data integration and imputation

Zhenchao Tang et al. Nat Commun. .

Abstract

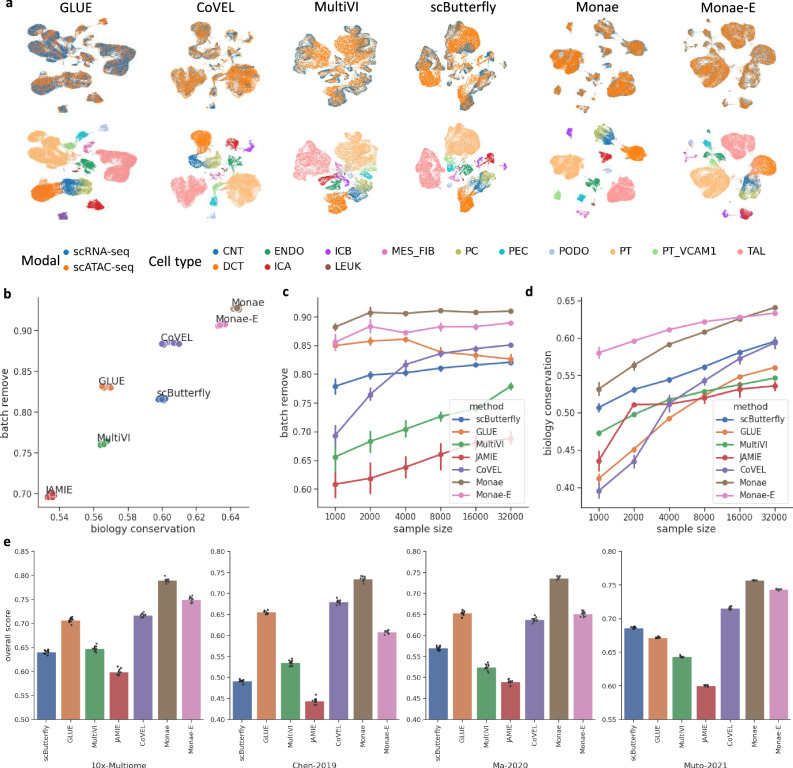
Heterogeneous feature spaces and technical noise hinder the cellular data integration and imputation. The high cost of obtaining matched data across modalities further restricts analysis. Thus, there's a critical need for deep learning approaches to effectively integrate and impute unpaired multi-modality single-cell data, enabling deeper insights into cellular behaviors. To address these issues, we introduce the Modal-Nexus Auto-Encoder (Monae). Leveraging regulatory relationships between modalities and employing contrastive learning within modality-specific auto-encoders, Monae enhances cell representations in the unified space. The integration capability of Monae furnishes it with modality-complementary cellular representations, enabling the generation of precise intra-modal and cross-modal imputation counts for extensive and complex downstream tasks. In addition, we develop Monae-E (Monae-Extension), a variant of Monae that can converge rapidly and support biological discoveries. Evaluations on various datasets have validated Monae and Monae-E's accuracy and robustness in multi-modality cellular data integration and imputation.


Conflict of interest statement

The authors declare no competing interests.

Figures

Fig. 1
Fig. 1. Illustration of the multi-modality integration and imputation.
a Integration across modalities. Modal data initially exhibit gaps that are bridged through integration to obtain the unified embeddings (separating cell types). b Intra-modal imputation. Sparse observations within a single modality are recovered to produce a complete data matrix. c Cross-modal imputation. Information from a source modality is leveraged to predict the target modality matrix for cell-unpaired scenarios. d The proposed method supports simultaneous integration and imputation on unpaired data. For integration, cross-modal cells of the same cell type are clustered together. For imputation, our method generates both intra-modal counts (fixing gray dropout observations) and cross-modal counts (filling blanks in dashed rectangles or circles) based on the integrated cell representations.
Fig. 2
Fig. 2. The overall architecture of Monae.
a Graph-linked embedding learning. The coarse graph-linked guidance is constructed from multi-modality relationships, and a graph encoder learns the feature embedding of multi-modality nodes. A graph decoder then generates the fine graph-linked guidance. b Construction of positive and negative samples. Asymmetric networks for each modality (e.g., scRNA-seq, scATAC-seq) transform cells into embeddings. Positive sample pairs are formed from teacher and student branches. c Contrastive cell embedding learning. Positive sample pairs are pulled together while negative samples are pushed apart through contrastive learning, yielding discriminative cell embeddings. d The learned contrastive cell embeddings serve as integration representations for unsupervised clustering. They are also combined with the multi-modal feature (node) embeddings to reconstruct imputation counts. e Further extending (a) to build Monae-E (Monae-Extension). Cells are added as nodes to the graph-linked guidance, and Graph VAE outputs all node embeddings. The following process is the same as (b), (c), and (d). Monae-E uses the cell embedding as the input of the asymmetric network and the feature embedding to reconstruct the input.
Fig. 3
Fig. 3. Multi-modality integration results.
a UMAP visualization of different methods on Muto-2021. Colored by modality and cell type annotations. b Integration performance comparison on Muto-2021 (the balance between batch removal and biology conservation). There are n = 9 repeats with different random seeds for data splitting. The error bars indicate mean ± s.d. c, d Robustness validation on subsampled Muto-2021 of various scales. Integration performance trends as sample size increases. There are n = 9 repeats with different random seeds for data splitting. The error bars indicate mean ± s.d. e Comparison of integration results on four datasets, where the metric is the overall score. There are n = 9 repeats with different random seeds for data splitting. The error bars indicate mean ± s.d. Source data are provided as a Source Data file.
Fig. 4
Fig. 4. Large-scale multi-modality data integration comparison.
a The efficiency of GLUE, CoVEL, Monae, and Monae-E on datasets of different scales, including the time spent on unsupervised training and memory usage (RES and MEM). b UMAP visualizations of GLUE, CoVEL, Monae, and Monae-E. The first row of visualizations is colored by modality (omics layer) categories, highlighting the integration results of scRNA-seq and scATAC-seq. The second row displays the same integration results colored by cell types to demonstrate the distinct clustering. Dashed circles in the subfigures indicate areas of interest where specific cell types serve as a qualitative assessment of the integration performance. c Modality labels and cell type labels in the Human 15 organs dataset. Source data are provided as a Source Data file.
Fig. 5
Fig. 5. Intra-modal imputation and cross-modal imputation.
a UMAP visualization of intra-modal imputation counts on Muto-2021. PCA is performed on the raw counts and imputation counts, followed by UMAP with cell-type labels. b Intra-modal imputation results on Muto-2021. There are n = 9 repeats with different random seeds for data splitting. The error bars indicate mean ± s.d. c Cross-modal imputation results on Muto-2021 (RNA to ATAC). There are n = 9 repeats with different random seeds for data splitting. The error bars indicate mean ± s.d. d Cross-modal imputation results on Muto-2021 (ATAC to RNA). There are n = 9 repeats with different random seeds for data splitting. The error bars indicate mean ± s.d. e Cross-modal imputation gene expression heatmap corresponding to Monae (top) and scButterfly (bottom), with rows representing cells and columns representing genes. f Cell-level (left) and gene-level (right) PCC between the imputation and raw counts. g Cell-level (left) and gene-level (right) PCC between the imputation and MultiVI counts. Source data are provided as a Source Data file.
Fig. 6
Fig. 6. Biological discovery application of Monae-E.
a UMAP visualization of cells and genes joint embeddings. b Marker gene expressions on imputation counts. c Regulatory relationships between VCAM1 and similar peaks. The color of the link indicates the strength of the relationship. d Pseudo-time of cell clusters. e Gene expression and peak expression in the path: PT (orange) to PT_VCAM1 (green). f TF-target genes network of HNF4A (orange node). Target genes supported by research are represented by pink nodes. Target genes for which no research support was found are represented as blue nodes. g For the blue nodes in (f), we choose the top-5 genes. The expression patterns of these candidate genes in the two modalities are consistent with HNF4A.

References

    1. Lv, Q., Chen, G., Yang, Z., Zhong, W., Chen, C.Y.-C. Meta learning with graph attention networks for low-data drug discovery. IEEE Trans. Neural Netw. Learn. Syst.35, 11218–11230 (2023). - PubMed
    1. Tang, Z., Chen, G., Yang, H., Zhong, W., Chen, C.Y.-C. DSIL-DDI: A domain-invariant substructure interaction learning for generalizable drug–drug interaction prediction. IEEE Trans. Neural Netw. Learn. Syst.35, 10552–10560 (2023). - PubMed
    1. Luecken, M.D. et al. A sandbox for prediction and integration of dna, rna, and proteins in single cells. In Thirty-fifth Conference on Neural Information Processing Systems Datasets and Benchmarks Track (Round 2) (2021).
    1. Baysoy, A., Bai, Z., Satija, R. & Fan, R. The technological landscape and applications of single-cell multi-omics. Nat. Rev. Mol. Cell Biol.24, 695–713 (2023). - PMC - PubMed
    1. Patruno, L. et al. A review of computational strategies for denoising and imputation of single-cell transcriptomic data. Brief. Bioinforma.22, 222 (2021). - PubMed

Publication types

Associated data

LinkOut - more resources