. 2024 Nov;56(11):2479-2492.
doi: 10.1038/s41588-024-01948-8. Epub 2024 Oct 18.

Base editing screens define the genetic landscape of cancer drug resistance mechanisms

Affiliations

Base editing screens define the genetic landscape of cancer drug resistance mechanisms

Matthew A Coelho et al. Nat Genet. 2024 Nov.

Abstract

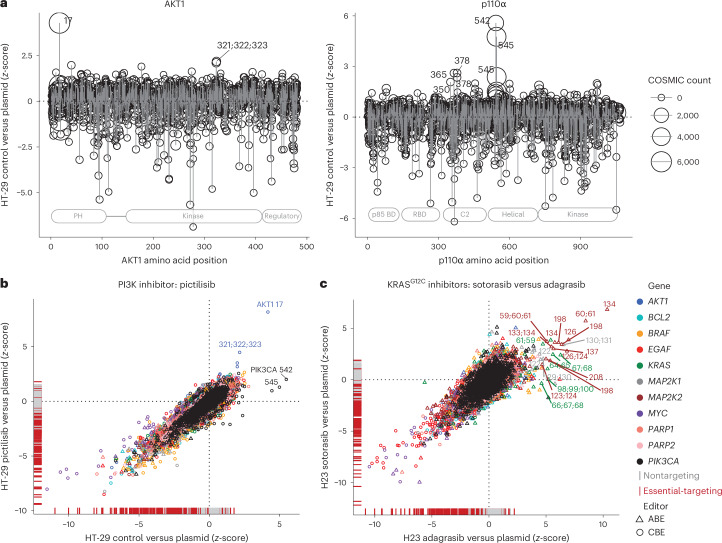
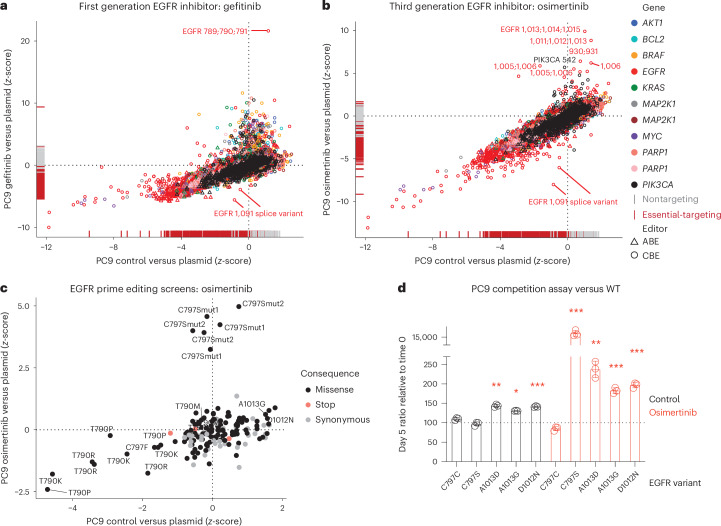
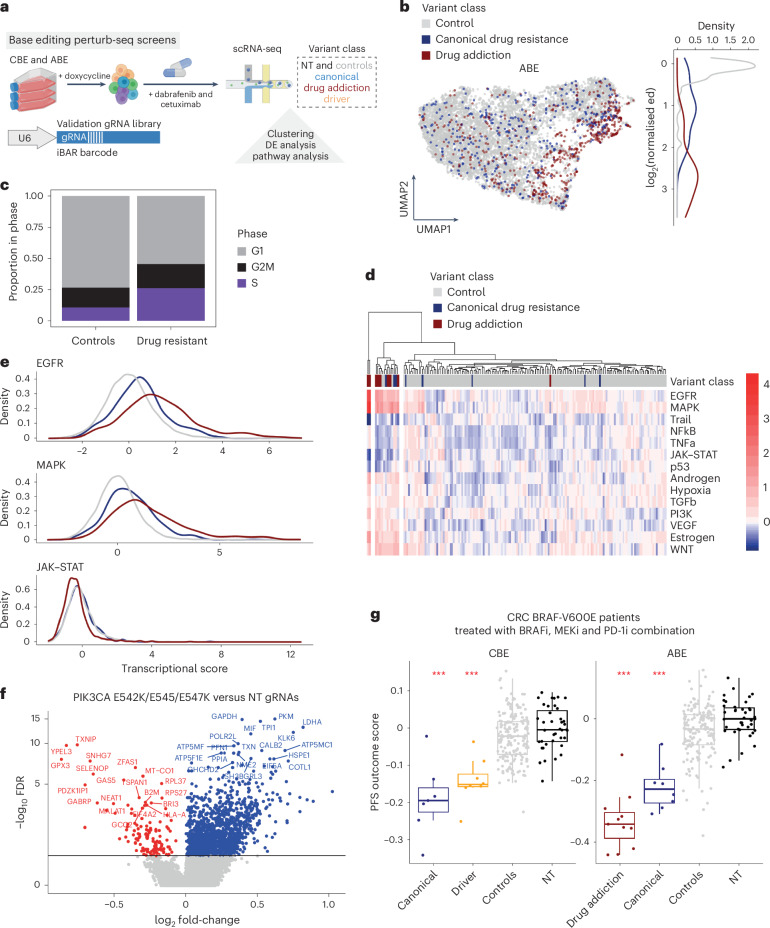
Drug resistance is a principal limitation to the long-term efficacy of cancer therapies. Cancer genome sequencing can retrospectively delineate the genetic basis of drug resistance, but this requires large numbers of post-treatment samples to nominate causal variants. Here we prospectively identify genetic mechanisms of resistance to ten oncology drugs from CRISPR base editing mutagenesis screens in four cancer cell lines using a guide RNA library predicted to install 32,476 variants in 11 cancer genes. We identify four functional classes of protein variants modulating drug sensitivity and use single-cell transcriptomics to reveal how these variants operate through distinct mechanisms, including eliciting a drug-addicted cell state. We identify variants that can be targeted with alternative inhibitors to overcome resistance and functionally validate an epidermal growth factor receptor (EGFR) variant that sensitizes lung cancer cells to EGFR inhibitors. Our variant-to-function map has implications for patient stratification, therapy combinations and drug scheduling in cancer treatment.


Conflict of interest statement

M.J.G. has received research grants from AstraZeneca, GSK and Astex Pharmaceuticals, and is a founder and advisor for Mosaic Therapeutics. J.C.M. has been an employee of Genentech since September 2022. A.B. is a founder and consultant for EnsoCell Therapeutics. M.A.C. and M.J.G. are inventors on patent applications that encompass work described in this paper. J.V.F. and G.I. are employees and shareholders of AstraZeneca. E.E.V. is a founder and advisor for Mosaic Therapeutics. The other authors declare no competing interests.

Figures

Fig. 1
Fig. 1. Base editing screens map functional domains in oncogenes.
a, Overview of base editing screens to identify drug resistance variants in cancer cell models. b, Base editor screens in HT-29 cells across 11 cancer genes show depletion of gRNAs targeting essential genes demonstrating base editing activity. Unpaired, two-tailed Student’s t-test comparing NT gRNAs (n = 114) with gRNAs targeting essential gene splice sites (n = 632) in CBE and ABE screens. Boxplots represent the median, interquartile range (IQR) and whiskers are the lowest and highest values within 1.5 × IQR. c, Comparison of gRNA z-scores from base editor screens in PC9 (EGFR-mutant, MYC-dependent) and HT-29 (BRAF-mutant, MYC-dependent) reveals shared and disparate oncogene dependencies. d, Base editing mutagenesis screens of the driving oncogene, BRAF, in HT-29 cells reveal functional protein domains, sites of post-translational modification and driver variants. Data are the average of two independent experiments. See also Extended Data Fig. 1. Schematic in a created with BioRender.com.
Fig. 2
Fig. 2. Variants modulating drug sensitivity cluster into four functional classes.
a, Variants conferring resistance or sensitivity to the MEK inhibitor, trametinib, in HT-29 cells. Comparison of gRNA z-scores for the control treated arm versus plasmid library, and the drug-treated arm versus plasmid library is shown. b, Variants conferring resistance to the combination of BRAF and EGFR inhibitors, dabrafenib and cetuximab, in HT-29 cells. Comparison of gRNA z-scores for the control treated arm versus plasmid library, and the drug-treated arm versus plasmid library is shown. c, Crystal structure of the complex of EGFR and cetuximab (PDB 1yy9), and MEK1 and trametinib (PDB 7jur), highlights canonical drug resistance variants discovered in base editor screens predicted to disrupt drug binding. d, Cell growth of base-edited HT-29 cells harboring canonical and drug-addiction drug-resistance variants. Cells were left untreated or treated with trametinib (3 nM) or the combination of dabrafenib (80 nM) and cetuximab (1 µg ml−1), and cell proliferation was monitored using an incucyte. Data represent the mean ± s.d. of biological triplicates and are representative of two independent experiments. e, Western blotting of WT HT-29 ABE cells and cells harboring drug-resistance mutations activating the MAPK signaling pathway. Cells were treated with the combination of dabrafenib (80 nM) and cetuximab (1 µg ml−1) or DMSO as a control for 24 h before analysis. f, β-galactosidase staining for senescent cells; β-galactosidase positive senescent foci (blue) are indicated with arrows. HT-29 cells were treated with the combination of dabrafenib (80 nM) and cetuximab (1 µg ml−1) or DMSO as a control for 48 h before analysis. Representative images are shown for the drug addiction variant MAP2K1 Y130C. Scale bar, 500 µm. Predicted amino acid editing consequences are labeled for drug resistance screens and genotyped edits are shown in d, e and f. Data are the average of two independent experiments performed on separate days, or representative of two independent experiments (e and f). See also Extended Data Figs. 2 and 3. Source data
Fig. 3
Fig. 3. Driver variants conferring drug resistance.
a, Base editing screens reveal clinically apparent hotspot mutations in oncogenes. Comparison of total COSMIC mutation counts for amino acid positions were compared with the z-score of gRNAs tiling across AKT1 and PIK3CA in HT-29 cells. b, Drug resistance variants to the PI3K inhibitor, pictilisib, in HT-29 cells. Comparison of gRNA z-scores for the control treated arm versus plasmid library, and the drug-treated arm versus plasmid library is shown. c, Drug resistance variants to the KRASG12C inhibitors, sotorasib and adagrasib, in H23 lung cancer cells. Comparison of gRNA z-scores for the sotorasib treated arm versus plasmid library, and the adagrasib treated arm versus plasmid library is shown. Predicted amino acid editing consequences are labeled for drug resistance variants. Data are the average of two independent screens performed on separate days.
Fig. 4
Fig. 4. Drug resistance and drug-sensitizing variants in PARP1.
a, Base editing screens of PARP1 and PARP2 in the presence of olaparib or niraparib reveal drug-sensitizing and drug resistance variants. Comparison of gRNA z-scores for the control treated arm, olaparib-treated or niraparib-treated arm versus plasmid library is plotted against the amino acid position. Predicted amino acid editing consequences are labeled for drug resistance variants. The position of the catalytic domain of PARP1 and PARP2 is shown. Screening data are the average of two independent screens performed on separate days. b, Competition assays comparing variants in PARP1 that modulate response to olaparib and niraparib. GFP NT gRNA cells were grown in competition with PARP1-edited cells expressing BFP and quantified with flow cytometry after 72 h in the presence or absence of PARP inhibitors (IC50 concentrations; olaparib 510 nM, niraparib 330 nM). Two independent gRNAs installing the I691T variant were tested. Data represent the mean ± s.d. of two independent experiments, each performed in biological triplicate. Unpaired, two-sided Student’s t-test comparing NT gRNAs with gRNAs targeting PARP1; ***P < 0.0001, **P = 0.0004 (I691T) or 0.0002 (M1V), *P = 0.014 (L390S/S391P) or 0.013 (Y829H/L831P). c, Dose response proliferation assay comparing the growth of MHH-ES-1 ABE cells harboring a NT control gRNA or a gRNA installing the PARP1 Y889C variant. Data are the average of two independent experiments, each performed in triplicate. Two-way ANOVA (analysis of variance); ***P < 0.0001. CTG; CellTiter-Glo. d, Crystal structures of PARP1 bound to olaparib (PDB 7AAD) or niraparib (PDB 7KK5) comparing the two binding modes of the inhibitors with respect to the Y889 residue. See also Extended Data Fig. 4. Schematic in b created with BioRender.com.
Fig. 5
Fig. 5. Drug resistance and drug-sensitizing variants in EGFR.
a, Drug resistance variants to the EGFR inhibitor gefitinib, profiled with CBE and ABE base editors in PC9 lung cancer cells. Comparison of gRNA z-scores for the control treated arm versus plasmid library, and the drug-treated arm versus plasmid library is shown. b, Drug resistance variants to the EGFR inhibitor, osimertinib, profiled with CBE and ABE base editors in PC9 lung cancer cells. Comparison of gRNA z-scores for the control treated arm versus plasmid library, and the drug-treated arm versus plasmid library is shown. Data represent the average of two independent screens performed on separate days. c, Prime editing mutagenesis screens of EGFR in the presence and absence of osimertinib. PC9 ∆MLH1 cells were prime edited for 7 days with doxycycline (1 µg ml−1) before growth for 10 days in DMSO (control) or osimertinib (75 nM). Data represent the z-score for each pegRNA derived from the average of two independent screens performed on separate days. Samples were compared with the plasmid library. d, Competition flow cytometry assays in PC9 ∆MLH1 cells comparing the growth of NT gRNA GFP cells with epegRNA BFP cells harboring different EGFR variants in the presence and absence of osimertinib (75 nM) for 5 days. Data are normalized to day 0 ratios and represent the mean ± s.d. of biological triplicates. Unpaired, two-tailed Student’s t-test comparing with the EGFR C797C synonymous variant control; *P = 0.0003, **P = 0.0002, ***p < 0.0001. Predicted amino acid editing consequences are labeled for drug resistance variant screens. See also Extended Data Fig. 5.
Fig. 6
Fig. 6. EGFR C-terminal truncating variants sensitize to EGFR inhibitors.
a, Increased gefitinib and osimertinib sensitivity in PC9 cells with EGFR C-terminal truncating mutations. Data represent the mean ± s.e.m. of two independent experiments, each performed in biological triplicate. Two-way ANOVA (analysis of variance) comparing with parental (Par.) response; ***P < 0.0001. CTG; CellTiter-Glo. b, A drug-sensitizing base edit in EGFR causes loss of a splice donor site. The EGFR RNA splice variants are shown by migration of PCR products from cDNA. The larger PCR product in the mutant samples is due to retention of a short region of a downstream intronic sequence after exon 27, where an alternative splice donor is used. EGFR protein after residue 1,091 is not translated due to a frameshift leading to a stop codon. c, Western blotting of drug-sensitizing mutants reveals a C-terminal truncation in EGFR and confirms drug sensitization. PC9 CBE or ABE control cells (NT gRNA) or cells mutant for EGFR were treated with gefitinib (gefit.), osimertinib (osim.) or DMSO vehicle control (ø) for 24 h before analysis. Data are representative of two independent experiments. d, Flow cytometry analysis of EGFR protein surface expression in PC9 cells with WT EGFR or base-edited EGFR. Data are represented as a histogram or quantified as EGFR-FITC mean fluorescence intensity (MFI), and represent the mean of three independent experiments ± s.d. Unpaired, two-tailed Student’s t-test; ***P = 0.0004, **P = 0.0096, *P = 0.0217. See also Extended Data Fig. 6. Source data
Fig. 7
Fig. 7. Perturb-seq functionally defines drug-resistant cell states.
a, Schematic of perturb-seq screening to investigate the transcriptomic effects of variants conferring resistance to dabrafenib and cetuximab in HT-29 cells using base editing. DE, differential expression analysis. b, Uniform manifold approximation and projection colored by variant class and normalized energy distances (ed) between NT gRNA cells and drug-resistant cells in ABE HT-29 cells treated with the combination of dabrafenib (80 nM) and cetuximab (1 µg ml−1) for 16 h. c, Cell-cycle phase occupancy differences between cells with drug resistance conferring gRNAs and control gRNAs in the ABE perturb-seq dataset. P < 2.2 × 10−16 for ABE dataset, P < 1.5 × 10−14 for CBE dataset, chi-squared test, comparing control gRNAs with drug resistance gRNAs. d, Heatmap and hierarchical clustering of PROGENy pathway activity scores for each gRNA in the ABE dataset. e, Density plot of differences in PROGENy pathway scores between the variant groups for the ABE dataset. f, Volcano plot of differentially expressed genes between NT gRNA control cells and cells with the PI3K p110ɑ driver variant. Red, significantly downregulated transcripts (including B2M and HLA-A); blue, upregulated transcripts. g, Boxplot of PFS outcome score for each variant class, derived from CRC patients treated with BRAF, MEK and PD-1 inhibitor (PD-1i) combination therapy. CBE and ABE perturb-seq scores are shown. ***P < 0.01, two-sided Wilcoxon rank-sum test compared with NT gRNAs. CBE; canonical drug resistance n = 7, driver n = 8, control n = 172, NT n = 39. ABE; drug addiction n = 11, canonical drug resistance n = 8, control n = 115, NT n = 39. Boxplots represent the median, IQR and whiskers are the lowest and highest values within 1.5× IQR. Control gRNAs are those that did not confer drug resistance in proliferation screens. See also Extended Data Figs. 7–9.
Fig. 8
Fig. 8. A variant map indicates potential second-line therapies.
A variant function map highlights variants modulating drug sensitivity in cancer cells. Potential alternative treatments tested in this study are listed. Genotypes are from next-generation sequencing or Sanger sequencing of hits from base editing screens. See also Extended Data Fig. 10 and Supplementary Tables 15–17. Created with BioRender.com.
Extended Data Fig. 1
Extended Data Fig. 1. Base editing screens map functional domains in driving oncogenes.
Replicate correlation for CBE and ABE screens across four cancer cell models; HT-29, H23, PC9 and MHH-ES-1. Pearson correlation coefficient values (r) between independent replicate screens are shown. Low correlation was observed for replicates of PC9 screens with gefitinib, which may relate to a high degree of enrichment of resistant, EGFR T790M base edit harbouring cells.
Extended Data Fig. 2
Extended Data Fig. 2. Variants modulating drug sensitivity cluster into four functional classes.
a) Base editor screens in H23, PC9 and MHH-ES-1 cancer cells targeting 11 cancer genes show depletion of gRNAs targeting essential genes demonstrating base editing activity. Unpaired, two-tailed Student’s t-test comparing non-targeting gRNAs (n = 114) to gRNAs targeting essential gene splice sites (n = 632) in CBE and ABE screens. For MHH-ES-1, ABE screens are shown (NT; n = 57; essential-targeting, n = 306). Boxplots represent the median and interquartile range (IQR), and whiskers represent the lowest and highest values within 1.5 x the IQR. b) Number of off-target sites plotted against the z-score for base editing gRNAs. A high number of off-targets for a small number of KRAS UTR-targeting gRNAs is associated with severe gRNA depletion. These were filtered out of downstream analysis. c)Our previously reported whole-genome CRISPR-Cas9 KO screen in HT-29 cells in the presence of dabrafenib (0.1 µM) across three time-points. Volcano plot showing EGFR KO as the top sensitising hit. Data are the average of two independent screens and significance was determined with MAGeCK, with a threshold of p-value < 0.05 and FDR < 0.05. d)TCGA oncoprint (pan-cancer cohort, n = 526) of colorectal adenocarcinomas with alterations in KRAS and BRAF. Mutual exclusivity p-value < 0.001 derived from two-sided Fisher exact test, q-value < 0.001 derived from Benjamini-Hochberg FDR correction procedure for multiple hypothesis testing.
Extended Data Fig. 3
Extended Data Fig. 3. Validation of cancer drug addiction variant phenotypes.
a) Western blotting of drug resistance variants from base editing screens in HT-29 cells conferring resistance to dabrafenib and cetuximab combination therapy. HT-29 cells harbouring the indicated variants were treated with dabrafenib (80 nM) and cetuximab (1 µg/ml) or DMSO (control) for 24 h before analysis. Data are representative of two independent experiments (see also Fig. 2). b) Microscopy images of ß-galactosidase assays performed to measure the induction of senescence. HT-29 cells harbouring the indicated variants were treated with dabrafenib (80 nM) and cetuximab (1 µg/ml) or DMSO (control) for 48 h before analysis. Representative images from two independent experiments. Scale bar indicates 500 µm. Genotyped variants are shown. Source data
Extended Data Fig. 4
Extended Data Fig. 4. Drug-sensitising variants.
a) Variants modulating sensitivity to PARP1/2 inhibitors olaparib or niraparib in MHH-ES-1 cells in CBE or ABE screens. Comparison of gRNA z-scores for the drug-treated arm vs plasmid library against the z-scores from the untreated control vs the plasmid library. Predicted edited amino acid positions are labelled. b) Sanger Sequencing of base edits in PARP1 from validation experiments using individual gRNAs that caused drug resistance or sensitisation to PARP1/2 inhibitors. Data are representative of two independent experiments. c) Proliferation assays measuring drug response to olaparib and niraparib PARP inhibitors in MHH-ES-1 ABE cells harbouring the genotyped drug-sensitising variant, PARP1 I691T. Data represent the mean ± SD of two independent experiments performed on separate days, each in biological triplicate (CTG; CellTiter-Glo). 2-way ANOVA; ***p-value < 0.0001. d) Western blotting assessment of PARP trapping on DNA in MHH-ES-1 ABE cells harbouring the PARP1 Y889C variant or a non-targeting (NT) control gRNA. Cells were treated with a DNA damaging agent (MMS, 0.01 %) and the PARP inhibitor with olaparib or niraparib (both at 3 µM) for 4 h before analysis. Nuclei were fractionated into a chromatin-bound and soluble fractions prior to immunoblotting. Cl. denotes cleaved PARP in response to DNA damage and PARP inhibition. Lamin A/C and histone H3 serve as loading controls for chromatin-bound and soluble fractions, respectively. e) Immunofluorescence microscopy assessment of PARP trapping on DNA in MHH-ES-1 ABE cells harbouring the PARP1 Y889C variant or a non-targeting (NT) control gRNA. Cells were treated with a DNA damaging agent (MMS, 0.01 %) and the PARP inhibitor with olaparib or niraparib (dose titration) for 4 h. PARP protein not bound to chromatin was removed before fixation and staining. Data represent the mean ± SD fluorescence nuclear intensity of PARP1 from biological triplicates. Source data
Extended Data Fig. 5
Extended Data Fig. 5. Prime editing screening of EGFR variants.
a) Western blot for MLH1 verifies KO of MLH1 in PC9 cells. PC9 cells were transfected with a Cas9-GFP plasmid encoding an MLH1 targeting gRNA. FACS of GFP positive single cells gave clonal populations, or a pooled population (“pool”). Cells were expanded before analysis by Western blotting. Actin serves as a loading control. Data are representative of two independent experiments. b) Sanger sequencing of prime editing of EGFR C797S in PC9 cells. PC9-PE MLH1 KO (clone 1 from above), or MLH1 WT PC9-PE cells were infected with a pegRNA encoding the C797S edit, puromycin selected and prime editing was initiated with the addition of doxycycline for 5 days. Control (untreated) or osimertinib selected cells (5 nM) are shown. The EGFR C797 locus was PCR amplified and then analysed with Sanger sequencing. c) Replicate correlation between pegRNA z-scores from EGFR prime editing mutagenesis screens performed in PC9 MLH1 KO PE2 cells. Data are from two independent screens performed on different days. Labelled are predicted mutations in EGFR installed by the pegRNAs. Pearson correlation coefficient values (r) between independent replicate screens are shown. pegRNA, prime editing gRNA. Source data
Extended Data Fig. 6
Extended Data Fig. 6. EGFR C-terminal truncating variants sensitise to EGFR inhibitors.
a) Drug titration experiments in PC9 CBE and ABE cells using Cell-titre Glo to measure cell proliferation in the presence of EGFR inhibitors (cetuximab, erlotinib, lapatinib), or chemotherapy agents (cisplatin, paclitaxel). Data represent the mean ± SD of two independent experiments performed on separate days, each in biological triplicate. b) Sanger sequencing of DNA from WT or base edited PC9 cells harbouring the EGFR-inhibitor sensitising splice variant. CBE editing and ABE editing of a known (GT) splice donor is shown. The position of each gRNA is indicated. c) Sanger sequencing cDNA from WT or base edited PC9 cells harbouring the EGFR-inhibitor sensitising splice variant. WT cells display exon-exon splicing as expected, whereas mutant cells display intron retention by utilising an alternative splice donor in the downstream intron. d) Gating strategy for flow cytometry analysis of EGFR expression on PC9 cells (FITC). Gating was performed on cells, singlets, viable cells, BFP+ cells (gRNA expression).
Extended Data Fig. 7
Extended Data Fig. 7. Perturb-seq quality control and pathway analysis.
a) Correlation between large-scale base editing screens (PC9 CBE and ABE) and a small-scale validation base editing screen designed for perturb-seq. Pearson correlation coefficients (r) are shown for gefitinib and osimertinib screens. b) Density plot of gRNA classes against cell numbers in single-cell sequencing for HT-29 CBE and ABE experiments after quality control. Cells with gRNAs targeting splice sites in essential genes are depleted, indicating efficient editing. c) Heatmap of scaled expression levels (mean=0, SD = 1, average across gRNA) of genes differentially expressed for at least one resistance gRNA with an absolute log2-fold change > 0.5 at FDR < 0.1, when comparing against cells with NT gRNAs in HT-29 CBE or ABE perturb-seq screens. The dendrogram was cut at 4 clusters to show the varying gene expression levels and their association with variant class. d) UMAPs coloured by variant class and normalised energy distances (ed) between NT gRNA cells and drug resistant cells in CBE HT-29 cells treated with the combination of dabrafenib (80 nM) and cetuximab (1 µg/ml) for 16 h. e) Heatmap of scaled expression levels (mean=0, SD = 1, average across gRNA) of cell-cycle related genes (GO.0007049) that are differentially expressed for at least one resistance gRNA with absolute log2-fold change > 0.75 and FDR < 0.001 for the HT-29 ABE perturb-seq screen for at least one gRNA.
Extended Data Fig. 8
Extended Data Fig. 8. Perturb-seq functionally defines drug resistant cell states.
a) Differential expression analysis of pathways from MAYA or PROGENy for HT-29 CBE and ABE perturb-seq screens. Heatmaps display log-fold changes for a given pathway-gRNA comparison, and statistical significance is denoted with a dot (significance at FDR < 0.1). b) Differential expression at the level of PROGENy pathway scores for drug addiction versus canonical drug resistance. For each gRNA the same number of iBARs was sampled to avoid biases resulting from an over-representation of individual gRNAs. c) Comparison of z-scores from proliferation read-out base editing screens to energy distance scores derived from perturb-seq screens. Variant classes based on the HT-29 proliferation screens in dabrafenib and cetuximab are indicated. Intermediate variants discussed in the text are labelled. d) Diffusion scores illustrate progressive levels of mutational impact for the CBE and ABE data set, with drug addiction variants having the highest scores and a range of different impact levels across the gRNAs conferring drug resistance. The intermediate variants KRAS E62K/E63K and KRAS K117R/E/D119G are highlighted. e) Volcano plots of significantly differentially expressed genes (vs NT control gRNA cells) from representative drug resistance gRNAs. B2M is downregulated by both variants. Significant down- and upregulation at FDR < 0.1 (Benjamini-Bogomolov correction) are indicated in blue and red respectively.
Extended Data Fig. 9
Extended Data Fig. 9. Effect of MAPK signalling and drug addiction variants on antigen presentation and sensitivity to T cell killing.
a) Flow cytometry assessment of B2M and HLA-A,B,C expression in HT-29 ABE cells harbouring drug addiction variants. Data represent the mean ± SD of biological triplicates. IFN-gamma treatment serves as a positive control (48 h, 400 U/ml). ****P-value < 0.0001; ***P-value = 0.0003 (HLA) or 0.0005 (B2M); **P-value = 0.002; *P-value = 0.037; unpaired, two-tailed Student’s t-test comparing to non-targeting gRNA (NT) condition. Genotyped variants are shown. b) Flow cytometry assessment of B2M and HLA-A,B,C expression in CRC-9 ABE tumour organoid cells harbouring drug addiction variants. Cells were treated with DMSO (control) or the MEK inhibitor trametinib (25 nM) for 48 h before analysis. Data represent the mean ± SD of two independent experiments. IFN-g treatment serves as a positive control (48 h, 400 U/ml). ****P-value < 0.0001; ***P-value = 0.0015; **P-value = 0.0066 (B2M or 0.0012 (HLA); *P-value = 0.031; unpaired, two-tailed Student’s t-test comparing non-targeting gRNA (NT) condition. Genotyped variants are shown. c) Representative flow cytometry gating used for CRC-9 tumour organoids to assess HLA-A,B,C and B2M cell surface protein expression. Single, live cells with mApple (ABE) and BFP (gRNA) expression were gated for analysis. d) Co-competition flow cytometry assays of WT (GFP – NT gRNA expressing cells) and drug resistant CRC-9 tumour organoids (BFP – gRNA expressing) at 72 h. Data represent the mean ± SD of biological triplicates. ****P-value < 0.0001; ***P-value = 0.0001; **P-value = 0.0018; *P-value = 0.031; unpaired, two-tailed Student’s t-test comparing to non-targeting gRNA (NT) condition. Genotyped variants are shown. e) Co-culture assay of primary, autologous, anti-tumour T cells with CRC-9 tumour organoids harbouring different drug addiction variants. Cancer cells were pre-treated with the MEK inhibitor trametinib (25 nM) for 48 h before washing and plating the co-culture assay plate. Flow cytometry assessment of absolute cell numbers (measured by counting beads) following 72 h co-culture. Data are expressed as the percentage of live cells remaining as compared to the relevant condition in the absence of T cells and represent the mean ± SD of biological triplicates. ***P-value = 0.013, **P-value = 0.025, *P-value = 0.037; unpaired, two-tailed Student’s t-test. Genotyped variants are shown.
Extended Data Fig. 10
Extended Data Fig. 10. Next-generation sequencing of base edits across 45 variants modulating drug sensitivity.
a) Base editing efficiency and precision mapped across 45 endogenous loci in HT-29 CBE and ABE cells. Average VAFs for exact edits for hit gRNAs are shown for each variant from amplicon sequencing data that were absent in unedited samples. Dashed lines represent the predicted base editing activity window. Data represent the mean of two independent experiments performed on separate days. VAF, variant allele frequency. b) Editing efficiency and precision of CBE and ABE base editors are shown by amplicon sequencing of endogenous DNA loci. Base editing was performed by doxycycline-induced expression of ABE (top panel) or CBE (bottom panel) for three days. Rare transversion mutations and their sequence context within the gRNA are highlighted by a red box. VAF, variant allele frequency from amplicon sequencing and represent the mean of two independent experiments.

References

    1. Vasan, N., Baselga, J. & Hyman, D. M. A view on drug resistance in cancer. Nature575, 299–309 (2019). - PMC - PubMed
    1. Pao, W. et al. Acquired resistance of lung adenocarcinomas to gefitinib or erlotinib is associated with a second mutation in the EGFR kinase domain. PLoS Med.2, e73 (2005). - PMC - PubMed
    1. van de Haar, J. et al. Limited evolution of the actionable metastatic cancer genome under therapeutic pressure. Nat. Med.27, 1553–1563 (2021). - PubMed
    1. Cuella-Martin, R. et al. Functional interrogation of DNA damage response variants with base editing screens. Cell184, 1081–1097.e19 (2021). - PMC - PubMed
    1. Hanna, R. E. et al. Massively parallel assessment of human variants with base editor screens. Cell184, 1064–1080.e20 (2021). - PubMed

MeSH terms

LinkOut - more resources