. 2024 Dec;25(12):5383-5407.
doi: 10.1038/s44319-024-00278-4. Epub 2024 Oct 18.

Glycogenesis and glyconeogenesis from glutamine, lactate and glycerol support human macrophage functions

Affiliations

Glycogenesis and glyconeogenesis from glutamine, lactate and glycerol support human macrophage functions

Najia Jeroundi et al. EMBO Rep. 2024 Dec.

Abstract

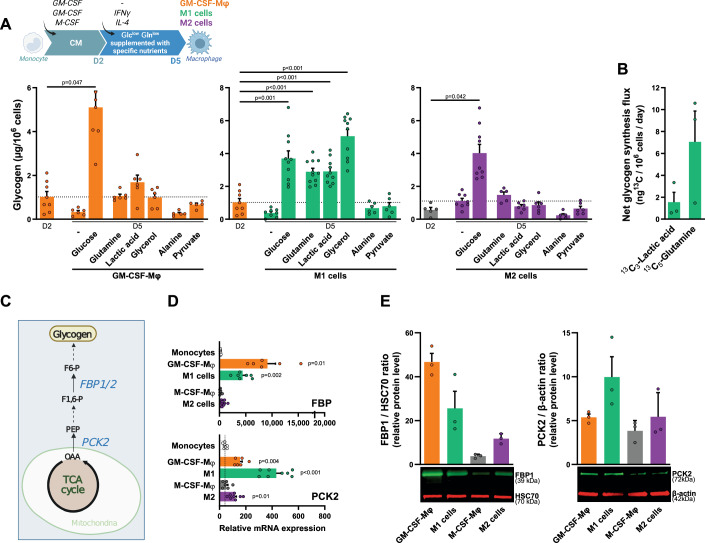
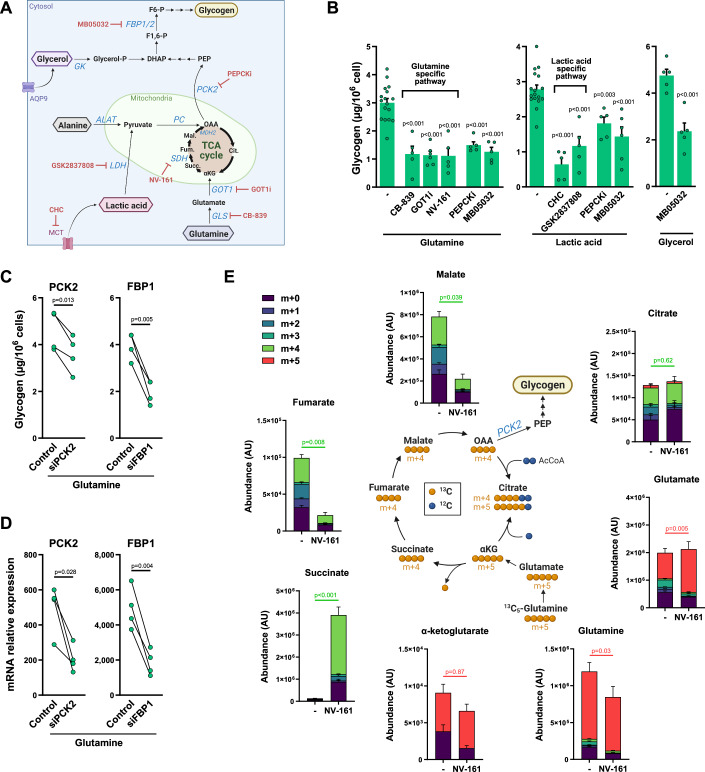
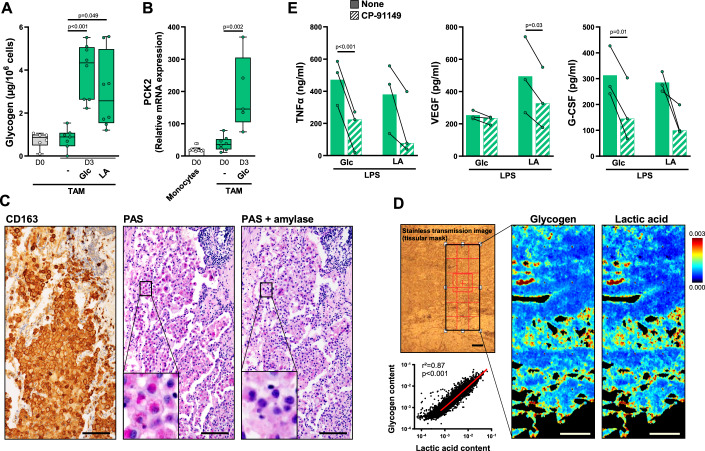
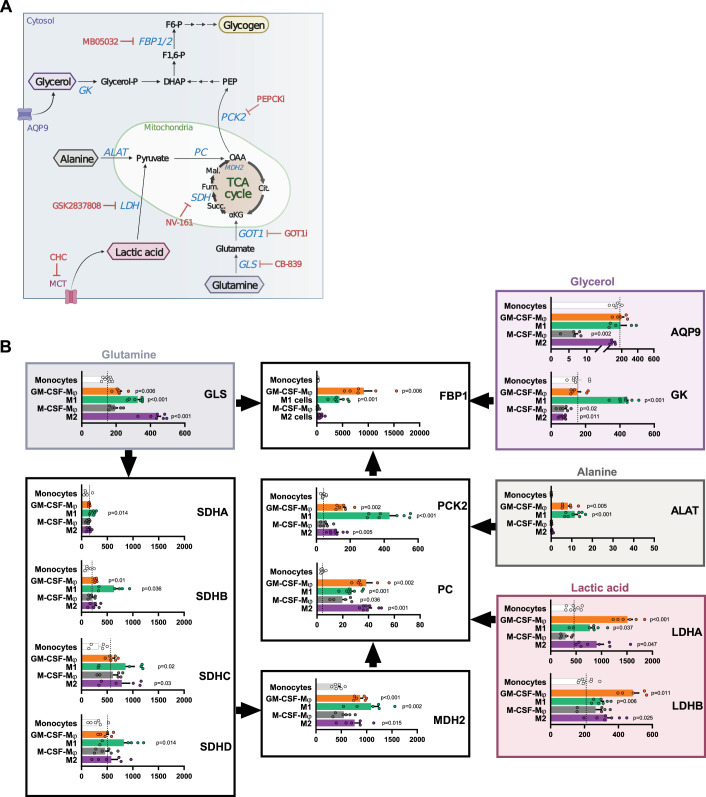
Macrophages fight infection and ensure tissue repair, often operating at nutrient-poor wound sites. We investigated the ability of human macrophages to metabolize glycogen. We observed that the cytokines GM-CSF and M-CSF plus IL-4 induced glycogenesis and the accumulation of glycogen by monocyte-derived macrophages. Glyconeogenesis occurs in cells cultured in the presence of the inflammatory cytokines GM-CSF and IFNγ (M1 cells), via phosphoenolpyruvate carboxykinase 2 (PCK2) and fructose-1,6-bisphosphatase 1 (FBP1). Enzyme inhibition with drugs or gene silencing techniques and 13C-tracing demonstrate that glutamine (metabolized by the TCA cycle), lactic acid, and glycerol were substrates of glyconeogenesis only in M1 cells. Tumor-associated macrophages (TAMs) also store glycogen and can perform glyconeogenesis. Finally, macrophage glycogenolysis and the pentose phosphate pathway (PPP) support cytokine secretion and phagocytosis regardless of the availability of extracellular glucose. Thus, glycogen metabolism supports the functions of human M1 and M2 cells, with inflammatory M1 cells displaying a possible dependence on glyconeogenesis.

Keywords: Cytokine secretion; Glycogenolysis; Glyconeogenesis; Macrophages; Phagocytosis.


Conflict of interest statement

Disclosure and competing interests statement. The authors declare no competing interests.

Figures

Figure 1
Figure 1. GM-CSF or M-CSF plus IL-4 triggers human macrophage glycogenesis.
Monocytes were differentiated into GM-CSF-Mφ, M1 cells (GM-CSF plus IFNγ added at day 2), M-CSF-Mφ or M2 cells (M-CSF plus IL-4 added at day 2) in complete medium (CM) (AE, I) or with a switch on day 2 to Glclow medium (F, G). Timelines summarize experimental procedures for Mφ generation. (A) Glycogen quantification in monocytes and in day 2 and day 5 Mφ (n = 6). (B) Day 2 M-CSF-Mφ were exposed to IL-4 (purple) or not (gray) for the last 3 days. Glycogen was quantified in monocytes (D0) and after 24 h (D3), 48 h (D4) and 72 h (D5) incubation without or with IL-4 (n = 5–8). (C) Left panels: monocytes and day 5 M1 and M2 cells were analyzed by light microscopy after PAS staining (upper panels; scale bar, 50 µm) or by confocal microscopy after 2 h incubation with 2-NBDG (middle and lower panels; scale bars, 40 and 2 µm). For fluorescent microscopy analysis, nuclei were counterstained with DAPI. Results are representative of 1 out of 3 (for 2-NBDG) or 5 (for PAS) different donors. Right panels: relative intensity of PAS staining and 2-NBDG fluorescence in monocytes and day 5 M1 and M2 cells (300 cells/donor were analyzed). (D) Day 2 GM-CSF- or M-CSF-Mφ were exposed or not to IFNγ, IL-1β, IL-10 or IL-4. Glycogen was quantified at day 5 (n = 6–10). (E) Glucose consumption in the day 2 and 5 supernatants of GM-CSF-Mφ and M2 cells (n = 5). (F) Glycogen was quantified in GM-CSF-Mφ and M2 cells cultured in CM or Glclow medium (n = 6–9). (G) Monocytes were differentiated into GM-CSF-Mφ and M2 cells in CM with a switch on day 2 to Glclow medium supplemented with 13C6-Glc. Glycogen was purified at day 5 and hydrolyzed to monomers before GC-MS analysis (n = 5). (H) Overview of enzymes involved in glycogenesis. (I) Relative mRNA expression of GYS1, GYG1, PGM1/2, and UGP2 determined by RT-qPCR in monocytes and day 5 GM-CSF-Mφ and M2 cells (n = 6). Values are represented as the mean ± SEM, each dot represents a different donor. Statistical significance was determined by Welch’s ANOVA test followed by Dunnett’s multiple comparison post hoc test (A, D, F, I) or by two-tailed unpaired Welch t test (B, C, E). *P < 0.01, **P < 0.005, ***P < 0.001, ****P < 0.0001. Source data are available online for this figure.
Figure 2
Figure 2. The combination of GM-CSF plus IFNγ promotes human macrophage glyconeogenesis.
Timelines summarize experimental procedures for macrophage generation. (A) Monocytes were differentiated into GM-CSF-Mφ, M1 or M2 cells in CM, with a switch on day 2 to Glclow Glnlow medium supplemented or not with nutrients (Glc, Gln, lactic acid, glycerol, Ala, pyruvate). Glycogen was quantified on day 2 and day 5 Mφ (n = 5–10). (B) Monocytes were differentiated into M1 cells as in (A) in a medium supplemented with 13C3-lactic acid or 13C5-Gln. At day 5, glycogen was purified and hydrolyzed to Glc before GC-MS analysis (n = 3). (C) Schematic diagram of the enzymatic pathways involving PCK2 and FBP1 enzymes in glyconeogenesis. (D) PCK2 and FBP1 mRNA expression determined by RT-qPCR in monocytes and day 5 Mφ (n = 5–8). (E) Protein expression of PCK2 and FBP1 in day 5 Mφ. Results are expressed as FBP1/HSC70 and PCK2/β-actin band intensity ratios (representative western blots are shown from three independent experiments). Values are represented as the mean ± SEM (n = 3), each dot represents a different donor. Statistical significance was determined by Welch’s ANOVA test followed by Dunnett’s multiple comparison post hoc test. The P values in (D) represent the comparison between monocytes and macrophages. *P < 0.01, **P < 0.005, ***P < 0.001, ****P < 0.0001. Source data are available online for this figure.
Figure 3
Figure 3. M1 cells glyconeogenesis pathways.
(A) Main metabolites and enzymatic pathways involved in glyconeogenesis. Specific inhibitors used in this study are in red. (B) Glycogen content in day 5 M1 cells generated as described in Fig. 2A in culture medium supplemented with Gln, lactic acid or glycerol, in the absence or presence of enzyme inhibitors (n = 5–16). (C, D) Day 2 GM-CSF-Mφ were switched to Glclow Glnlow medium containing GM-CSF, IFNγ and PCK2-targeting or FBP1-targeting siRNA, or a control siRNA. Gln was added 2 days later. Glycogen quantification (C) and relative mRNA expression (D) were measured at day 7 (n = 4). (E) Day 2 GM-CSF-Mφ were switched to Glclow Glnlow medium containing GM-CSF and IFNγ. At day 3, cells were treated or not with the SDH inhibitor NV-161 and supplemented with 13C5-Gln for 30 min. The relative abundance of 13C-metabolites was determined by LC-MS. Results are expressed as relative abundance of each metabolite generated after Gln metabolism (arbitrary unit or AU). Values are represented as the mean ± SEM (n = 8); each dot represents a different donor. Statistical significance was determined by Welch’s ANOVA test followed by Dunnett’s multiple comparison post hoc test (B), or by two-tailed paired t test (CE). The P values in (B) represent the comparison between each inhibitor and the control without inhibitor. *P < 0.01, **P < 0.005, ***P < 0.001, ****P < 0.0001. Source data are available online for this figure.
Figure 4
Figure 4. Tumor-associated macrophages store glycogen and are capable of glyconeogenesis.
(A, B) TAM isolated from ovarian cancer ascites were cultured in Glclow Glnlow medium containing GM-CSF and IFNγ supplemented with Glc or lactic acid. Glycogen (A; n = 6–8) and relative mRNA expression of PCK2 (B; n = 5–13) were quantified in freshly purified TAM and after 3 days of culture. The boxplots display a median line, interquartile range (IQR) boxes, min to max whiskers. (C) Immunohistochemical analysis of CD163 expression in lung adenocarcinoma. On the same tissue section, glycogen was detected by PAS staining, after treatment or not with amylase; scale bar, 100 µm. (D) Lactic acid and glycogen quantification by FTIR spectroscopic imaging in lung adenocarcinoma. Left panel: unstained bright field image; right panel, glycogen and lactic acid maps; scale bar, 200 µm; linear correlation between lactic acid and glycogen contents in infiltrating lung adenocarcinoma was calculated (results are representative 1 out of 2 biologically independent experiments). (E) Day 3 TAM were treated or not with CP-91149 for 15 min before a 6 h stimulation with LPS. TNFα, VEGF and G-CSF were quantified by ELISA (n = 3). Values are represented as the mean ± SEM, each dot represents a different donor. Statistical significance was determined by Welch’s ANOVA test followed by Dunnett’s multiple comparison post hoc test (A), or by two-tailed unpaired Welch t test (B) or by paired t test (E). *P < 0.01, **P < 0.005, ***P < 0.001, ****P < 0.0001. Source data are available online for this figure.
Figure 5
Figure 5. Activated M1 and M2 cells catabolize glycogen.
(A) Experimental procedure for LPS-stimulated macrophages. Glycogen was quantified in day 5 M1 and M2 cells treated or not with CP-91149 or 6AN, 15 min before 6 h LPS stimulation (n = 5–16). (B) Overview of the three glucose metabolic pathways (pyruvate synthesis, glycogen metabolism, pentose phosphate pathway or PPP). The targets of the inhibitors CP-91149 and 6AN are indicated. (C) PYGL, PYGB, PYGM and G6PD mRNA expression was determined by RT-qPCR in monocytes and day 5 Mφ (n = 5–8). (D) PYGL expression was analyzed by western blotting in monocytes and day 5 macrophages, with actin as loading control (lower, representative of one out of 3). Values are represented as the mean ± SEM (n = 3), each dot represents a different donor. Statistical significance was determined by Welch’s ANOVA test followed by Dunnett’s multiple comparison post hoc test. *P < 0.01, **P < 0.005, ***P < 0.001, ****P < 0.0001. Source data are available online for this figure.
Figure 6
Figure 6. Glycogen sustains M1 and M2 cell functions.
(A) Day 5 M1 cells were cultured in CM or in Glclow medium and treated or not with CP-91149 or 6AN, 15 min before LPS stimulation. Cytokines were quantified by ELISA in the M1 cells culture supernatants after 2 h (TNFα and IL-6), 6 h (IL-1β) or 24 h (IL-12p70) activation with LPS (n = 5–14). (B, C) Day 2 GM-CSF-Mφ were incubated either with siRNA targeting PYGL, PYGB, G6PD or a control siRNA. Cells were then stimulated with LPS at day 5, and cytokines were quantified by ELISA in M1 cell culture supernatants after 2 h (TNFα) or 6 h (IL-1β) (B) PYGL, PYGB and G6PD mRNA expression were determined by RT-qPCR in day 5 macrophages (n = 4) (C). (D) Day 5 M2 cells were cultured in CM or in Glclow medium and treated or not with CP-91149, 15 min before LPS stimulation. Cytokines were quantified by ELISA in the M2 cells culture supernatants after 2 h (IL-6), 6 h (IL-10) activation with LPS (n = 5–14). Phagocytosis was assessed by flow cytometry after 3 h LPS stimulation (n = 6). (E, F) Lactate was quantified in 6 h LPS-stimulated M1 (E) and M2 (F) cells culture supernatants and oxygen consumption rate (OCR) of M1 and M2 cells was monitored after 2 h (n = 4–6). Values are represented as the mean ± SEM, each dot represents a different donor. Statistical significance was determined by Welch’s ANOVA test followed by Dunnett’s multiple comparison post hoc test or two-tailed unpaired Welch t test for phagocytosis assay in (D). *P < 0.01, **P < 0.005, ***P < 0.001, ****P < 0.0001. Source data are available online for this figure.
Figure 7
Figure 7. Glycogen metabolism supports human macrophage functions.
The combination of M-CSF + IL-4 (M2) and the presence of GM-CSF triggers glycogen synthesis from glucose (glycogenesis). The concomitant presence of the inflammatory cytokines GM-CSF and IFNy appears unique to promote glycogen synthesis from Gln, LA or glycerol (glyconeogenesis). Glycogen stores are then channeled through glycogenolysis and further PPP to support cytokine secretion and phagocytosis by human macrophages.
Figure EV1
Figure EV1. GM-CSF or M-CSF plus IL-4 triggers human macrophage glycogenesis.
(A, B) Phenotypic characterization of M1 and M2 cells. M1 and M2 cells were generated either in conventional medium (CM) for 5 days or in CM for the first two days followed by 3 days culture in Glclow Glnlow medium up to day 5. (A) The M1 versus M2 phenotype was analyzed by flow cytometry using BUV395-labeled anti-CD14, BV421-labeled anti-CD163, BV510-labeled anti-CD40, FITC-labeled anti-CD80, PE-cy7-labeled anti-CD86 and APC-labeled anti-HLA-DR mAbs (all from BD Biosciences). Results are expressed as relative fluorescence intensity (RFI) (n = 7). (B) Representative flow cytometry histograms. Gray histograms represent isotype controls, dashed lines and solid lines represent cells generated in CM and Glclow Glnlow medium, respectively. (C) Isotopic patterns in Glc from glycogen show the prevalence of fully labeled isotopologues. Two typical fragments of 1-methoxy-penta-trimethylsilyl glucose (Glc 1MeOX, 5TMS) glucose are shown: (upper panel) isotopic pattern of the fragment at m/z 160.0794 a.m.u. corresponding to C-atom positions C1-C2, (lower panel) isotopic pattern of the fragment at m/z 319.15809 a.m.u. corresponding to C-atom positions C3 to C6. Peaks are labeled with the mass difference with respect to the monoisotopic (12C) form. Note that due to the 13C enrichment, Si isotopologues (29Si and 30Si at natural abundance) of the glucose derivative are small and thus not visible on this scale. (D) GYS1 expression was analyzed by western blotting in monocytes, day 5 GM-CSF-Mφ, and M2 cells; actin was used as loading control (representative of one out of 3). Values are represented as the mean ± SEM, each dot represents a different donor. Statistical significance was determined by two-tailed unpaired Welch t test (A). Source data are available online for this figure.
Figure EV2
Figure EV2. The combination of GM-CSF plus IFNγ promotes human macrophage glyconeogenesis.
(AC) Impact of cytokines on Mφ glyconeogenesis. GM-CSF-Mφ and M-CSF-Mφ were switched on day 2 to Glclow Glnlow medium supplemented or not with the specific nutrients Glc, Gln, lactic acid or glycerol. The timelines summarize the experimental procedures for macrophage generation. (A) IL-1β, IL-10, IL-4, or IL-4 plus IFNγ were added or not during the differentiation and glycogen was quantified in day 5 Mφ (n = 4–15). (B) IL-1β, IL-10, IL-4 were added or not during the differentiation of GM-CSF-Mφ and PCK2 expression was determined by RT-qPCR (n = 4–8). (C) PCK1 and FBP2 expression was determined by RT-qPCR in monocytes, GM-CSF-Mφ and M1 cells. Liver cells were used as a positive control for PCK1 expression (n = 4). (D) M1 cells rely on glycogenesis and glyconeogenesis to synthesize glycogen. Glycogen content was determined in M1 cells cultured for 5 days in CM containing either 2 or 20 mM Gln, in the absence or presence of 10 µM PEPCKi (n = 5). Values are represented as the mean ± SEM, each dot represents a different donor. Statistical significance was determined by Welch’s ANOVA test followed by Dunnett’s multiple comparison post hoc test (A, B) or two-tailed unpaired Welch t test (C) or by paired t test (D). *P < 0.01, **P < 0.005, ***P < 0.001, ****P < 0.0001. Source data are available online for this figure.
Figure EV3
Figure EV3. Glyconeogenesis pathways.
(A) Main metabolites and enzymatic pathways involved in glyconeogenesis. Specific inhibitors used in this study are in red. (B) The expression of mRNA encoding enzymes involved in M1 glyconeogenesis (GLS, SDHA-D, FBP1, PCK2, PC, MDH2, AQP9, GK, ALAT and LDHA-B) was determined by RT-qPCR in monocytes and day 5 Mφ (n = 6–8). Values are represented as the mean ± SEM; each dot represents a different donor. Statistical significance was determined by Welch’s ANOVA test followed by Dunnett’s multiple comparison post hoc test. The P values represent the comparison between monocytes and macrophages. *P < 0.01, **P < 0.005, ***P < 0.001, ****P < 0.0001. Source data are available online for this figure.
Figure EV4
Figure EV4. Tumor-associated macrophages store glycogen and are capable of glyconeogenesis.
Immunohistochemical staining of TTF-1 in lung adenocarcinoma. Scale bar, 100 µm. Source data are available online for this figure.
Figure EV5
Figure EV5. Glycogen sustains M1 and M2 cell functions.
(A, B) Day 5 M1 and M2 cells (generated in conventional medium or CM) were treated or not for 15 min with 50 µM CP-91149 before stimulation with 100 ng/mL LPS or with E. coli at a multiplicity of infection of 10. (A) Glycogen was quantified after 24 h activation (n = 3). (B) Cytokines were quantified in the supernatants by ELISA after 24 h (IL-12p70) or 6 h (IL-10) stimulation (n = 5). (C) GM-CSF-Mφ were switched on day 2 to Glclow Glnlow medium supplemented or not with Gln, lactic acid or glycerol and treated or not with CP-91149 15 min before LPS stimulation. TNFα and IL-6 (2 h), or IL-12p70 (24 h) were quantified by ELISA in stimulated day 5 M1 cells culture supernatants (n = 6–8). (D) M2 cells were pretreated with 50 µM CP-91149 or 10 µM cytochalasin B (CytoB) for 15 min before addition of 0.2 mg/mL pHrodo-conjugated E. coli BioParticles for 2 h at 37 °C. Fluorescence was determined by flow cytometry and expressed in MFI values (n = 3). (E) G6PC1-3 mRNA expression was determined by RT-qPCR in monocytes and day 5 Mφ (n = 6). Liver cells were used as a positive control. Values are represented as the mean ± SEM, each dot represents a different donor. Statistical significance was determined by paired t test (A, B) or by two-tailed unpaired Welch t test (C, D). *P < 0.01, **P < 0.005, ***P < 0.001, ****P < 0.0001. Source data are available online for this figure.

References

    1. Adeva-Andany MM, González-Lucán M, Donapetry-García C, Fernández-Fernández C, Ameneiros-Rodríguez E (2016) Glycogen metabolism in humans. BBA Clin 5:85–100 - PMC - PubMed
    1. Anglin J et al (2018) Discovery and optimization of aspartate aminotransferase 1 inhibitors to target redox balance in pancreatic ductal adenocarcinoma. Bioorg Med Chem Lett 28(16):2675–2678 - PMC - PubMed
    1. Belal S, Goudenège D, Bocca C, Dumont F, Chao De La Barca JM, Desquiret-Dumas V, Gueguen N, Geffroy G, Benyahia R, Kane S et al (2022) Glutamate-induced deregulation of Krebs cycle in mitochondrial encephalopathy lactic acidosis syndrome stroke-like episodes (MELAS) syndrome is alleviated by ketone body exposure. Biomedicines 10:1665 - PMC - PubMed
    1. Bocca C, Kane MS, Veyrat-Durebex C, Chupin S, Alban J, Kouassi Nzoughet J, Le Mao M, Chao de la Barca JM, Amati-Bonneau P, Bonneau D et al (2018) The metabolomic bioenergetic signature of Opa1-disrupted mouse embryonic fibroblasts highlights aspartate deficiency. Sci Rep 8:1–11 - PMC - PubMed
    1. Bultot L, Guigas B, Von Wilamowitz-Moellendorff A, Maisin L, Vertommen D, Hussain N, Beullens M, Guinovart JJ, Foretz M, Viollet B et al (2012) AMP-activated protein kinase phosphorylates and inactivates liver glycogen synthase. Biochem J 443:193–203 - PubMed

MeSH terms

LinkOut - more resources