. 2024 Dec;25(12):2308-2319.
doi: 10.1038/s41590-024-01995-7. Epub 2024 Oct 18.

A SIRT7-dependent acetylation switch regulates early B cell differentiation and lineage commitment through Pax5

Affiliations

A SIRT7-dependent acetylation switch regulates early B cell differentiation and lineage commitment through Pax5

Andres Gamez-Garcia et al. Nat Immunol. 2024 Dec.

Abstract

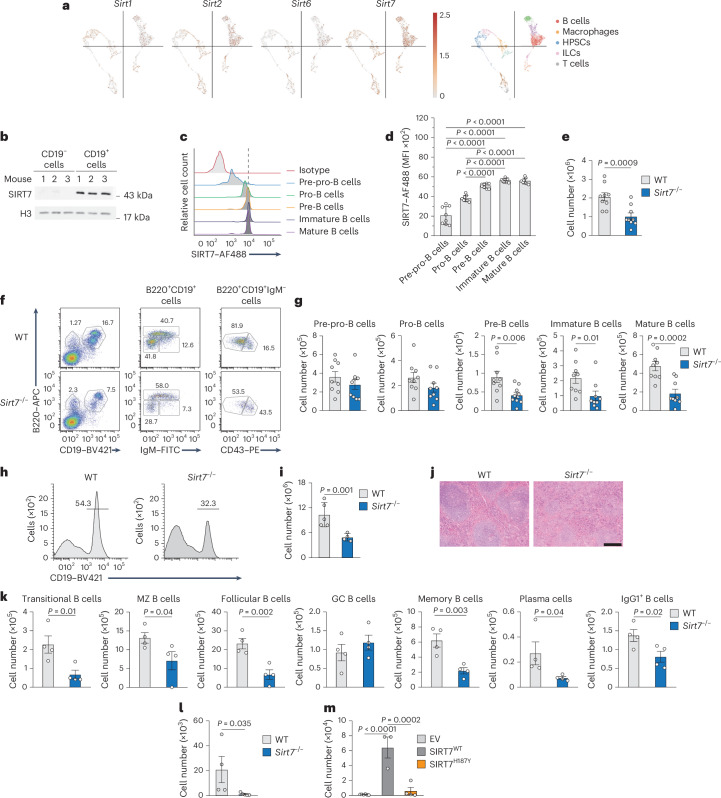
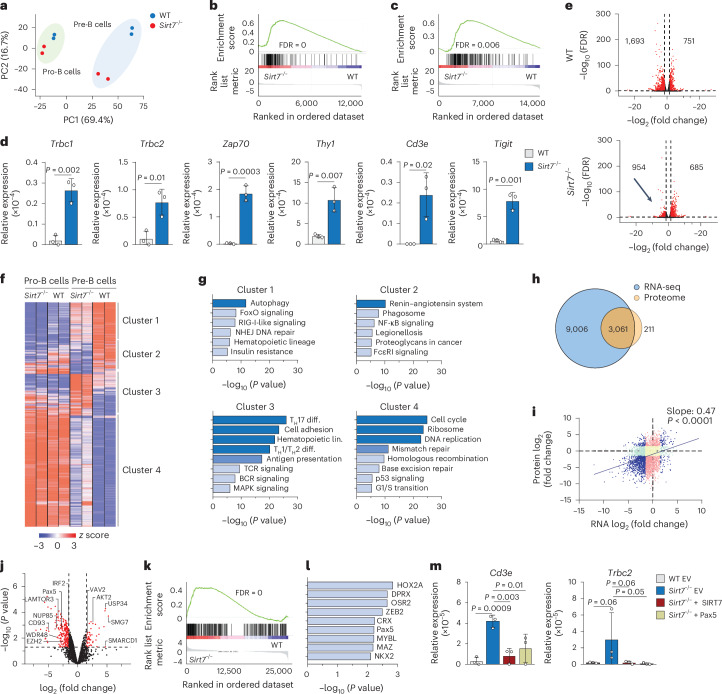
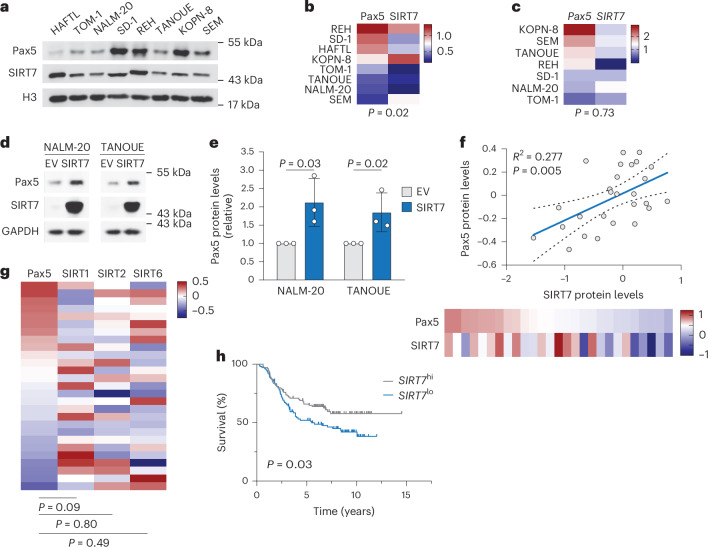
B lymphopoiesis is orchestrated by lineage-specific transcription factors. In B cell progenitors, lineage commitment is mediated by Pax5, which is commonly mutated in B cell acute lymphoblastic leukemia. Despite its essential role in immunity, the mechanisms regulating Pax5 function remain largely unknown. Here, we found that the NAD+-dependent enzyme SIRT7 coordinates B cell development through deacetylation of Pax5 at K198, which promotes Pax5 protein stability and transcriptional activity. Neither Pax5K198 deacetylated nor acetylated mimics rescued B cell differentiation in Pax5-/- pro-B cells, suggesting that B cell development requires Pax5 dynamic deacetylation. The Pax5K198 deacetylation mimic restored lineage commitment in Pax5-/- pro-B cells and B cell differentiation in Sirt7-/- pro-B cells, suggesting the uncoupling of differentiation from lineage commitment. The SIRT7-Pax5 interplay was conserved in B cell acute lymphoblastic leukemia, where SIRT7 expression correlated with good prognosis. Our findings reveal a crucial mechanism for B lymphopoiesis and highlight the relevance of sirtuins in immune function.


Conflict of interest statement

Competing interests: The authors declare no competing interests.

Figures

Fig. 1
Fig. 1. SIRT7 is required for normal B cell development.
a, t-Distributed stochastic neighbor embedding plots displaying the single-cell expression profiles of nuclear sirtuins in purified mouse BM Lin cells (left) and scRNA-seq feature plot (right) identifying B cells, macrophages, hematopoietic and progenitor stem cells (HPSCs), innate lymphoid cells (ILCs) and T cells. Data were obtained from singlecell.broadinstitute.org (study SCP978). b, Immunoblot of SIRT7 expression in mouse BM CD19 cells and CD19+ B cells (n = 3). c,d, Representative histograms (c) and quantification of SIRT7 median fluorescence intensity (MFI; d) in B220+CD19 pre-pro-B cells, B220+CD19+IgMCD43+ pro-B cells, B220+CD19+IgMCD43 pre-B cells, B220+CD19+IgM+ immature B cells and B220hiCD19+ mature B cells measured by intracellular flow cytometry (n = 8 mice). e, Total number of B220+CD19+ B cells in the BM of wild-type and Sirt7Δ4–10 129Sv mice (n = 9). Data were pooled from four independent experiments. f,g, Representative histograms (f) and numbers (g) of pre-pro-B cell, pro-B cell, pre-B cell, immature B cell and mature B cell populations identified as in c in the BM of 129Sv wild-type and Sirt7Δ4–10 mice (n = 9). Data were pooled from four independent experiments. h,i, Representative histograms (h) and numbers (i) of splenic CD19+ B cells from wild-type (n = 5) and Sirt7−/− (n = 4) mice. j, Hematoxylin and eosin staining of histological sections from the spleens of wild-type and Sirt7−/− mice (n = 5); scale bar, 500 µm. k, Number of splenic B220+CD19+CD21+CD23+CD93+ transitional B cells, B220+CD19+CD21hiCD23 marginal zone (MZ) B cells, B220+CD19+CD21+CD23+CD93 follicular B cells, B220+CD19+IgM+Gl7+Fas+ germinal center (GC) B cells, B220+IgG1+ class-switched B cells and BM CD19+CD38+CD138Gl7 memory B cells and B220loCD138+ plasma cells from wild-type and Sirt7−/− mice (n = 4). l,m, Numbers of donor-derived CD45.1CD45.2+CD19+ B cells in the spleens of recipient CD45.1/CD45.2 mice 4 weeks after congenic transplantation of either CD45.2 wild-type (n = 4) or Sirt7−/− (n = 5) LinB220+CD19+IgM pro-B cells expanded ex vivo with OP9 cells and 10 ng ml–1 IL-7, SCF and FLT3-L (l) or Sirt7−/− LinB220+CD19+IgM pro-B cells retrovirally expressing empty vector (EV; n = 6), SIRT7WT (n = 3) or SIRT7H187Y (n = 4; m). Data are presented as mean ± s.d. (d, i, and km) or mean ± s.e.m. (e, g, l and m) and were analyzed by one-tailed t-test (e, g, i, k and l) or one-way analysis of variance (ANOVA) with Sidak multiple comparisons (d and m). Source data
Fig. 2
Fig. 2. SIRT7 regulates Pax5 in B cell progenitors.
a, PCA clustering of B220+CD19+IgMCD43+ pro-B cells and B220+CD19+IgMCD43 pre-B cells sorted from the BM of wild-type and Sirt7−/− 129Sv mice based on the top 2,000 differentially expressed genes (n = 2); PC, principal component. b,c, GSEA of the ‘Travaglini lung proliferating NK T cell’ (b) and ‘Hallmark E2F targets’ (c) gene sets in Sirt7−/− versus in wild-type B220+CD19+IgMCD43 pre-B cells. d, RT–qPCR of Trbc1, Trbc2, Zap70, Thy1, Cd3e and Tigit expression relative to Hprt (n = 3). e, Volcano plot of differentially expressed genes in pre-B cells versus in pro-B cells (defined as in a) from wild-type (top) and Sirt7−/− (bottom) mice. Numbers on the right and left represent significantly induced or repressed genes, respectively. The black arrow indicates the lack of downregulated genes. Red dots represent significantly regulated genes (| log2 (fold change) | > 1.5, FDR < 0.05). f, Unsupervised clustering of the top 2,000 differentially expressed genes (P < 0.03) in wild-type and Sirt7−/− pro-B and pre-B cells defined as in a. g, Gene Ontology analyses of genes in clusters 1–4. Only terms with a –log10 (P value) of >5 are reported; NHEJ, nonhomologous end joining; TH17 diff., differentiation of IL-17-producing helper T cells; lin., lineage; TH1/TH2 diff., differentiation of type 1 helper T/type 2 helper T cells; TCR, T cell antigen receptor; BCR, B cell receptor. h,i, Venn diagram displaying the number of detected proteins and transcripts (h) and scatter plot (i) showing the linear correlation between the mean log2 (fold change) in protein expression and their corresponding transcript levels in wild-type B220+CD19+IgMCD43 pre-B cells, as determined by proteomics and RNA-seq, respectively. i, Changes in protein and RNA levels with a | log2 (fold change) | of ≥1.5 (blue), changes in protein levels only (light red), changes in RNA levels only (light green) and changes of | log2 (fold change) | ≤1.5 (yellow) are shown. Fold change values were calculated relative to Nup50 expression. The Spearman correlation slope = 0.47; P < 0.0001 between protein and transcript pairs. j, Volcano plot of differentially expressed proteins in sorted Sirt7−/− versus wild-type B220+CD19+IgMCD43 pre-B cells. Red dots indicate | log2 (fold change) | of ≥1.5 and a P value of <0.05. k, GSEA of Sirt7−/− versus wild-type B220+CD19+IgMCD43 pre-B cells compared to Pax5 target genes. l, HOMER de novo motif enrichment analysis showing nine of the top transcription factors enriched in cluster 3 genes. Motif enrichment was performed on promoter regions (transcription start site to 2,000 bp upstream). m, RT–qPCR of Cd3e and Trcb2 relative to Hprt in wild-type or Sirt7−/− B220+CD19+IgM pro-B cells retrovirally expressing empty vector, SIRT7 or Pax5 (n = 3). Data are shown as mean ± s.d. (d and m) and were analyzed by one-tailed t-test (i), two-tailed t-test (d) or one-way ANOVA with Fisher’s least significant different (LSD) test (m). Source data
Fig. 3
Fig. 3. SIRT7 regulates Pax5 stability by deacetylating K198.
a, Pax5 MFI measured by intracellular flow cytometry of B220+CD19+IgMCD43+ pro-B and B220+CD19+IgMCD43 pre-B cells from the BM of wild-type (n = 6) and Sirt7−/− (n = 8) mice. Data were pooled from three independent experiments. b, Immunoblot of Pax5 protein in wild-type and Sirt7−/− B220+CD19+IgM pro-B cells expanded ex vivo for 4 days with OP9 cells and 10 ng ml–1 IL-7, SCF and FLT3-L. c, RT–qPCR analysis of Pax5 gene expression in wild-type and Sirt7−/− pro-B cells expanded as in b (n = 3). d, Immunoblot of Pax5 and SIRT7 protein in wild-type and Sirt7−/− B220+CD19+IgM pro-B cells retrovirally transduced with empty vector and SIRT7. e, Quantification of Pax5 protein expression in wild-type and CRISPR–Cas9-generated HAFTLSIRT7KO cells treated with vehicle (Ct) or 2 µM lactacystin for 8 h (n = 3 biological replicates). f,g, Time course immunoblot (f) and Pax5/H3 ratio (g) in HAFTL (n = 6 independent time courses) and HAFTLSIRT7KO (n = 8 independent time courses) cells treated with 100 μg ml–1 cycloheximide for 3, 6, 9 and 24 h. Nonlinear fits with variable slope (four parameters) are depicted. h, Flag-specific coimmunoprecipitation from HAFTL cells retrovirally transduced with empty vector or SIRT7–Flag, followed by Pax5 and SIRT7 immunoblotting; IP, immunoprecipitate. i, Immunoblot of Pax5 and SIRT7 in the input and gel filtration chromatography fractions in HAFTL cells. Approximate molecular weights are shown. Red brackets indicate fractions in which Pax5 and SIRT7 coelute. j, Immunoblot of Pax5 protein in HAFTL and KOPN-8 cells treated with vehicle (–) or 5 mM nicotinamide (NAM) for 48 h. k, Pan-acetyl-lysine (AcK) immunoblotting of in vitro deacetylation assays with purified Pax5 alone, with SIRT7 or SIRT7 and NAD+. l, Fragmentation MS/MS spectra of the KacRDEGIQ(+.98)ESPVPNGHSLPGR peptide, as determined by proteomic analysis of Pax5 protein immunoprecipitated from SIRT7−/− HEK293F cells transiently expressing Pax5 and empty vector (left) or Pax5 and SIRT7 (right) by polyethylenimine transfection. m, Schematic of mouse Pax5 functional domains; PRD, paired box domain; OP, octapeptide domain; HD, partial homeodomain; TAD, transactivation domain; ID, inhibitory domain. The start and end of each domain and the detected acetyl-lysine residues are indicated. n, Conservation of Pax5 186–229 peptide in Mus musculus, Homo sapiens, Gallus gallus, Danio rerio and Xenopus laevis. K198 is shown in red. o, Expression of Pax5WT and Pax5K198Q and Pax5K198R mutants expressed in HEK293F cells as in l. p, Ubiquitination of Flag-purified Pax5WT and Pax5K198Q and Pax5K198R mutants in HEK293F cells coexpressing HA–ubiquitin (HA–Ub) as in l. q, Expression of Pax5WT, Pax5K198Q and Pax5K198R in HEK293F cells treated as in g (n = 4). r, Scatter plot of the correlation between Pax5 and PCAF protein in individuals with B-ALL, as determined by proteomics. Linear regression and 95% confidence intervals (dashed lines) are shown (n = 27, P = 0.02). s, Pax5 expression (left; pooled from three independent experiments) and Pax5 acetylation (right; Ack/Pax5, pooled from four (Pax5WT) and three (Pax5K198R) independent experiments) in HEK293F cells expressing Pax5WT or Pax5K198R together with empty vector, p300, PCAF, NCOA3 or GTF3C4. Data are shown as mean ± s.d. (a, c, e, g, q and s) and were analyzed by two-tailed t-tests with a Holm–Sidak comparison (a), one-tailed t-test (e and r), two-way ANOVA with Sidak comparisons (g) or one-way ANOVA with Fisher’s LSD test (q and s). Source data
Fig. 4
Fig. 4. Pax5 K198 acetylation regulates gene expression.
a, ChIP–seq analysis showing the genomic occupancy of Pax5-WT, Pax5-K198Q and Pax5-K198R in Pax5−/− LinB220+IgM pro-B cells retrovirally transduced with Pax5WT, Pax5K198Q and Pax5K198R and expanded ex vivo for 7 days in OP9 cells and in the presence of 10 ng ml–1 IL-7, SCF and FLT3-L. One thousand random significant peaks are displayed. Top, read coverage profiles. b, Venn diagram of the overlap between the significant peaks (q < 0.05) detected by ChIP–seq of Pax5WT, Pax5K198Q and Pax5K198R forms. c, Binding of Pax5WT, Pax5K198Q and Pax5K198R in the Actr6 (top) and Nus1 regions (bottom). The y axis represents read coverage. d, PCA clustering of RNA-seq data from Pax5−/− LinB220+IgM pro-B cells retrovirally transduced with empty vector, Pax5WT, Pax5K198Q and Pax5K198R. e, Unsupervised clustering of differentially expressed genes (FDR < 0.05) in Pax5−/− LinB220+IgM pro-B cells retrovirally transduced with empty vector, Pax5WT, Pax5K198Q and Pax5K198R as in d. Significant Gene Ontology terms for clusters C1 and C2 are shown. f, Volcano plots of differentially expressed genes in Pax5−/− LinB220+IgM pro-B cells retrovirally transduced with Pax5WT, Pax5K198Q and Pax5K198R versus empty vector. The black arrow indicates the absence of downregulated genes; significantly regulated genes (| log2 (fold change) | ≥ 1.5, FDR < 0.05) are shown in red. Numbers on the right and left show the number of genes significantly induced and repressed, respectively; FC, fold change; Fr. A, fraction A. g, ChIP–seq of Pax5WT, Pax5K198Q and Pax5K198R forms and RNA-seq of Pax5−/− LinB220+IgM pro-B cells retrovirally expressing empty vector, Pax5WT, Pax5K198Q or Pax5K198R in Mycn (top) and Rag1 (bottom) genes. The y axis represents read coverage.
Fig. 5
Fig. 5. Pax5 K198 deacetylation regulates B cell identity.
a,b, Number of donor-derived CD45.2+CD19+B220+ cells in the BM (a) and percentages of donor-derived CD45.2+CD4+ cells (left) and CD45.2+CD8+ (right) cells in the thymus (b) of CD45.1 wild-type recipient mice 4 weeks after transplantation of LinB220+IgM Pax5−/− pro-B cells retrovirally transduced with empty vector, Pax5WT, Pax5K198Q or Pax5K198R (empty vector, n = 3; Pax5WT, n = 3; Pax5K198Q, n = 3; Pax5K198R, n = 4). Data are presented as mean ± s.e.m. and were analyzed by one-way ANOVA with Fisher’s LSD test. ce, Representative flow cytometry plots (c) and percentages of donor-derived CD45.1CD45.2+CD19+ and CD45.1CD45.2+CD19 cells (d) and donor-derived CD45.1CD45.2+TCRβ+ and CD45.1CD45.2+NKP46+ cells (e) in the spleens of CD45.1/CD45.2 recipient mice injected with CD45.2 wild-type (n = 4) or Sirt7−/− (n = 5) LinB220+CD19+IgM pro-B cells. Data are presented as mean ± s.d. (d) or mean ± s.e.m. (e) and were analyzed by two-way ANOVA with Fisher’s LSD test (d) or multiple t-tests with Holm–Sidak comparisons (e). f, Number of donor-derived B220+CD19+GFP+ B cells in the spleens of CD45.1/CD45.2 recipient mice injected with wild-type and Sirt7−/− LinB220+CD19+IgM pro-B cells expressing empty vector, Pax5WT and Pax5K198R retroviruses (wild-type + empty vector, n = 4; Sirt7−/− + empty vector, n = 3; Sirt7−/− + Pax5WT, n = 3; Sirt7−/− + Pax5K198R, n = 3). Data are presented as mean ± s.d. and were analyzed by one-way ANOVA with Fisher’s LSD test. g, Unsupervised clustering of the differentially expressed genes (P < 0.05) between wild-type and Sirt7−/− LinB220+CD19+IgM pro-B cells retrovirally transduced with empty vector, Pax5WT or Pax5K198R. Source data
Fig. 6
Fig. 6. The Pax5–SIRT7 interplay is conserved in human B-ALL.
a, Immunoblot of Pax5, SIRT7 and H3 in HAFTL, TOM-1, NALM-20, SD-1, REH, TANOUE, KOPN-8 and SEM cell lines. b,c, Heat map of the correlation between Pax5 and SIRT7 protein expression normalized to H3 expression (b) and Pax5 and Sirt7 RNA expression normalized to Hprt RNA expression (c) in B-ALL cell lines as in a. Mean z scores for the normalized protein (b) and mRNA (c) are shown. The P values were determined by Spearman’s rank correlation. Data were pooled from three (b) or two (c) experiments. d,e, Immunoblots of the levels of Pax5 and SIRT7 in NALM-20 and TANOUE B-ALL cells expressing empty vector and SIRT7 retroviruses (d) and quantification of the Pax5/GAPDH ratio (e). Data are shown as mean ± s.d. and were analyzed by one-tailed t-tests (n = 3 biological replicates). f, Scatter plot (top) and heat map (bottom, z score) of Pax5 and SIRT7 protein determined by proteomics in individuals with B-ALL (n = 27). Each point corresponds to one sample. Linear regression, 95% confidence intervals (dashed lines) and Spearman’s rank correlation coefficient (R2) are shown (P = 0.005, one-tailed t-test). g, Heat map of the correlation between the expression of Pax5, SIRT1, SIRT2 and SIRT6 in the same human B-ALL samples as in f. h, Kaplan–Meier survival curves for children with high-risk B-ALL from the COG-P9906 study, (n = 209) stratified as higher (SIRT7hi) or lower (SIRT7lo) than median SIRT7 RNA expression. Statistical significance was determined by a long-rank test (P value < 0.03). Source data
Extended Data Fig. 1
Extended Data Fig. 1. SIRT7 is upregulated in B cell progenitors.
a, Heatmap displaying the single-cell expression of Sirt1, Sirt2, Sirt6 and Sirt7 in the populations (B cells, innate lymphoid cells (ILCs), macrophages (Mac), hematopoietic and progenitor stem cells (HPSC) and T cells) annotated by sc-RNA-seq from purified murine BM Lin cells. Data was obtained from singlecell.broadinstitute.org (study SCP978). b,c, sc-RNA-seq feature plot (b) and single-cell expression of Sirt7 (c) in B cells, T cells, NK cells, plasma cells, dendritic cells, plasmacytoid dendritic cells, platelets and erythroid cells of human BM. Data was obtained from singlecell.broadinstitute.org (study SCP101). In panel c, only those cells with detectable counts are plotted, and the dashed lines indicate the median and the first and fourth quartiles. Statistical significance was assessed by one-way ANOVA with Dunnet comparison. d, Microarray expression of Sirt1 (top left), Sirt2 (top right), Sirt6 (bottom left) and Sirt7 (bottom right) in B lymphopoiesis stages (n = 3; common lymphoid progenitors (CLP), n = 2). Data are presented as mean ± s.d. A two-tailed t-test was performed comparing the expression in pooled CLP–pro-B and in pooled pre-B–plasma cells. Data were obtained from the Immgen consortium (GSE15907). e, RNA-Seq expression patterns of Sirt1, Sirt2, Sirt6 and Sirt7 in pro-B cells and pre-B cells. Data are presented as the mean of the two replicates (n = 2). f, Gating strategy defining B cell subsets (B220+CD19 pre-pro-B cells, B220+CD19+IgMCD43+ pro-B cells, B220+CD19+IgMCD43 pre-B cells, B220+CD19+IgM+ immature B cells and B220hiCD19+ mature B cells) for intracellular flow cytometry measurement of SIRT7 protein levels in fixed mouse BM. Source data
Extended Data Fig. 2
Extended Data Fig. 2. SIRT7 is required for normal B cell development.
a,b, Number of B220+CD19+ B cells (a) and percentages of B220+CD19pre-pro-B cells, B220+CD19+IgMCD43+ pro-B cells, B220+CD19+IgMCD43 pre-B cells and B220+CD19+IgM+ immature B cells (b) determined by flow cytometry in the BM of wild-type and Sirt7 Δ4-9 C57BL/6 mice. Data are presented as mean ± s.d. and significance was assessed by two-tailed t-test (wild-type, n = 5 (a) and 7 (b); Sirt7 Δ4-9, n = 9 (a) and 7 (b)). Pooled from two independent experiments. c-g, Representative FACS plots of splenic B220+CD19+CD21highCD23 marginal zone B cells, B220+CD19+CD21+CD23+CD93follicular B cells and B220+CD19+CD21+CD23+CD93+ transitional B cells. (c), B220+CD19+IgM+Gl7+Fas+ germinal center B cells (d), BM CD19+CD38+CD138Gl7+memory B cells (e), BM B220loCD138+plasma cells (f) and class-switched splenic B220+IgG1+ B cells (g) from wild-type and Sirt7−/− mice (n = 4). h, Levels of anti-HEL antibody isotypes in the sera of wild-type and Sirt7−/− mice 14 days after NP-HEL immunization, relative to naive mice, as determined by ELISA. Data are shown as in a (wild-type, n = 6; Sirt7−/−, n = 5). One of two separate experiments is shown. i, Gating strategy used to identify donor-derived CD45.1-CD45.2+CD19+ mature B cells in the spleen of recipient CD45.1/CD45.2 mice four weeks after transplantation of CD45.2 wild-type or Sirt7−/− LinB220+CD19+IgM pro-B cells. Source data
Extended Data Fig. 3
Extended Data Fig. 3. SIRT7 promotes B cell development independently of V(D)J.
a, Representative apoptosis FACS plots (top) and relative numbers (bottom) of 7AAD+Annexin V+ cells (gated on B220+CD19+IgMCD43+ pro-B and B220+CD19+IgMCD43 pre-B cells) in the BM of wild-type (n = 3) and Sirt7−/− (n = 4) mice. Data was normalized to wild-type values. b, Representative histograms (left) and quantification (right) of the percentages of cells in G1, S and G2/M cell cycle stages of gated wild-type and Sirt7−/− B220+CD19+IgMCD43FSChi large and B220+CD19+IgMCD43FSClo small pre-B cells, determined by intracellular flow cytometry (n = 4 mice). Pooled from two separate experiments. c, Representative histogram (left) and p-STAT5Y694 MFI (right) in gated wild-type and Sirt7−/− B220+CD19+IgMCD43 pre-B cells, measured by intracellular flow cytometry (n = 3 mice; p = 0.005). Pooled from three separate experiments d, Flow cytometric quantification of CD127 expression in gated B220+CD19+IgMCD43 pre-B cells from the BM of wild-type and Sirt7−/− mice (n = 5). Pooled from three separate experiments. e, Schematic representation of the mouse IgH locus, showing constant (C), joining (J), diversity (D) and variable (V) gene segment organization (top) and semi-quantitative genomic DNA PCR using degenerate primers targeting DHL-JH3 and VH-DJH gene segments in IgM+ B cells sorted from the BM of wild-type and Sirt7−/− mice. Mouse embryonic fibroblasts (MEFs) and H2O were used as negative controls of PCR amplification. The independent locus Kat8 was used as a loading control (n = 5 mice). f, Densitometric quantification of DHL-JH3, VHJ588-DJH3, VH7183-DJH3 and VHQ52-DJH3 gene segment amplification in the mouse IgH locus normalized to Kat8 in sorted splenic wild-type and Sirt7−/− IgM+ B cells (n = 5 mice). g, Representative flow cytometry plots (left) and number of B220+CD19+ B cells (right) in the BM of IgHEL−/− (n = 5) IgHEL−/−Sirt7−/− (n = 5), IgHEL+/- (n = 6) and IgHEL+/-Sirt7−/− (n = 6) mice. Data in a, b, c, d, f and g are shown as mean ± s.d. Data in a, c and f were analyzed using one-tailed t-test, and data in b and g were analyzed using two-way ANOVA with Sidak multiple comparisons. Source data
Extended Data Fig. 4
Extended Data Fig. 4. SIRT7 regulates Pax5 in B cell progenitors.
a, Pie charts showing the number and percentage of genes significantly induced and repressed (|log2(fold-change)| ≥ 1.5, FDR < 0.05) during the pre-B-to-pro-B cell transition in wild-type (left) and Sirt7−/− (right) mice (n = 2). b, Percentages of significantly regulated (|log2(fold change)| ≥ 1, FDR < 0.1) transcripts and proteins in Sirt7−/− vs wild-type B220+CD19+IgMCD43 pre-B cells, relative to all the transcripts and proteins detected by RNA-Seq and proteomics, respectively. c, Gene ontology analysis of significantly regulated proteins in Sirt7−/− vs wild-type B220+CD19+IgMCD43 pre-B cells. d, Percentage of Cluster 3 genes from wild-type and Sirt7−/− B220+CD19+IgMCD43 pre-B cell and B220+CD19+IgMCD43+ pro-B cell bulk RNA-Seq data with significant (q < 0.05) Pax5 peaks in their promoters only (±2Kb from TSS) (left panel) or in the whole gene (including ± 2Kb from TSS, gene bodies and 3’UTR, right panel).
Extended Data Fig. 5
Extended Data Fig. 5. SIRT7 regulates Pax5 stability by deacetylating K198.
a, Representative histograms of Pax5 expression in gated B220+CD19+IgMCD43+ pro-B and B220+CD19+IgMCD43 pre-B cells from the BM of wild-type and Sirt7−/− mice (wild-type, n = 6; Sirt7−/−, n = 8). Pooled from three separate experiments b, RNA-Seq analysis of Pax5 expression in sorted pro-B and pre-B cells defined as in a. Data are shown as mean of two replicates (n = 2). c, Pax5/GAPDH ratio in B220+CD19+IgMCD43+ pro-B cells retrovirally expressing empty vector (EV) and SIRT7 and expanded ex vivo for four days with OP9 cells and 10 ng/ml IL-7, SCF and FLT3-L (n = 3). Pooled from 3 separate experiments. d, Immunoblots of Pax5 and SIRT7 protein from wild-type and CRISPR-Cas9-generated HAFTLSIRT7KO pre-B cells treated with vehicle (Ct) or 2 µM lactacystin for 8 h. e, FLAG-specific immunoprecipitation from HEK293F cells transiently co-expressing SIRT7-HA with EV or Pax5-FLAG using polyethyleneimine transfection, followed by FLAG and HA immunoblotting. f, RT-qPCR analysis of Pax5 expression relative to Hprt in HAFTL cells treated with vehicle (Ct) or 5 mM nicotinamide (NAM) for 48 h (n = 3). g, Pax5/H3 ratio in HAFTL (n = 4 biological replicates; p < 0.0001) and KOPN-8 (n = 2 biological replicates) cells treated as in f. h,i, FLAG-tagged Pax5WT, Pax5K198Q and Pax5K198R levels (h, n = 3) and ubiquitination (i, n = 3). Expressed in HEK293F cells as in e. Pooled from three separate experiments. j,k, Immunoblots (j) and quantification (k) of Pax5WT, Pax5K198A and Pax5K198R forms expressed as in e. Data in k are pooled from three separate experiments. l, Relative levels of Pax5WT, Pax5K198A and Pax5K198R forms in HEK293F cells treated with vehicle (Ct) or 100 μg/mL cycloheximide (CHX) for 8 h (n = 3, pooled from three separate experiments). m, Subcellular fractionation of HEK293F cells expressing Pax5WT, Pax5K198Q and Pax5K198R forms as in e. GAPDH, Fibrillarin and H3; cytoplasmic, nuclear and chromatin controls. n, Venn diagram depicting the overlap between Pax5 proteinprotein interactions (PPIs) and mammalian histone acetyltransferases (HATs) (see methods). o, Scatter plots showing the correlation between the protein levels of Pax5, p300, NCOA3 and GTF3C4, as determined by proteomics in human B-ALL patients samples (n = 27). Each point corresponds to one sample. Linear regression and 95% confidence intervals (dashed lines) are shown. p-r, Immunoblots depicting the expression (p,q) and acetylation levels (r) of Pax5WT and Pax5K198R proteins from HEK293F transiently co-expressing Pax5WT or Pax5K198R together with p300, PCAF, NCOA3 or GTF3C4. Data in c, f, g, h, i and k are shown as mean ± sd. Data in c, h, I, k were analyzed using one-way ANOVA with Fisher’s LSD test, and data in g (HAFTL) were analyzed using two-tailed t-test. Source data
Extended Data Fig. 6
Extended Data Fig. 6. Pax5K198 acetylation regulates gene expression.
a, DNA binding motifs of Pax5WT, Pax5K198Q and Pax5K198R in Pax5−/− Lin-B220+IgMpro-B cells retrovirally transduced with Pax5WT, Pax5K198Q and Pax5K198R forms and expanded ex vivo for seven days with OP9 cells and 10 ng/ml IL-7, SCF and FLT3-L. b, Motif enrichment analysis of the significant peaks (q < 0.05) detected by ChIP-Seq of Pax5WT, Pax5K198Q and Pax5K198R as in a. c, Comparison of the significant peaks bound by Pax5K198R as in a and those reported in Ref. . d, Genomic occupancies of Pax5WT, Pax5K198Q and Pax5K198R forms in the unique Pax5K198R peaks. Top panels, read coverage profiles. e, Gene ontology terms of the unique Pax5K198R peaks. Only terms with -log10(p-value)>3 are reported. f, RNA-Seq analysis of the expression of Blnk, Irf4, Rag1, Il7r, Dusp4 and Mycn the indicated genes in LinB220+IgM Pax5−/− pro-B cells expressing an empty vector (EV), Pax5WT, Pax5K198Q and Pax5K198R and expanded as in a. Data are presented as mean (n = 2). g, ‘HALLMARK_E2F_TARGETS’ GSEA of RNA-seq data from Pax5WT versus EV (upper) pro-B cells and PAX5K198R versus EV (lower) pro-B cells. FDR, false discovery rate. Source data
Extended Data Fig. 7
Extended Data Fig. 7. Pax5K198 deacetylation regulates B cell identity.
a,b, Gating strategies used to identify CD45.2+B220+CD19+ B cells (a) or CD45.2+CD4+ and CD45.2+CD8+ T cells (b) derived from donor CD45.2 Pax5−/− LinB220+IgMpro-B cell expressing empty vector (EV), Pax5WT, Pax5K198Q and Pax5K198R by retroviral transduction in the bone marrow (a) or thymus (b) of CD45.1 recipient mice 4 weeks after transplantation. c, Representative histograms of the donor derived CD45.1-CD45.2+CD19+ B cells in the spleens of recipient CD45.1/CD45.2 mice 6 weeks after injection of wild-type or Sirt7−/− LinIgM+IgD+ splenic B cells. d) Gating strategy used to identify donor-derived B220+CD19+GFP+ B cells in the spleens of CD45.1/CD45.2 recipient mice four weeks after transplantation of ex vivo expanded (with OP9 cells and 10 ng/ml IL-7, SCF and FLT3-L, for 7 days) wild-type and Sirt7−/− LinB220+CD19+GFP+ pro-B cells retrovirally transduced with empty vector (EV, pMIG), Pax5WT or Pax5K198R. e, Gene ontology analysis of the genes in Clusters A, B and C generated by unsupervised clustering analysis of bulk RNA-seq data from the same cells as in d. Only terms with -log10(p-value) > 1.5 are reported.
Extended Data Fig. 8
Extended Data Fig. 8. The PAX5/SIRT7 interplay is conserved in human B-ALL.
a, Scatter plots of Pax5 and SIRT7 levels derived from proteomics (left panels) and RNA-Seq (right panels) of human B-ALL HeH (n = 18) and ETV6-RUNX1 (n = 9) patient samples. Each point corresponds to one sample. Linear regression and 95% confidence intervals (dashed lines) are shown in red. The p-values were calculated by one-tailed t-test. b, Heatmap showing the correlation between the protein levels of Pax5 and SIRT7 in B-CLL cell lines versus healthy donor B cells, as determined by proteomics. The p-values were determined by one-tailed t-test (p = 0.0016). c, Correlation between the protein levels of Pax5 and SIRT1, SIRT2 and SIRT6 in human B-ALL patient samples, as determined by proteomics (n = 27). Data are presented and analyzed as in a. d, Kaplan-Meier survival curves of children with high-risk B-ALL (COG-P9906 study), stratified into four groups based on higher- or lower-than-median SIRT7 RNA expression levels and the occurrence of PAX5 deletions. Statistical significance was determined by log-rank test (PAX5WTSIRT7hi, n = 14; PAX5WTSIRT7lo, n = 15; PAX5delSIRT7hi, n = 11; PAX5delSIRT7lo, n = 12). Source data

References

    1. Medvedovic, J., Ebert, A., Tagoh, H. & Busslinger, M. PAX5: a master regulator of B cell development and leukemogenesis. Adv. Immunol.111, 179–206 (2011). - PubMed
    1. Delogu, A. et al. Gene repression by PAX5 in B cells is essential for blood cell homeostasis and is reversed in plasma cells. Immunity24, 269–281 (2006). - PubMed
    1. Cobaleda, C., Schebesta, A., Delogu, A. & Busslinger, M. PAX5: the guardian of B cell identity and function. Nat. Immunol.8, 463–470 (2007). - PubMed
    1. Schebesta, A. et al. Transcription factor PAX5 activates the chromatin of key genes involved in B cell signaling, adhesion, migration, and immune function. Immunity27, 49–63 (2007). - PubMed
    1. Urbanek, P., Wang, Z. Q., Fetka, I., Wagner, E. F. & Busslinger, M. Complete block of early B cell differentiation and altered patterning of the posterior midbrain in mice lacking PAX5/BSAP. Cell79, 901–912 (1994). - PubMed

Grants and funding