. 2025 Jan;32(1):185-198.
doi: 10.1038/s41594-024-01411-6. Epub 2024 Oct 18.

Membrane structure-responsive lipid scrambling by TMEM63B to control plasma membrane lipid distribution

Affiliations

Membrane structure-responsive lipid scrambling by TMEM63B to control plasma membrane lipid distribution

Yugo Miyata et al. Nat Struct Mol Biol. 2025 Jan.

Abstract

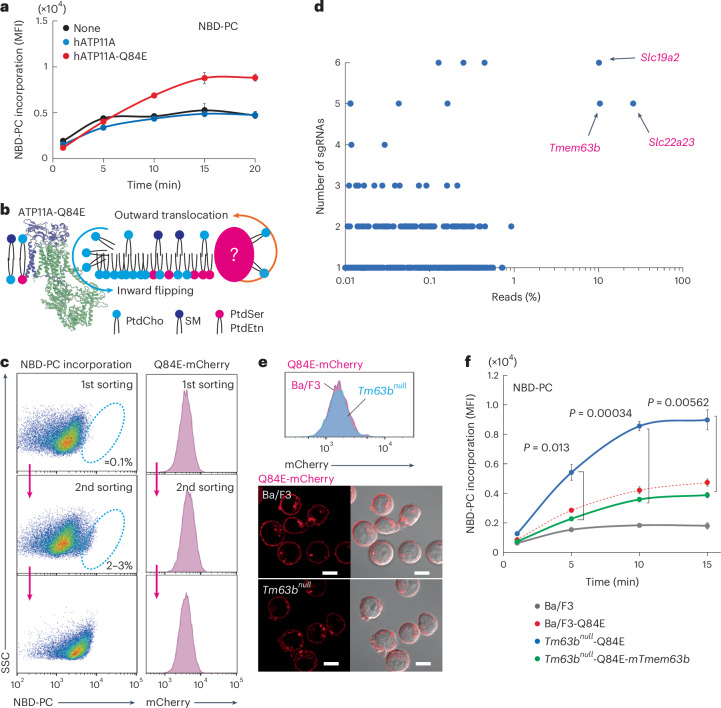
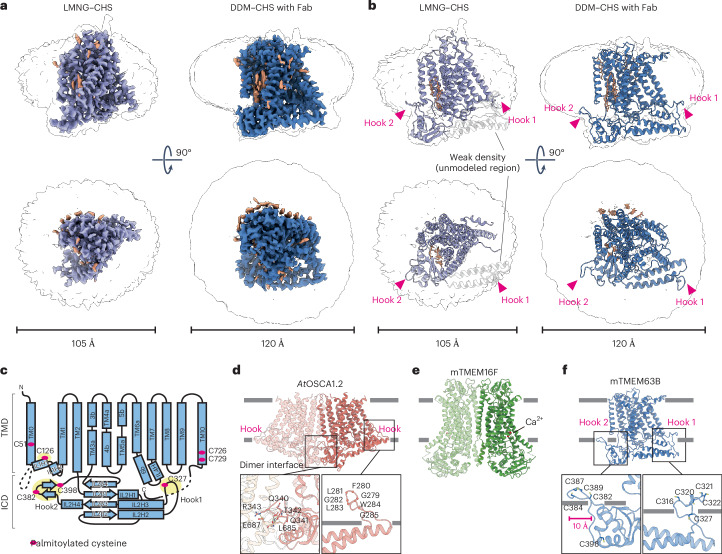
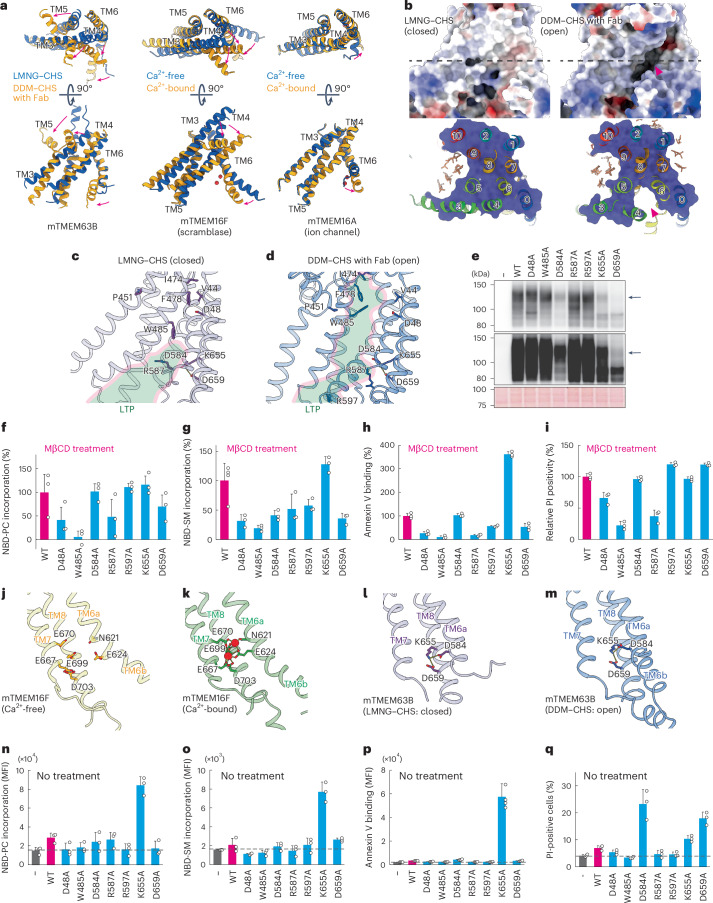
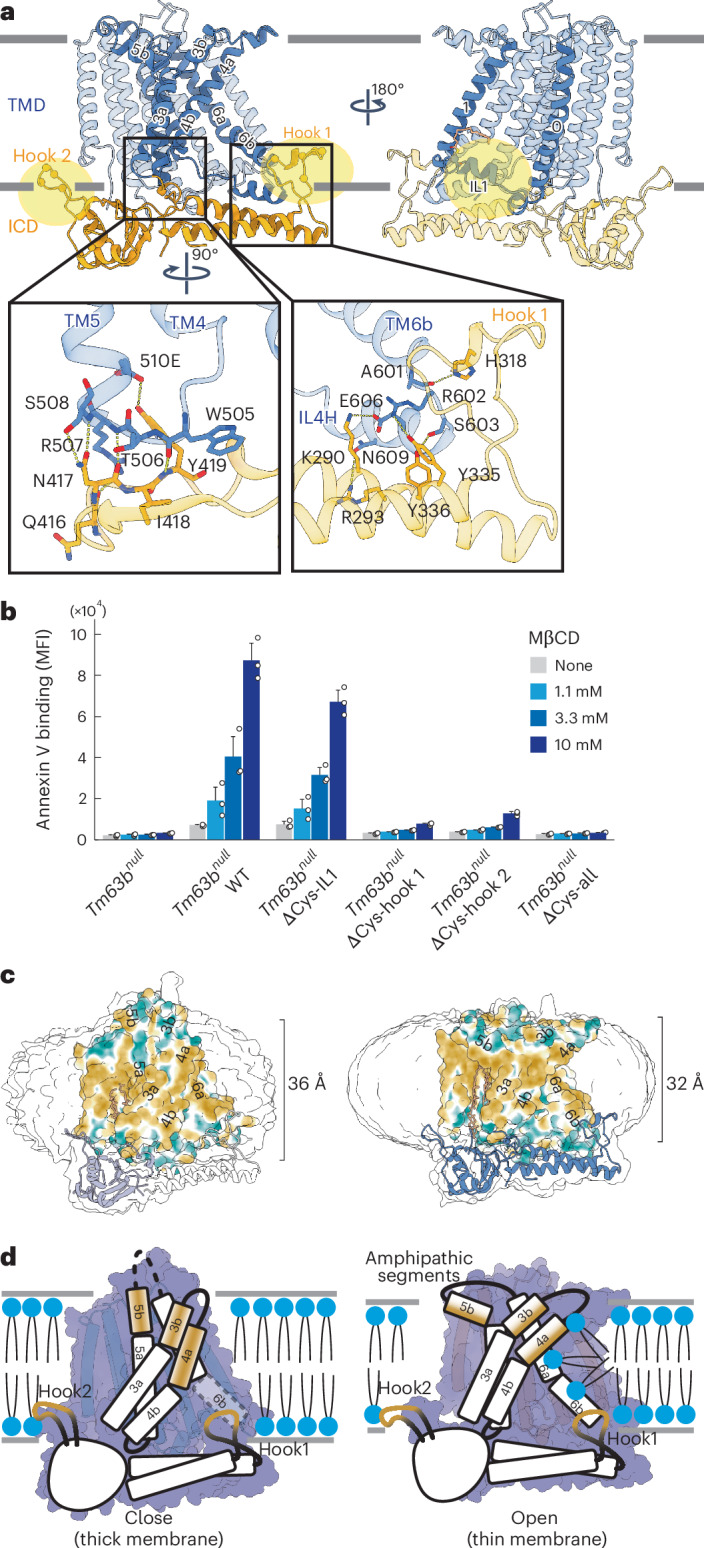
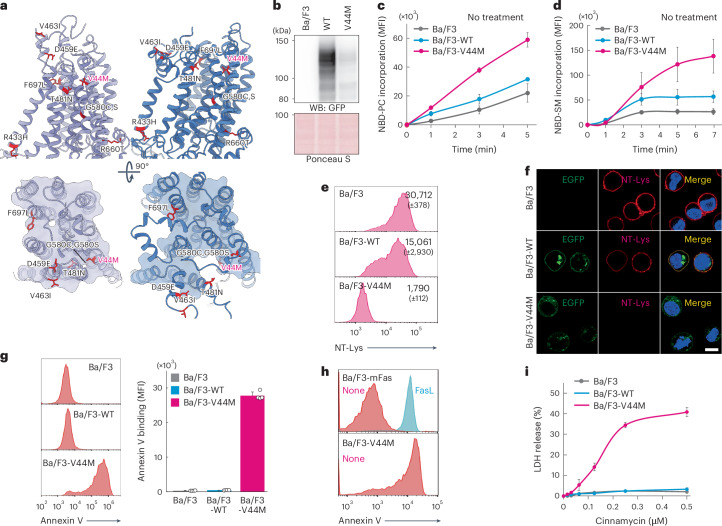
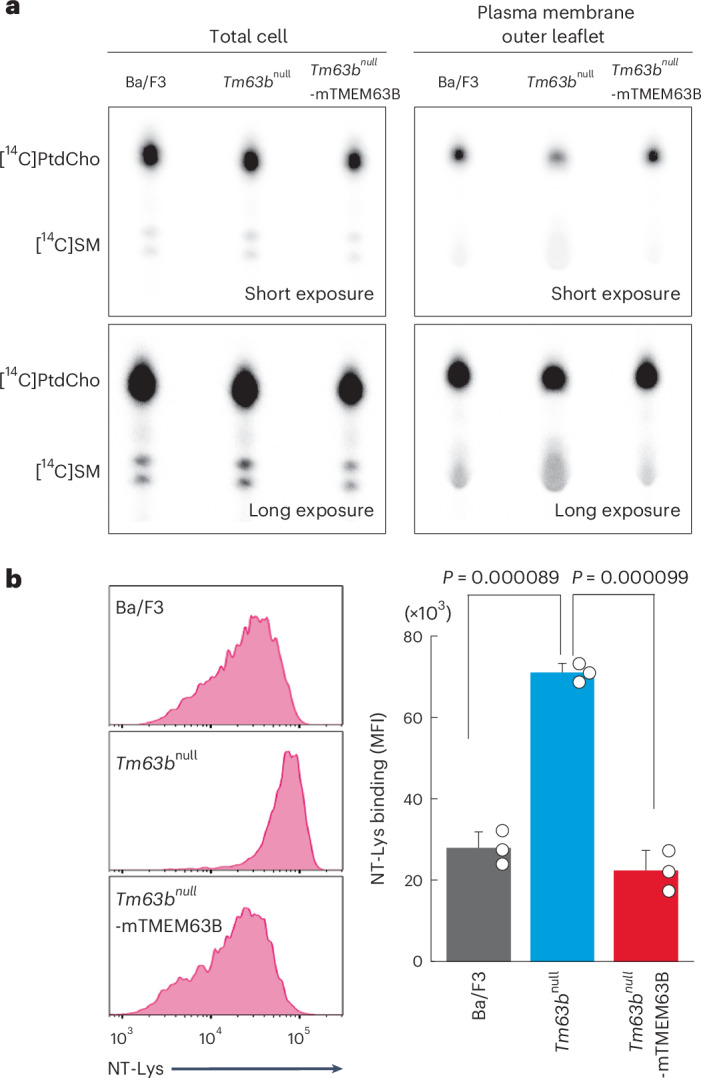
Phospholipids are asymmetrically distributed in the plasma membrane (PM), with phosphatidylcholine and sphingomyelin abundant in the outer leaflet. However, the mechanisms by which their distribution is regulated remain unclear. Here, we show that transmembrane protein 63B (TMEM63B) functions as a membrane structure-responsive lipid scramblase localized at the PM and lysosomes, activating bidirectional lipid translocation upon changes in membrane curvature and thickness. TMEM63B contains two intracellular loops with palmitoylated cysteine residue clusters essential for its scrambling function. TMEM63B deficiency alters phosphatidylcholine and sphingomyelin distributions in the PM. Persons with heterozygous mutations in TMEM63B are known to develop neurodevelopmental disorders. We show that V44M, the most frequent substitution, confers constitutive scramblase activity on TMEM63B, disrupting PM phospholipid asymmetry. We determined the cryo-electron microscopy structures of TMEM63B in its open and closed conformations, uncovering a lipid translocation pathway formed in response to changes in the membrane environment. Together, our results identify TMEM63B as a membrane structure-responsive scramblase that controls PM lipid distribution and we reveal the molecular basis for lipid scrambling and its biological importance.


Conflict of interest statement

Competing interests: The authors declare no competing interests.

Figures

Fig. 1
Fig. 1. Genome-wide CRISPR–Cas9 screen to identify genes affecting PtdCho dynamics.
a,f, PtdCho flippase activity. Ba/F3 cells or Ba/F3 cells expressing wild-type hATP11A or the Q84E mutant (a), and Ba/F3 cells, Ba/F3 cells or Tmem63bnull (Tm63bnull) transformants expressing the Q84E mutant, or Tm63bnull transformants expressing both mTMEM63B–Flag and the Q84E mutant (f) were incubated with NBD-PC at 15 °C and internalization of NBD-PC was measured by flow cytometry. Data were obtained in triplicate and represent the average median fluorescence intensity (MFI); error bars represent the s.d. P values were determined using a two-sided Student’s t-test. b, Schematic for PtdCho translocation in the PM. PtdCho flipping activity by the Q84E mutant is countered by unknown outward PtdCho translocation. c, Mutagenized cells expressing hATP11A-Q84E-mCherry were incubated with NBD-PC as above. Cells that exhibited high PtdCho flippase activity (0.1–3%) were sorted. Dot plots and histograms for NBD-PC (left) and hATP11A-Q84E-mCherry (right) are shown. The dotted circle indicates the sorted population. d, Genes plotted with percentages of detected reads against total reads and numbers of unique sgRNAs among six. Black arrows indicate three genes that cover >1% of total reads and five unique sgRNAs. e, Expression and localization of hATP11A-Q84E-mCherry. Ba/F3 (magenta) or Tm63bnull (cyan) cells expressing hATP11A-Q84E-mCherry were analyzed by flow cytometry (top) and confocal microscopy (bottom). Red, mCherry. Scale bar, 10 µm. Source data
Fig. 2
Fig. 2. Activation of TMEM63B-mediated lipid scrambling in the PM.
a, Schematic of TMEM63B activation by cholesterol deprivation or extracellular phospholipases. b, EGFP-tagged mTMEM63B was expressed in Tm63bnull cells (Tm63bnull-mTMEM63B) and protein expression was analyzed by western blotting with anti-GFP antibody (top) and Ponceau S staining (bottom). c, Tm63bnull-mTMEM63B cells in the presence of PlasMem Bright (red). The merged image of EGFP (green) and PlasMem Bright with Hoechst 33342 (blue) is shown. Scale bar, 10 µm. d, Tm63bnull and Tm63bnull-mTMEM63B cells were treated with or without 10 mM MβCD, stained with 10 µg ml−1 mCherry-D4 and analyzed by flow cytometry. Data were obtained in triplicate and represent the average MFI and s.d. P values were determined using a two-sided Student’s t-test. e,f,i,j, Inward scramblase activity. Tm63bnull and Tm63bnull-mTMEM63B cells were treated with or without MβCD (e,f) or the indicated phospholipase (i,j), incubated with 0.1 µM NBD-PC (e,i) or 0.2 µM NBD-SM (f,j) at 4 °C and analyzed by flow cytometry. Data were obtained in triplicate and represent the average MFI and s.d. g, Annexin V staining. Left, Tm63bnull and Tm63bnull-mTMEM63B cells were treated with (magenta) or without (cyan) MβCD, stained with annexin V–Cy5, and analyzed by flow cytometry. Representative histograms for annexin V binding in the propidium iodide (PI)-negative populations are shown. Right, data were obtained in triplicate and represent the average MFI and s.d. h, Tm63bnull and Tm63bnull-mTMEM63B cells were treated with or without MβCD, incubated with cinnamycin, stained with and analyzed by flow cytometry. Data were obtained in triplicate and represent the mean and s.d. of the percentage of propidium iodide-positive cells. km, Tm63bnull and Tm63bnull-mTMEM63B cells were treated with (magenta) or without (cyan) the indicated concentration of PLD (k), PLC (l) or SMase (m), stained with annexin V–Cy5 and analyzed by flow cytometry. k, Left, representative histograms for annexin V binding in the propidium iodide-negative populations. Right, data were obtained in triplicate and represent the average MFI and s.d. Source data
Fig. 3
Fig. 3. Cryo-EM structures of mTMEM63B.
a,b, Cryo-EM maps (a) and ribbon models (b) for mTMEM63B in LMNG–CHS (left) and DDM–CHS with Fab (right). Additional densities and models for lipid or CHS are shown in orange. The approximal micelle size is indicated. Arrowheads indicate two hook regions anchored to the micelles. c, Schematic diagram for mTMEM63B topology. Red circles indicate palmitoylated cysteines and yellow circles indicate cysteine clusters. df, Structural comparison of Arabidopsis thaliana (At) OSCA1.2 (d), mouse (m) TMEM16F (e) and mTMEM63B (f). Hook regions in OSCA and mTMEM63B are indicated. Insets show zoomed-in views for the two hook regions in mTMEM63B (f) and corresponding regions in AtOSCA1.2 (d). Scale bar, 10 Å (f). Cysteine residues are clustered in the hook regions in mTMEM63B. Red spheres indicate Ca2+ ions that activate mTMEM16F (e).
Fig. 4
Fig. 4. mTMEM63B LTP.
a, Comparison of closed (blue) and open (orange) conformations for TM3–TM6 in mTMEM63B (left), mTMEM16F (F518 mutant) (middle; Ca2+-free: PDB 8B8G, Ca2+-bound: PDB 8B8J) and mTMEM16A (right; Ca2+-free: PDB 5OYG, Ca2+-bound: PDB 5OYB). Red arrows indicate conformational changes upon activation. Red spheres indicate Ca2+ ions. b, Surface representation of mTMEM63B in LMNG–CHS (left) and DDM–CHS with Fab (right). Bottom, the cutaway surface at the dotted line in the top panels, with ribbon model and TM numbering indicated. Stick models indicate bound lipids and CHS. Red arrowheads indicate the LTP. c,d, Residues constituting LTP are shown for LMNG–CHS (left, closed) and DDM–CHS with Fab (right, open). The lateral cleft is depicted in light green. e, EGFP-mTMEM63B was expressed and analyzed by western blotting with anti-GFP antibody (top, short exposure; middle, long exposure; bottom, Ponceau S staining). Black arrows indicate mTMEM63B. f,g,n,o, Inward scrambling of NBD-PC (f,n) and NBD-SM (g,o). Tm63bnull and their transformants were pretreated with (f,g) or without (n,o) MβCD, incubated with 0.1–0.2 µM NBD-PC for 5–7 min (f,n) and 0.2-1 µM NBD-SM for 7–15 min (g,o) and analyzed by flow cytometry. Data were obtained in triplicate and represent the MFI (n,o) or relative scramblase activity compared to that of wild-type mTMEM63B (f,g). Error bars represent the s.d. h,i,p,q, Outward scrambling of PtdSer (h,p) and PtdEtn (i,q). Tm63bnull cells or their transformants were incubated with (h) or without (p) MβCD, stained with annexin V–Cy5 and analyzed by flow cytometry. Data were obtained in triplicate; error bars represent the s.d. i,q, Tm63bnull cells or their transformants were pretreated with (i) or without (q) MβCD and treated with cinnamycin; the percentage of propidium iodide-positive cells was determined by flow cytometry. Data were obtained in triplicate and represent percentages (q) or relative propidium iodide positivity rate compared to that of wild-type mTMEM63B-expressing cells (i); error bars represent the s.d. jm, Changes in TM6 in mTMTM16F (j,k) and mTMEM63B (l,m). Sticks indicate residues constituting the Ca2+ site in mTMEM16F and corresponding residues in mTMEM63B. Source data
Fig. 5
Fig. 5. A model for membrane sensing by mTMEM63B.
a, Interactions between ICD (orange) and TMD (cyan) with the two hook regions. Palmitoylated cysteine clusters are indicated in yellow. Insets show the zoomed-in views for contact regions between ICD and TMD. Sticks indicate the residues involved and yellow dotted lines indicate potential hydrogen-bonding interactions. b, Tm63bnull cells or their transformants were incubated with or without the indicated concentrations of MβCD, stained with annexin V–Cy5 and analyzed by flow cytometry. Experiments were repeated three times; error bars represent the s.d. c, The molecular lipophilicity potential is mapped on the surface representation of mTMEM63B in LMNG–CHS (left) and DDM–CHS with Fab (right), with color codes from dark cyan (most hydrophilic) through white to dark goldenrod (most lipophilic), suggesting that the LMNG–CHS structure has a longer membrane traverse region on TM3–TM6 compared to the DDM–CHS structure. d, Proposed mechanism for mTMEM63B activation. ICD is anchored to the cytoplasmic membrane leaflet through the palmitoylated hook regions, while TM3b, TM4a and TM5b associate with the extracellular membrane leaflet. The combination of these structural elements could enable the sensing of various changes in physical properties of the lipid membrane and stimulate conformational changes to open the extracellular hydrophobic gate of LTP. Source data
Fig. 6
Fig. 6. V44M mutant disrupts phospholipid asymmetry by constitutively active lipid scrambling.
a, Schematic of LTP with reported pathogenic amino acid substitutions of human TMEM63B. Pathogenic amino acid substitutions are mapped on the current structures of closed (left; LMNG–CHS) and open (right; DDM–CHS with Fab) forms, with the most frequent pathogenic substitution, V44M, labeled in pink. b, EGFP-tagged wild-type mTMEM63B or V44M mutant was expressed in parental Ba/F3 cells and analyzed by western blotting with anti-GFP antibody (top) and Ponceau S staining (bottom). c,d, Inward scramblase activity. Ba/F3, Ba/F3-wild-type mTMEM63B or Ba/F3-mTMEM63B-V44M were incubated with 0.1 µM NBD-PC (c) or 1 µM NBD-SM (d) at 15 °C and analyzed by flow cytometry. Data were obtained in triplicate and represent the average MFI; error bars represent the s.d. e,f, NT-Lys-RFP staining. Ba/F3 cells or their transformants were stained with 10 µg ml−1 NT-Lys-RFP and analyzed with flow cytometry (e) or confocal microscopy (f). Data were obtained in triplicate and represent the average MFI and s.d. in SYTOX blue-negative population shown in histograms (e). Scale bar, 10 µm (f). g,h, Ba/F3 cells or their transformants were stained with annexin V–Cy5. To induce apoptosis, Ba/F3-mFas cells were treated with (cyan) or without (magenta) mFasL for 4 h at 37 °C. (g; right). Data were obtained in quadruplicate and represent the average MFI; error bars represent the s.d. i, Ba/F3 cells or their transformants were treated with the indicated concentrations of cinnamycin. LDH release was determined as compared to that released by 1% Triton X-100 treatment. Data were obtained in triplicate and represent average percentages; error bars represent the s.d. Source data
Fig. 7
Fig. 7. TMEM63B deficiency alters PtdCho and SM distribution in the PM outer leaflet.
a, Ba/F3, Tm63bnull and Tm63bnull-mTMEM63B-EGFP cells were labeled with [14C]choline. Total cellular lipids (left) and lipids extracted by SM-loaded MαCD from the PM outer leaflet (right) were separated by TLC. b, Ba/F3 cells or their transformants were stained with 10 µg ml−1 NT-Lys-RFP and analyzed with flow cytometry. Left, representative histograms for NT-Lys. Right, data were obtained in triplicate and represent the average MFI and s.d. in the SYTOX blue-negative population shown in histograms. P values were determined using a two-sided Student’s t-test. Source data
Extended Data Fig. 1
Extended Data Fig. 1. Characteristics of TMEM63B-mediated lipid scrambling in the PM.
a, Cell growth. Ba/F3 and Tmem63bnull cells (Tm63bnull) were cultured for 2 days and re-seeded at 2 × 10⁴ cells/mL. Viable cells were counted after staining with trypan blue, and average cell numbers were plotted. Experiments were performed in triplicate, and data represent average cell number plotted with SD (bar). The doubling times for Ba/F3 and Tmem63bnull cells are shown with SD. b, Electron microscopy images of Ba/F3 and Tm63bnull cells. Cells were incubated in phosphate buffer containing 2.5% glutaraldehyde and 2% paraformaldehyde, followed by osmium tetroxide fixation. Samples were double-stained with uranyl acetate and lead citrate, and images were acquired by transmission electron microscope. Bar, 2 µm c, Lipid profiles of Ba/F3, Tm63bnull and Tm63bnull-mTMEM63B cells. Total cellular lipids were analyzed in quintuplicate, and data represent average values with SD (bar) (n = 5). CE, Cholesterol ester. Chol, Cholesterol. DG, Diacylglycerol. TG, Triacylglycerol. PA, Phosphatidic acid. PC, Phosphatidylcholine. SM, Sphingomyelin. PS, Phosphatidylserine. PE, Phosphatidylethanolamine. PI, Phosphatidylinositol. PG, Phosphatidylglycerol. d, Tm63bnull-mTMEM63B-mCherry cells in the presence of PlasMem Bright, LysoTracker, ER Tracker, or GolgiSeeing. A merged image of mCherry (Magenta) and respective organelle markers (Green) with Hoechst 33342 (Blue) is shown. Bar, 10 µm. e,g,h,i, Annexin V staining. Ba/F3, Tm63bnull, or Tm63bnull-mTMEM63B cells were treated with or without 20 μM BAPTA-AM (calcium chelator) or 20 μM Q-VD-OPh (caspase inhibitor), treated with 10 mM MβCD (e) or 25 U/mL PLD (g, h), stained with Annexin V-Cy5, and analyzed by flow cytometry in the presence of 10 μg/mL propidium iodide. Representative histograms for Annexin V binding in the propidium iodide-negative population are shown (i). The experiments were repeated three times and data represent averages of MFI plotted with SD (bar) (e, g) or indicated (i). f, Cinnamycin sensitivity. Tm63bnull-mTMEM63B cells were treated with or without BAPTA-AM as above, treated with MβCD, incubated with 0.5 µM Cinnamycin, stained with propidium iodide, and analyzed by flow cytometry. The experiments were repeated three times and data represent averages of percentages of propidium iodide (PI)-positive cells plotted with SD (bar). Source data
Extended Data Fig. 2
Extended Data Fig. 2. Cryo-EM data processing of mTMEM63B in the LMNG-CHS micelle.
a, Representative micrograph of mTMEM63B in LMNG-CHS. b, Data processing flow chart with representative 2D class averages and maps. c, Fourie shell correlation (FSC) curve of the Non-Uniform (NU)-refinement. d, Local resolution mapped on the locally-filtered refined map. e, Map vs model FSC curve, with the resolution threshold (FSC = 0.5). f, Orientation distribution of the particles used for NU-refinement.
Extended Data Fig. 3
Extended Data Fig. 3. Cryo-EM data processing of mTMEM63B in the LMNG-CHS micelle with YN9303-24 Fab.
ac Representative micrographs of mTMEM63B in LMNG-CHS with YN9303-24 Fab (a) and the same grid preparation supplemented with fluorinated foscholine-8 (F-FC8) (b) or CHAPS (c). d, Data processing flow chart with representative 2D class averages and maps. e, Fourie shell correlation (FSC) curve of the Non-Uniform (NU)-refinement. f, Local resolution mapped on the unsharpened refined map. g, Orientation distribution of the particles used for NU-refinement.
Extended Data Fig. 4
Extended Data Fig. 4. Cryo-EM data processing of mTMEM63B in the DDM-CHS micelle.
a, Representative micrograph of mTMEM63B in DDM-CHS. b, Data processing flow chart with representative 2D class averages and maps. c, Fourie shell correlation (FSC) curve of the Non-Uniform (NU)-refinement. d, Local resolution mapped on the locally-filtered refined map. e, Orientation distribution of the particles used for NU-refinement.
Extended Data Fig. 5
Extended Data Fig. 5. Cryo-EM data processing of mTMEM63B in the DDM-CHS micelle with YN9303-24 Fab.
a, Representative micrograph of mTMEM63B in DDM-CHS with YN9303-24 Fab. b, Data processing flow chart with representative 2D class averages and maps. c, Fourie shell correlation (FSC) curve of the Non-Uniform (NU)-refinement. d, Local resolution mapped on the locally-filtered refined map. e, Map vs model FSC curve, with the resolution threshold (FSC = 0.5). f, Orientation distribution of the particles used for NU-refinement.
Extended Data Fig. 6
Extended Data Fig. 6. Amino acid sequence alignment of plant OSCA1 and vertebrate TMEM63B.
Amino acid sequences of mammalian TMEM63B (human: NP_001305721.1, mouse: NP_937810.2, chicken: NP_001366170.1, and zebrafish: XP_005157122.1) and its plant orthologues (OSCA1.1: NP_849297.1, OSCA1.2: NP_001078425.1) are shown. Alignment was performed using Clustal Omega attaining maximum homology (https://www.ebi.ac.uk/Tools/msa/clustalo/). Domains are designated as previously reported. Transmembrane regions (TM) and intracellular linkers (IL) with helix (H) and β-sheet (β) are numbered and shaded in gray and magenta, respectively. Identical amino acids among species are indicated by asterisks. Amino acid residues found in patients with severe developmental and epileptic encephalopathy are colored in green. Glutamate residues in TM6a of OSCA1 involved in its channel activity are colored in orange. Palmitoylated cysteine residues found in present and previous studies are colored in magenta,. Amino acid residues affecting mTMEM63B-mediated scrambling and the outward TM incline in the DDM-CHS structure are highlighted in yellow and blue boxes, respectively.
Extended Data Fig. 7
Extended Data Fig. 7. Comparison of mTMEM63B in different detergent micelles.
a, Low-contoured unsharpened consensus maps show the ICD densities in both LMNG-CHS and DDM-CHS structures. The Hook1 region is located peripherally in the LMNG-CHS micelle that has a smaller diameter as compared to the DDM-CHS micelle. TMD and ICD are labeled, and the ICD region is indicated in yellow. b.c, Additional densities for the boundary lipid or CHS molecules and palmitoyl moiety attached to the Cys126 sidechain were observed for LMNG-CHS (b) and DDM-CHS with YN9303-24 Fab (c). The palmitoyl moieties in the Cys clusters in the two hook regions are not visible, due to high flexibility. TM numbering and IL1H (the TM0–TM1 loop) and Cys126 are indicated. d, Unsharpened consensus maps of mTMEM63B in LMNG-CHS (light green), LMNG-CHS with YN9303-24 Fab (light purple), DDM-CHS (orange), and DDM-CHS with YN9303-24 Fab (light blue) are shown. YN9303-24 Fab did not induce conformational changes in LMNG-CHS (left), while it induced significant conformational changes around lipid translocation pathway (LTP) and stabilizes the open form in DDM-CHS (middle). The comparison of the structures in LMNG-CHS and DDM-CHS without YN9303-24 Fab highlighted extracellular kinks of TM3 and TM4, induced by different micelle environments (right). e, Sections of the consensus maps in the transmembrane region (upper panels) and ICD (lower panels). The Hook1 region is less visible in LMNG-CHS.
Extended Data Fig. 8
Extended Data Fig. 8. Comparison of TMEM16 family members and TMEM63B.
a, Conformational changes between mTMEM63B in LMNG-CHS and DDM-CHS with Fab are shown for each TM helix. Kink-inducing residues, such as Pro and Gly, are indicated. b,c, Surface representation of the mTMEM16F scramblase (F518 mutant) (A; Ca2+-free: 8B8G and Ca2+-bound: 8B8J) and the mTMEM16A ion channel (B; Ca2+-free: 5OYG, Ca2+-bound: 5OYB) in inactive (left) and Ca2+-bound active (right) forms are shown. Lower panels show the cutaway surface at the dotted line in the upper panels, with ribbon model and TM numbering indicated. mTMEM16F shows a large cleft at the lateral side in the active-like form, whereas mTMEM16A does not have such a cleft. d,g, Tm63bnull cells expressing EGFP or mCherry-tagged WT or mutated mTMEM63B (Green or Magenta) were observed with a confocal microscope in the presence of PlasMem Bright. A merged image of TMEM63B-EGFP (Green) or -mCherry (Magenta) and PlasMem Bright with Hoechst 33342 (Blue) is shown. Bar, 10 µm. e, Amino acid sequences of TMEM16 [nhTMEM16 (UniProtKB: 6QM6), mouse TMEM16A (UniProtKB: Q8BHY3), human TMEM16F (UniProtKB:Q4KMQ2), mouse TMEM16F U (UniProtKB:Q6P9J9)] and mouse TMEM63B [UniProt: Q3TWI9] are aligned using Clustal Omega attaining maximum homology (https://www.ebi.ac.uk/Tools/msa/clustalo/). Transmembrane segments are shadowed in gray and numbered. Amino acid residues affecting mTMEM63B-mediated scrambling are highlighted in yellow box. Acidic residues for Ca2+-binding in TMEM16 are highlighted in magenta. Inner activation domain between TM4 and TM5 in TMEM16 is indicated by green line. Identical amino acids among mammalian TMEM16F and TMEM63B are indicated by asterisks. f, mCherry-tagged WT- or Cys-mutants was expressed in Tm63bnull cells and analyzed by western blotting with anti-mCherry antibody (Top). CBB staining (Bottom). Source data
Extended Data Fig. 9
Extended Data Fig. 9. Characteristics of Ba/F3 TMEM63B mutant cells.
a, Ba/F3 cells expressing EGFP-tagged WT or V44M mTMEM63B (Green) were observed with confocal microscopy in the presence of PlasMem Bright (Red). Merged image of EGFP (Green) and PlasMem Bright with Hoechst 33342 (Blue) is shown. Bar, 10 µm. b, Cell growth. Parental Ba/F3 and their transformants were cultured for 2 days and re-seeded at 2 × 10⁴ cells/mL. Viable cells were counted with trypan-blue staining and average cell numbers were plotted. Experiments were performed in triplicate, and data represent average cell numbers plotted with SD (bar). Doubling times for Ba/F3, Ba/F3-mTMEM63B, and Ba/F3-V44M cells are shown with SD. The doubling time is shown with SD value in the column. c, Electron microscopy images of Ba/F3, Ba/F3-mTMEM63B, and Ba/F3-V44M cells. Cells were incubated in phosphate buffer containing 2.5% glutaraldehyde and 2% paraformaldehyde, followed by osmium tetroxide fixation. Samples were double-stained with uranyl acetate and lead citrate, and images were acquired by transmission electron microscope. Arrowheads indicate enlarged vesicle structures. The region indicated by dotted line is shown with higher magnification in red box. Bar, 2 µm for left and middle panels, and 1 µm for right panel. d, Ba/F3 cells or their transformants were stained with Annexin V-Cy5 and SytoxBlue, and their Annexin V and SytoxBlue profiles are shown. Data were obtained in triplicate and represent average MFI is shown with SD. e, Ba/F3 cells or their transformants were treated with the indicated concentrations of cinnamycin. LDH release was determined as compared with that released by 1% Triton-X100 treatment. Data were obtained in triplicate and represent average percentages with SD (bar). Source data
Extended Data Fig. 10
Extended Data Fig. 10. Regulation of distribution of phospholipids in the PM.
At steady-state conditions, PtdSer and PtdEtn are confined to the inner leaflet of PMs by P4-ATPases. PtdCho and SM are rich in the PM outer leaflet, and TMEM63B is inactive. Once the physical properties of PMs are changed by phospholipases, such as PLD and SMase, or PtdCho accumulation into the PM inner leaflet, TMEM63B is activated to randomize lipids in the PM, resolving the compositional or quality imbalances across the lipid bilayer. After (or coupled with) the randomization, PtdSer and PtdEtn are confined to the PM inner leaflet by P4-ATPases. Finally, these rearrangements of lipid distribution of the PM may lead to the inactivation of TMEM63B. The TMEM63B-mediated lipid scrambling contributes to PtdCho localization to the PM outer leaflet and balances between PtdCho and SM at steady-state conditions.

References

    1. Harayama, T. & Riezman, H. Understanding the diversity of membrane lipid composition. Nat. Rev. Mol. Cell Biol.19, 281–296 (2018). - PubMed
    1. Janmey, P. A. & Kinnunen, P. K. Biophysical properties of lipids and dynamic membranes. Trends Cell Biol.16, 538–546 (2006). - PubMed
    1. Kefauver, J. M., Ward, A. B. & Patapoutian, A. Discoveries in structure and physiology of mechanically activated ion channels. Nature587, 567–576 (2020). - PMC - PubMed
    1. Devaux, P. F. Static and dynamic lipid asymmetry in cell membranes. Biochemistry30, 1163–1173 (1991). - PubMed
    1. Lorent, J. H. et al. Plasma membranes are asymmetric in lipid unsaturation, packing and protein shape. Nat. Chem. Biol.16, 644–652 (2020). - PMC - PubMed

MeSH terms