. 2024 Oct 18;30(1):180.
doi: 10.1186/s10020-024-00876-x.

New perspectives on YTHDF2 O-GlcNAc modification in the pathogenesis of intervertebral disc degeneration

Affiliations

New perspectives on YTHDF2 O-GlcNAc modification in the pathogenesis of intervertebral disc degeneration

Liangjie Lu et al. Mol Med. .

Abstract

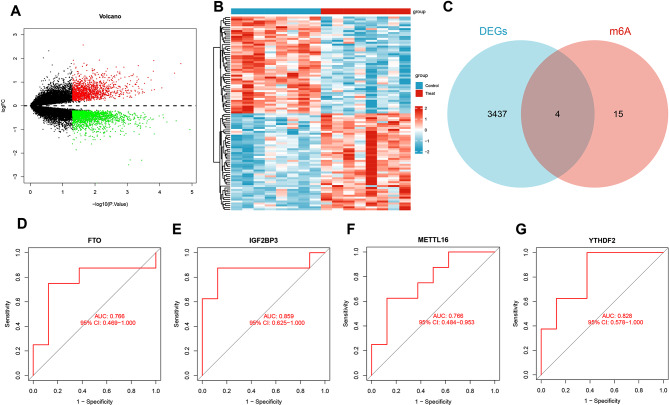
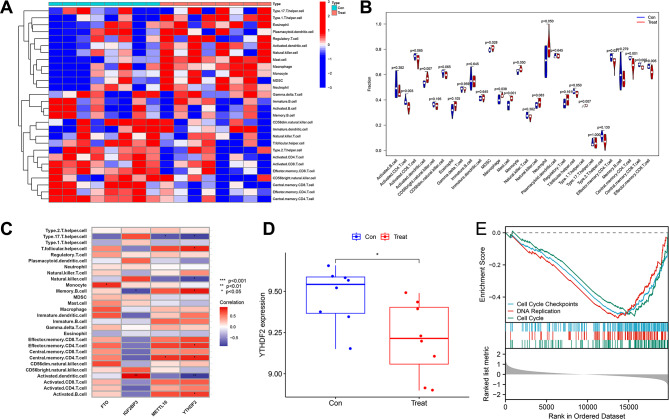
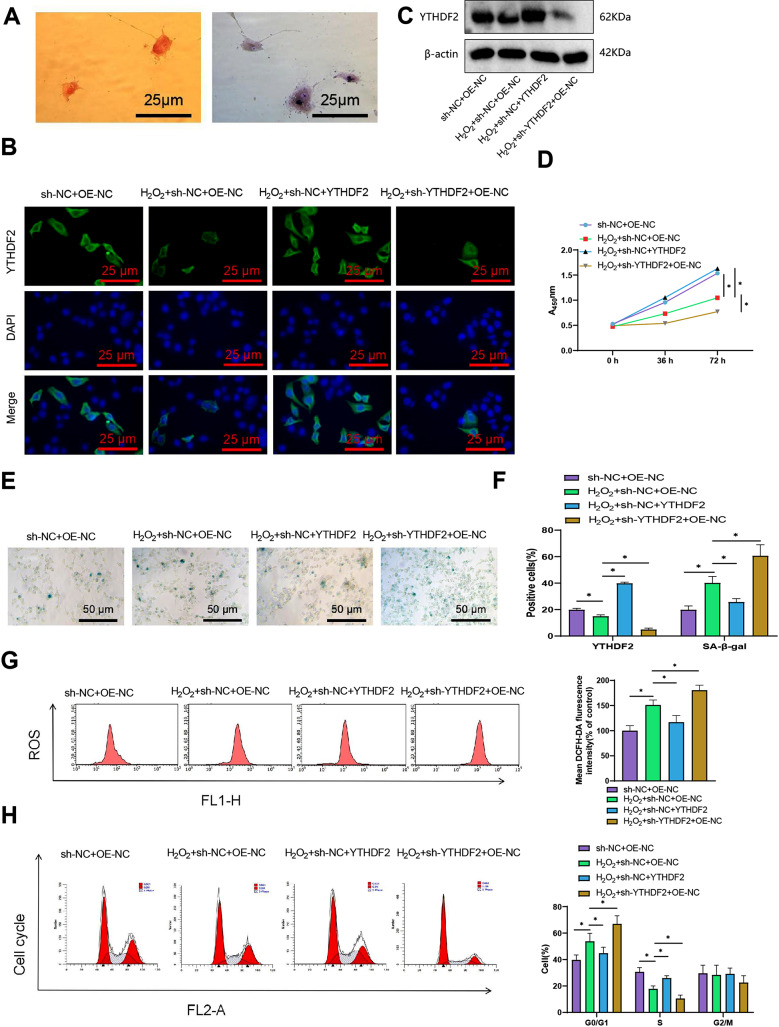
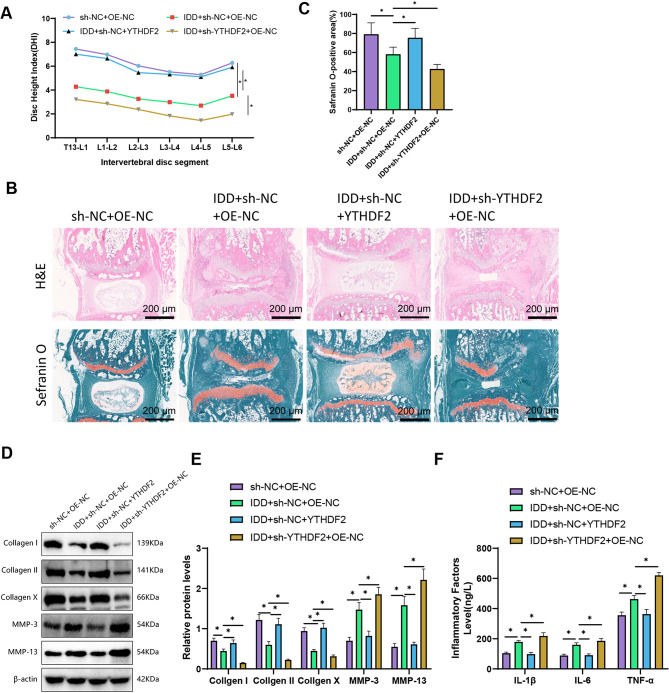
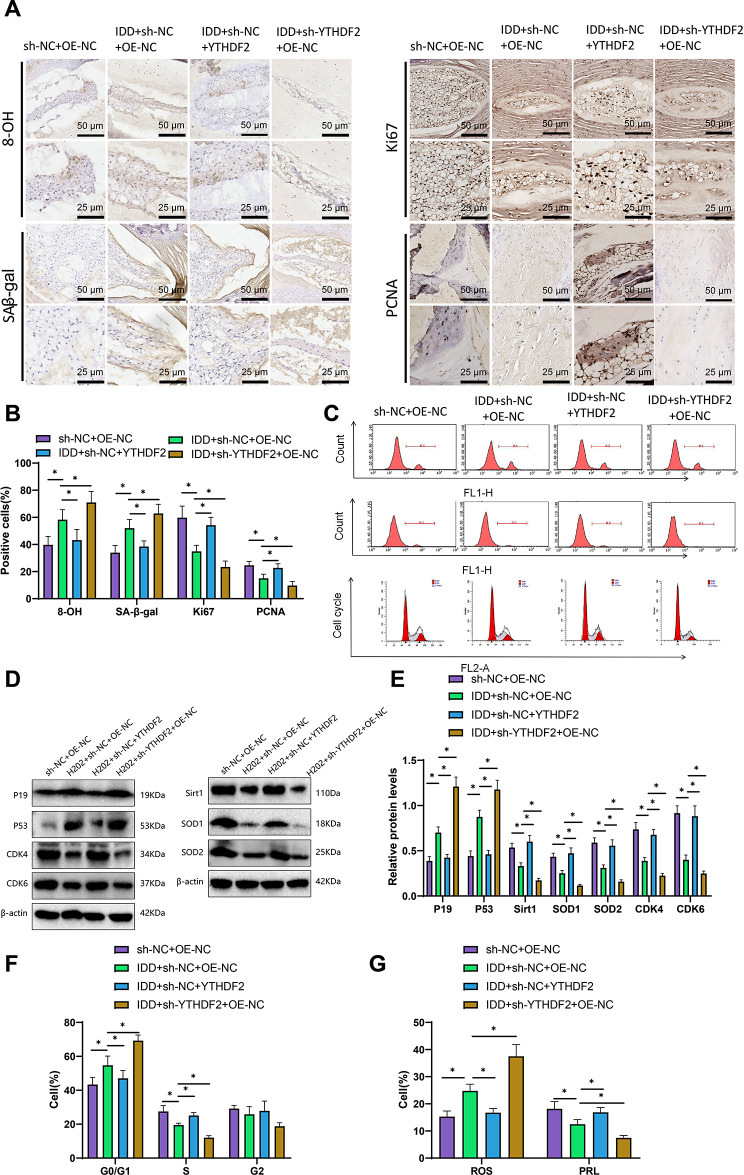
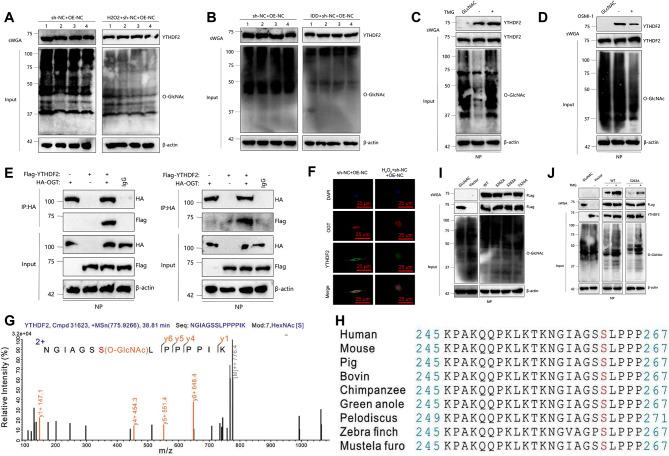
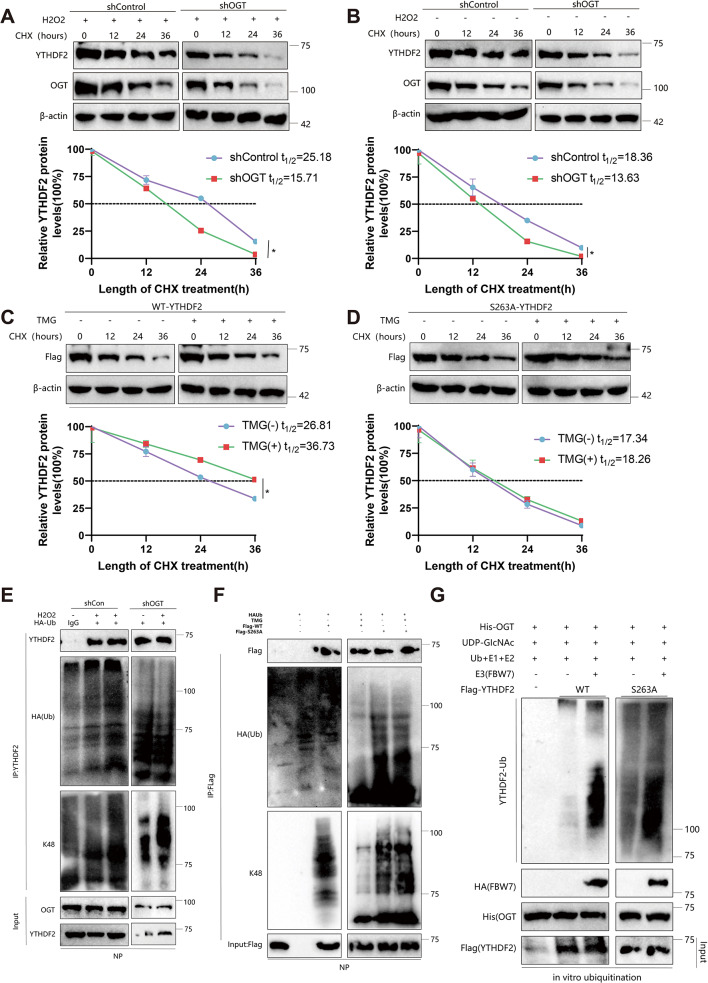
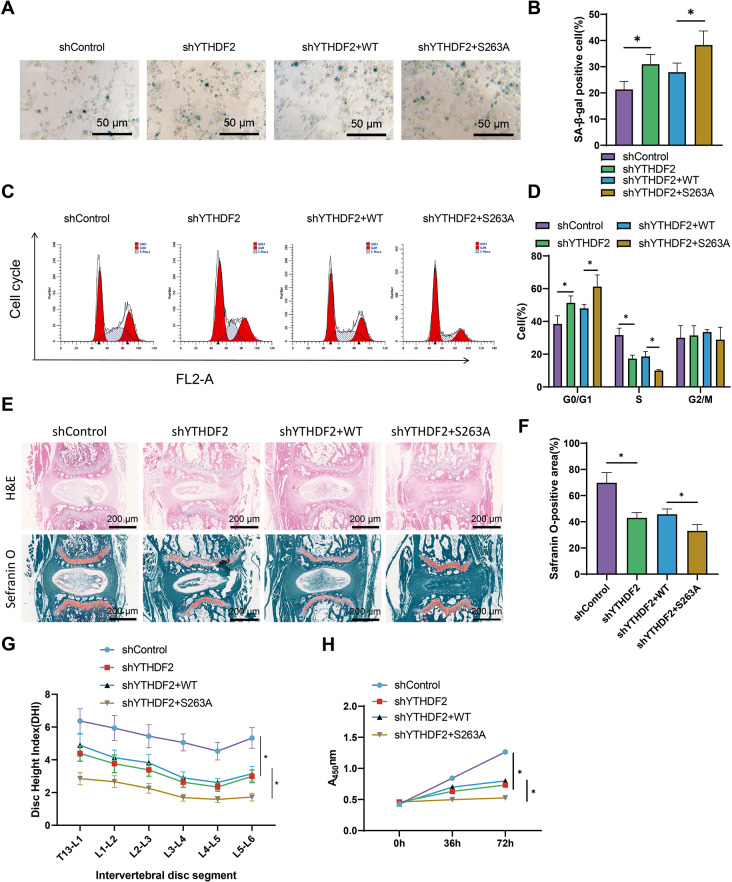
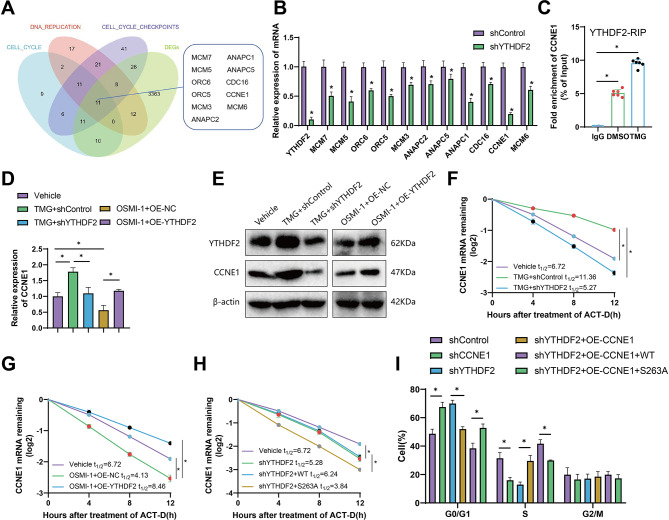
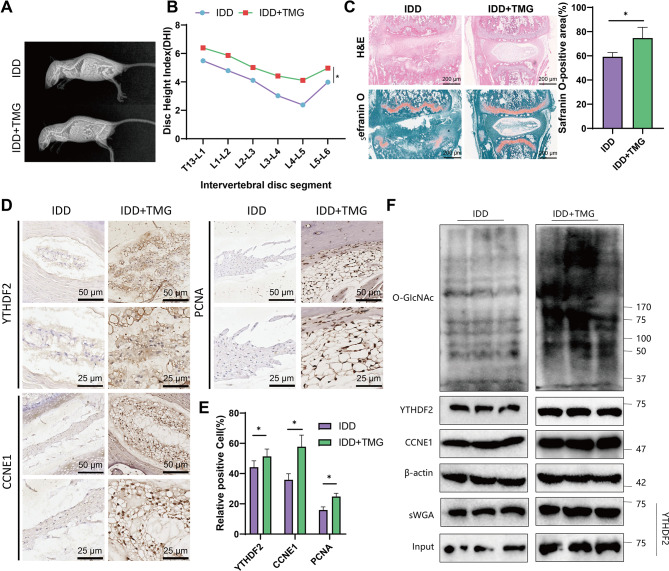
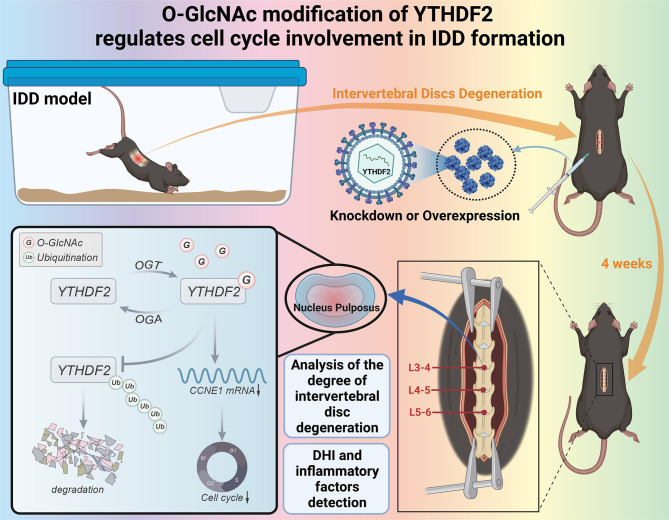
This study investigates the potential molecular mechanisms by which O-GlcNAc modification of YTHDF2 regulates the cell cycle and participates in intervertebral disc degeneration (IDD). We employed transcriptome sequencing to identify genes involved in IDD and utilized bioinformatics analysis to predict key disease-related genes. In vitro mechanistic validation was performed using mouse nucleus pulposus (NP) cells. Changes in reactive oxygen species (ROS) and cell cycle were assessed through flow cytometry and CCK-8 assays. An IDD mouse model was also established for in vivo mechanistic validation, with changes in IDD severity measured using X-rays and immunohistochemical staining. Bioinformatics analysis revealed differential expression of YTHDF2 in NP cells of normal and IDD mice, suggesting its potential as a diagnostic gene for IDD. In vitro cell experiments demonstrated that YTHDF2 expression and O-GlcNAcylation were reduced in NP cells under H2O2 induction, leading to inhibition of the cell cycle through decreased stability of CCNE1 mRNA. Further, in vivo animal experiments confirmed a decrease in YTHDF2 expression and O-GlcNAcylation in IDD mice, while overexpression or increased O-GlcNAcylation of YTHDF2 promoted CCNE1 protein expression, thereby alleviating IDD pathology. YTHDF2 inhibits its degradation through O-GlcNAc modification, promoting the stability of CCNE1 mRNA and the cell cycle to prevent IDD formation.

Keywords: CCNE1; Cell cycle; Intervertebral disc degeneration; O-GlcNAc modification; Oxidative stress; YTHDF2.


Conflict of interest statement

The author declares no conflict of interest.

Figures

Fig. 1
Fig. 1
Identification of diagnostic genes for intervertebral disc degeneration through bioinformatics analysis. Note: (A) Heatmap and volcano plot of differentially expressed genes between the control group sample (Control group, normal mice, n = 8) and the treatment group sample (Treat group, IDD group, n = 8), where red dots represent upregulated genes, green dots represent downregulated genes, and black dots represent genes with no significant difference between the two groups; (B) Heatmap of the top 50 differentially expressed genes between the control group sample and the experimental group sample; (C) Venn diagram showing the intersection between differentially expressed genes and m6A genes; (D) ROC curve of FTO as a diagnostic gene for the disease; (E) ROC curve of IGF2BP3 as a diagnostic gene for the disease; (F) ROC curve of METTL16 as a diagnostic gene for the disease; (G) ROC curve of YTHDF2 as a diagnostic gene for the disease
Fig. 2
Fig. 2
Immune cell infiltration analysis of samples through ssGSEA. Note: (A) Heatmap of immune cells in the control group (Control group, normal mice, n = 8) and treatment group (Treat group, IDD group, n = 8); (B) Violin plot analysis of the differences in immune cells between the control group and treatment group; (C) Correlation analysis between candidate genes and immune cells; (D) Differential expression of YTHDF2 in the control group and treatment group, with a t-test used between the two groups, where * indicates significant differences between the two groups (P < 0.05); (E) GSEA analysis of differential gene sets between the control group and treatment group
Fig. 3
Fig. 3
Effects of YTHDF2 on NP cell proliferation, senescence, and reactive oxygen species (ROS) levels. Note: (A) Staining identification of NP cells in mice, Safranin O staining shows that the cell nucleus appears orange; Toluidine blue staining shows that the cell nucleus appears blue. The scale bar in the figure is 25 μm; (B) Immunofluorescence detection of YTHDF2 expression levels in NP cells under different treatment conditions (sh-NC + OE-NC, H2O2 + sh-NC + OE-NC, H2O2 + sh-NC + YTHDF2 and H2O2 + sh-YTHDF2 + OE-NC). YTHDF2 expression is shown in green fluorescence, and DAPI represents the cell nucleus staining results, with the scale bar labeled as 25 μm (200×); (C) Western blot detection of YTHDF2 expression levels under different treatment conditions; (D) CCK-8 detection of NP cell viability under different treatment conditions as in A; (E) SA-β-gal staining to assess changes in cell aging under different treatment conditions, with the scale bar labeled as 50 μm (200×); (F) Statistical comparison of the percentage of positive cells in Figures A and D; (G) Flow cytometry to determine ROS levels in NP cells under different treatment conditions with statistical analysis; (H) Flow cytometry to determine the cell cycle distribution in NP cells under different treatment conditions; t-test, * indicates a significant difference between the two groups (P < 0.05), with n = 6 samples in each cell experiment group and the experiment repeated 3 times
Fig. 4
Fig. 4
Regulatory role of YTHDF2 in mouse IDD. Note: (A) Representative X-ray images under different treatment conditions of each group of mice (sh-NC + OE-NC, IDD + sh-NC + OE-NC, IDD + sh-NC + YTHDF2, and IDD + sh-YTHDF2 + OE-NC) were used to calculate the disc height index (DHI) of mouse lumbar intervertebral discs; (B) H&E staining and Safranin O staining images of lumbar intervertebral discs for different groups, where orange indicates NP cells and collagen, blue represents fibers, with a scale bar of 200 μm (200×); (C) Size of positive areas for Safranin O staining in different groups; (D) Western blot analysis of protein expression levels in different groups; (E) Graphical representation of protein expression levels in different groups; (F) ELISA analysis of inflammatory factors IL-1β, IL-6, and TNF-α expression levels in disc tissue. Each group consisted of n = 6 mice; t-test, * indicates significant difference between two groups (P < 0.05), with the experiment repeated 3 times
Fig. 5
Fig. 5
Effects of YTHDF2 on antioxidant capacity and NP cell proliferation in mice. Note: (A) Immunohistochemical staining was performed on intervertebral disc slices from different groups (sh-NC + OE-NC, IDD + sh-NC + OE-NC, IDD + sh-NC + YTHDF2, and IDD + sh-YTHDF2 + OE-NC), respectively labeled with 8-hydroxy-2’-deoxyguanosine (8-OHdG), senescence-related beta-galactosidase (SA-β-gal), Ki67, and proliferating cell nuclear antigen (PCNA), shown as 50 μm (200×, top) or 50 μm (200×, bottom); (B) Statistical graphs of immunohistochemical staining in different groups; (C) Measurement of reactive oxygen species (ROS) levels, cell proliferation (PRL), and cell cycle distribution in freshly collected mouse NP cells under different treatments by flow cytometry; (D) Detection of different protein expression levels by Western blot under different treatment conditions; (E) Statistical graphs of protein expression levels under different treatment conditions; (F) Flow cytometry analysis of cell cycle distribution under different treatment conditions; (G) Quantitative statistical graphs of ROS levels and PRL levels under different treatment conditions; the number of mice in each group is n = 6; t-test, * denotes significant difference between two groups (P < 0.05). The experiment was repeated three times
Fig. 6
Fig. 6
Regulation of O-GlcNAcylation of YTHDF2 in H2O2-induced NP cells and IDD mice. Note: (A-B) O-GlcNAcylation of YTHDF2 and total O-GlcNAcylation in H2O2-induced NP cells and IDD mice were determined by sWGA pull-down assay. (C-D) Changes in O-GlcNAcylation were detected in NP cells treated with 25 µM TMG or 20 µM OSMI-1 for 12 h. (E) Co-IP confirmed the interaction between YTHDF2 and OGT. (F) Co-localization of YTHDF2 and OGT, scale bar represents 25 μm (400×). (G) LC-MS analysis identified Ser263 as the O-GlcNAc site on YTHDF2. (H) Cross-species sequence alignment of YTHDF2. (I) sWGA assay was performed in NP cells transfected with plasmids encoding Flag-tagged YTHDF2 (WT, S262A, S263A, or T524A) using an anti-Flag antibody. (J) NP cells were transfected with Flag-tagged YTHDF2 (WT or S263A) and subjected to sWGA assay. Each experiment was repeated 3 times, n = 6 mice per group. * indicates differences between groups (P < 0.05)
Fig. 7
Fig. 7
O-GlcNAcylation stabilizes YTHDF2 by inhibiting its ubiquitination. Note: (A-B) NP cells were transfected with OGT shRNA lentivirus and treated with 2 µM cycloheximide (CHX) for the indicated periods. The half-life of YTHDF2 was determined by immunoblotting. (C-D) The half-life of Flag-YTHDF2 and quantitative analysis were performed in NP cells treated or untreated with 25 µM TMG. (E) In NP cells transfected with OGT shRNA lentiviral vector, in vivo ubiquitination of YTHDF2 was assessed under HA-tagged ubiquitin (HA-Ub) conditions. (F) NP cells transfected with Flag-YTHDF2 (WT or S263A) were treated with 25 µM TMG. Before harvest, cells were treated with 10 µM MG132 to prevent degradation. Immunoprecipitation of YTHDF2 was performed using YTHDF2 or Flag antibody. (G) in vitro ubiquitination of YTHDF2 was performed using purified Flag-tagged WT or S263A YTHDF2, His-OGT, SCFFBW7 E3 complex, E1, E2, Ub, and UDP-GlcNAc. The reaction products were subjected to immunoblotting, and YTHDF2 ubiquitination was detected using the YTHDF2 antibody. Each experiment was repeated 3 times. A two-way analysis of variance was conducted to compare the expression levels at different time points between the two groups. * indicates differences between groups (P < 0.05)
Fig. 8
Fig. 8
Regulation of NP cell proliferation and IDD mice by O-GlcNAcylation of YTHDF2. Note: (A-B) NP cells were induced for endogenous YTHDF2 knockdown by transfection with YTHDF2 shRNA lentiviral vector, followed by infection with plasmid vectors expressing Flag-YTHDF2 (WT or S263A). The senescence of NP cells was assessed by SA-β-gal staining and statistical analysis (Scale bar = 50 μm). (C-D) Flow cytometry was performed to determine the cell cycle distribution of NP cells, and statistical analysis was conducted. (E-F) Different lentiviruses were injected into IDD mice via the tail vein, and intervertebral discs were subjected to H&E and Safranin O staining. Corresponding images and statistical analysis were generated. Orange represents NP cells and collagen, and blue represents fibers (Scale bar = 50 μm). (G) Disc height index (DHI) of each group of mice. (H) NP cell proliferation capacity was assessed using CCK-8 assay. Each group of mice consisted of n = 6, and each experimental group was repeated 3 times. Expression levels at different time points were assessed using a two-way analysis of variance, and comparisons involving three groups were analyzed using a one-way analysis of variance. * indicates differences between groups (P < 0.05), n = 6 for NP cell experiments
Fig. 9
Fig. 9
Impact of YTHDF2 O-GlcNAcylation on CCNE1 transcript. Note: (A) Venn diagram was used to screen potential downstream target genes of YTHDF2. (B) mRNA changes of potential target genes were analyzed in NP cells transfected with YTHDF2 shRNA lentivirus. (C) YTHDF2-RIP-qPCR experiment showed an association between CCNE1 transcript and YTHDF2 in NP cells. (D-E) Changes in CCNE1 mRNA and protein levels after YTHDF2 knockdown or overexpression and treatment with 25 µM TMG or 20 µM OSMI-1. (F-H) CCNE1 mRNA half-life was determined in NP cells treated with control or YTHDF2 shRNA, followed by either 25 µM TMG treatment (F) or overexpression of YTHDF2 with 20 µM OSMI-1 treatment (G). CCNE1 mRNA half-life was also determined in NP cells transfected with Flag-tagged YTHDF2 (WT or S263A), using transcription inhibition by actinomycin D (5 µg/mL) (H). (I) Flow cytometry analysis was performed in NP cells transfected with different lentiviral vectors. Expressions at different time points were analyzed using a two-way analysis of variance, while pairwise group data were assessed with independent sample t-tests, and comparisons involving three groups were analyzed using a one-way analysis of variance.* indicates differences between groups (P < 0.05), n = 6 for NP cell experiments, and each experimental group was repeated 3 times
Fig. 10
Fig. 10
Attenuation of IDD Severity in Mice by TMG. Note: (A) Representative X-ray images of IDD mice and IDD + TMG mice; (B) Intervertebral disc height index (DHI) of mice in each group; (A) H&E and Safranin O staining of lumbar intervertebral discs with corresponding statistical graphs, where orange represents NP cells and collagen, blue represent fibers, and the scale bar in the images is 200 μm (200×); (D-E) Representative images and statistical graphs of immunohistochemical staining of lumbar intervertebral disc slices, with the scale bar at 50 μm (200×, top row) or 25 μm (200×, bottom row); (F) Protein expression levels in IDD mice and IDD + TMG mice detected by Western blot; n = 6 mice per group in the experiment. Expression levels at different time points were analyzed using repeated measures analysis of variance, with independent sample t-tests conducted for comparisons between two groups. * indicates differences between groups (P < 0.05)
Fig. 11
Fig. 11
Molecular Mechanism of O-GlcNAc Modification of YTHDF2 in Regulating Cell Cycle Participation in IDD Formation

Similar articles

Cited by

References

    1. Adan A, Alizada G, Kiraz Y, Baran Y, Nalbant A. Flow cytometry: basic principles and applications. Crit Rev Biotechnol. 2017;37(2):163–76. 10.3109/07388551.2015.1128876. - PubMed
    1. Ali AM, Kunugi H. Royal Jelly as an Intelligent Anti-aging Agent-A Focus on Cognitive Aging and Alzheimer’s disease: a review. Antioxid (Basel). 2020;9(10):937. 10.3390/antiox9100937. Published 2020 Sep 29. - PMC - PubMed
    1. Anand U, Shteinfer-Kuzmine A, Sela G, et al. The Multicellular effects of VDAC1 N-Terminal-derived peptide. Biomolecules. 2022;12(10):1387. 10.3390/biom12101387. Published 2022 Sep 28. - PMC - PubMed
    1. Arunachalam D, Ramanathan SM, Menon A et al. Expression of immune response genes in human corneal epithelial cells interacting with Aspergillus flavus conidia. BMC Genomics. 2022;23(1):5. Published 2022 Jan 5. 10.1186/s12864-021-08218-5. - PMC - PubMed
    1. Cao S, Liu H, Fan J, et al. An oxidative stress-related gene pair (CCNB1/PKD1), competitive endogenous RNAs, and Immune-infiltration patterns potentially regulate intervertebral disc Degeneration Development. Front Immunol. 2021;12:765382. 10.3389/fimmu.2021.765382. Published 2021 Nov 9. - PMC - PubMed

MeSH terms

LinkOut - more resources