

Income and education disparities in childhood malnutrition: a multi-country decomposition analysis
- PMID: 39425063
- PMCID: PMC11490161
- DOI: 10.1186/s12889-024-20378-z
Income and education disparities in childhood malnutrition: a multi-country decomposition analysis
Abstract
Introduction: Childhood malnutrition is a complex issue with a range of contributing factors. The consequences of malnutrition are severe, particularly for children. This study aims to identify the factors contributing to inequality gaps in childhood malnutrition. Our study provides insights into modifiable elements to inform interventions targeted at distinct contexts and populations to improve child nutrition.
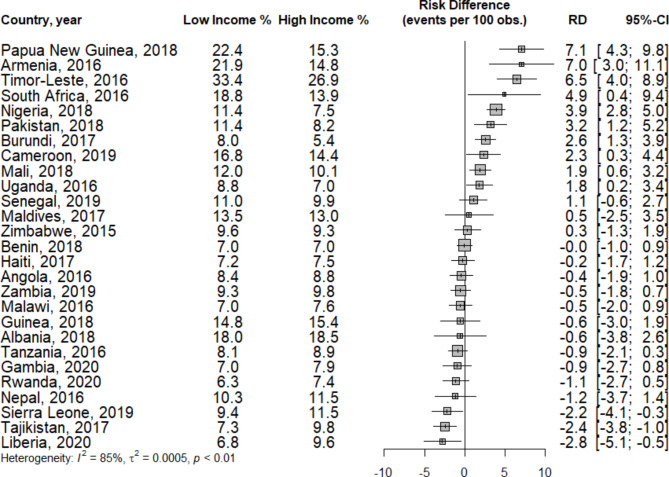
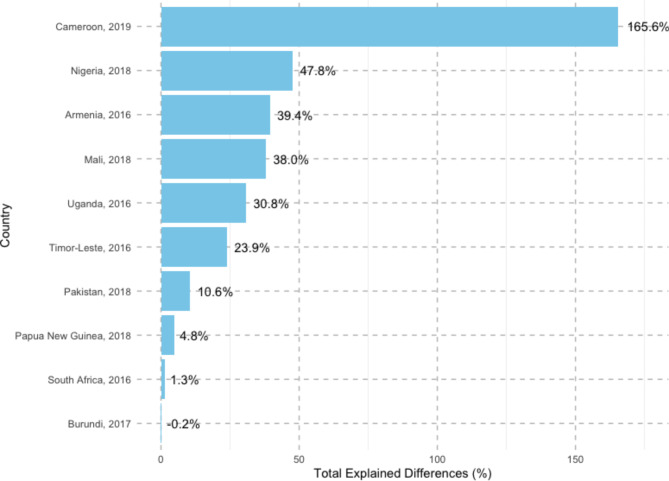
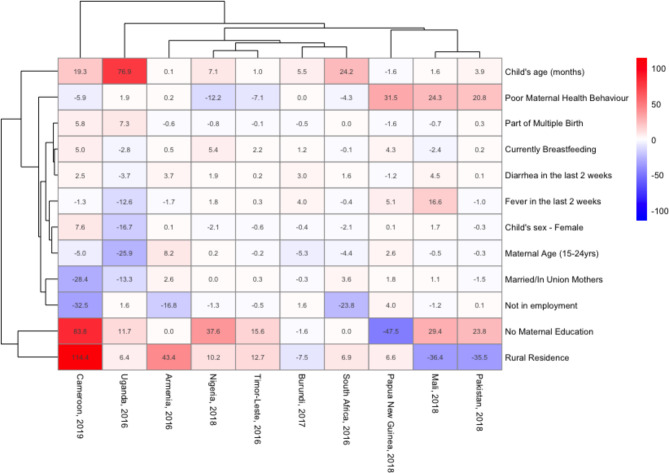
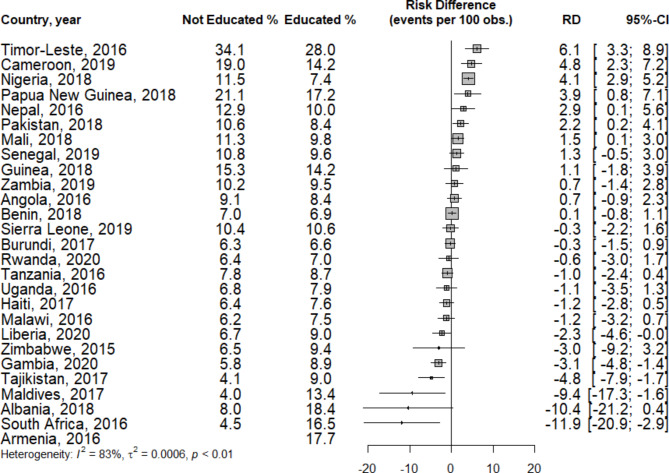
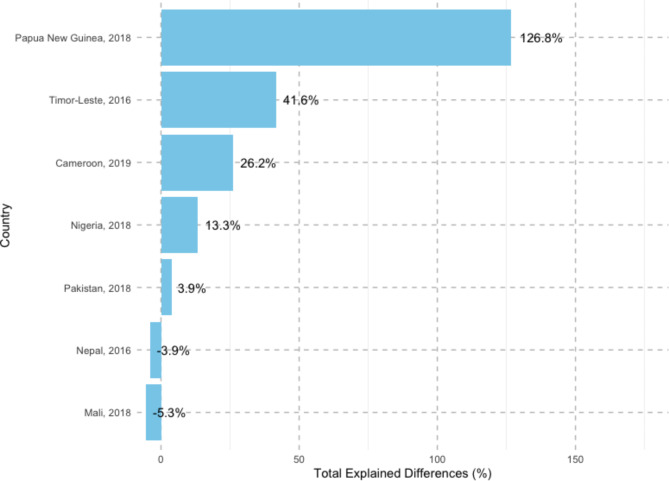
Methods: This study utilized data from the Demographic and Health Surveys (DHS) of 27 countries. First, the risk differences (RDs) between the prevalence of childhood malnutrition among the determinant variables, household income, and maternal education categories were calculated. The Blinder‒Oaxaca decomposition was subsequently used to determine the extent to which the difference in childhood malnutrition prevalence between low-income and high-income groups and maternal education levels results from the contributory effects of the explanatory variables: child and maternal individual-level compositional factors.
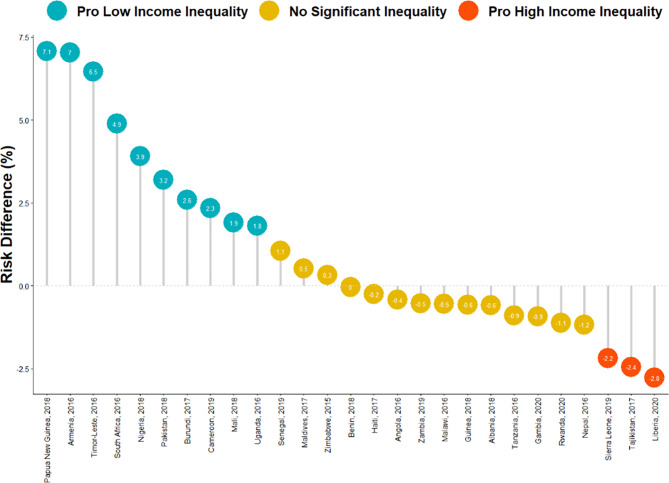
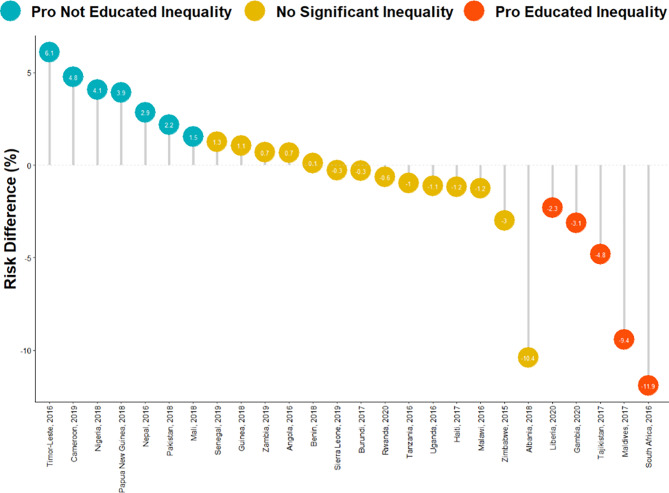
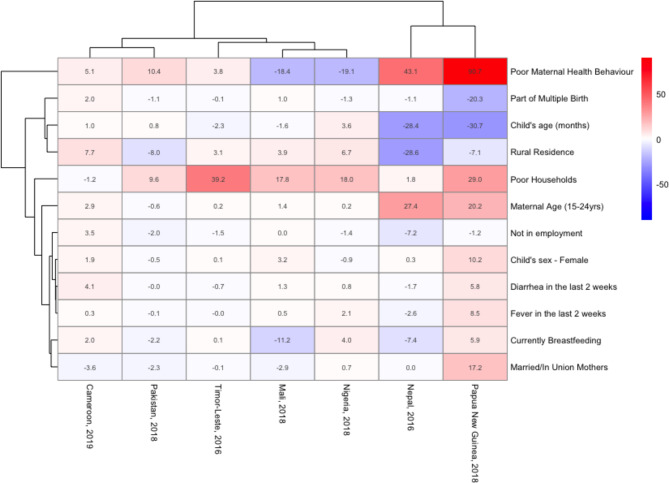
Results: We examined data from 138,782 children in 27 countries from 2015 to 2020. The prevalence of childhood malnutrition (10.5%) varied across countries, ranging from 6.5% in Burundi to 29.5% in Timor Leste. On average, the prevalence of childhood malnutrition was 11.0% in low-income households and 10.7% among mothers without education. Some nations had pro-low-income (i.e., malnutrition concentrated among children from poor households) or pro-no-maternal education (i.e., malnutrition concentrated among children from mothers with no formal education) inequality in childhood malnutrition, but most did not. We found a complex interplay of compositional effects, such as the child's age, maternal education, maternal health behavior, and place of residence, that influence the inequality in childhood malnutrition rates across 10 pro-low-income countries. In addition, we also found that a complex mix of compositional effects, such as the household wealth index, maternal health behavior, and maternal age, contribute to childhood malnutrition inequality between educated and uneducated mothers across the 7 pro-no maternal education countries.
Conclusion: The prevalence of childhood malnutrition varies among low-income, high-income, and no maternal education-maternal education groups. This study highlights the need for a country-specific approach to addressing childhood malnutrition, with policies and interventions tailored to each country's specific context.
Keywords: Child; Education; Income; Malnutrition.
© 2024. The Author(s).
Conflict of interest statement
The authors declare no competing interests.
Figures
References
-
- UNICEF. State of the World’s children 2019: children, food and nutrition. Unicef. 2019. 1–258 p.
-
- Poda GG, Hsu CY, Chao JCJ. Factors associated with malnutrition among children < 5 years old in Burkina Faso: evidence from the demographic and health surveys IV 2010. Int J Qual Health Care. 2017;29(7):901–8. - PubMed
-
- FAO, IFAD, UNICEF, WFP, WHO. Food Security and Nutrition in the World the State of Building Climate Resilience for Food Security and Nutrition. Volume 7. Food and Agriculture Organization of the United Nations; 2018. pp. 820–1.