

Upper respiratory microbial communities of healthy populations are shaped by niche and age
- PMID: 39425237
- PMCID: PMC11490146
- DOI: 10.1186/s40168-024-01940-8
Upper respiratory microbial communities of healthy populations are shaped by niche and age
Abstract
Background: Alterations in upper respiratory microbiomes have been implicated in shaping host health trajectories, including by limiting mucosal pathogen colonization. However, limited comparative studies of respiratory microbiome development and functioning across age groups have been performed. Herein, we perform shotgun metagenomic sequencing paired with pathogen inhibition assays to elucidate differences in nasal and oral microbiome composition and intermicrobial interactions across healthy 24-month-old infant (n = 229) and adult (n = 100) populations.
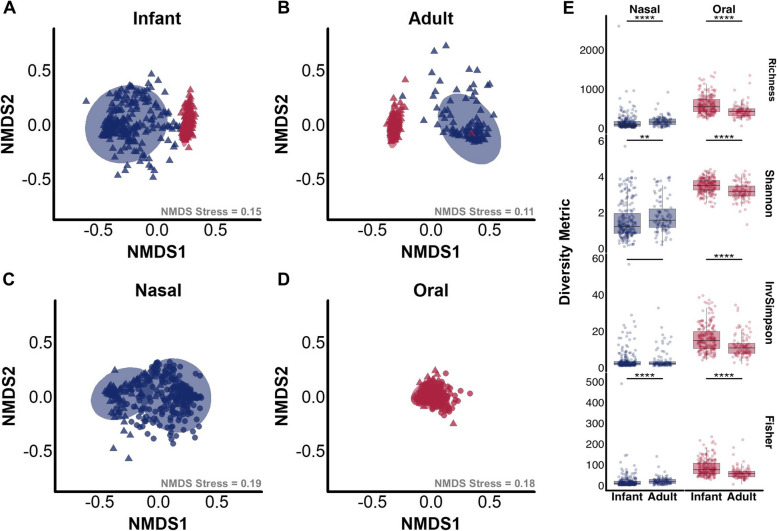
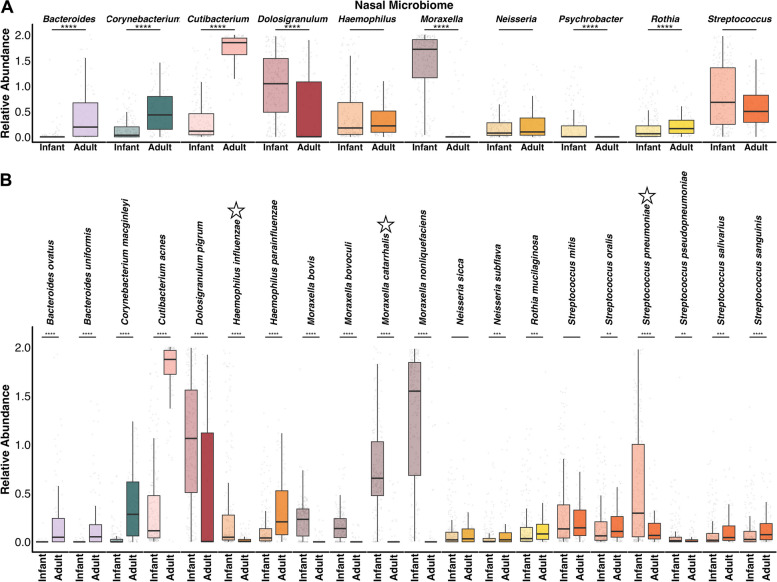
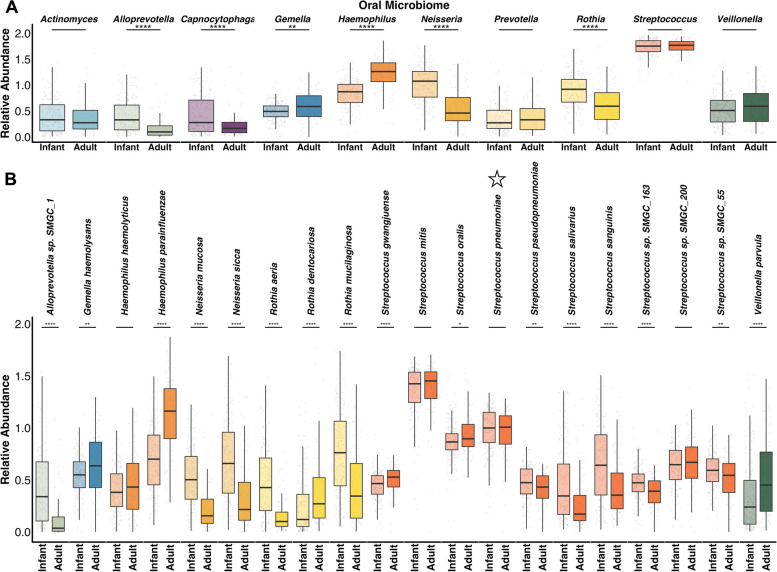
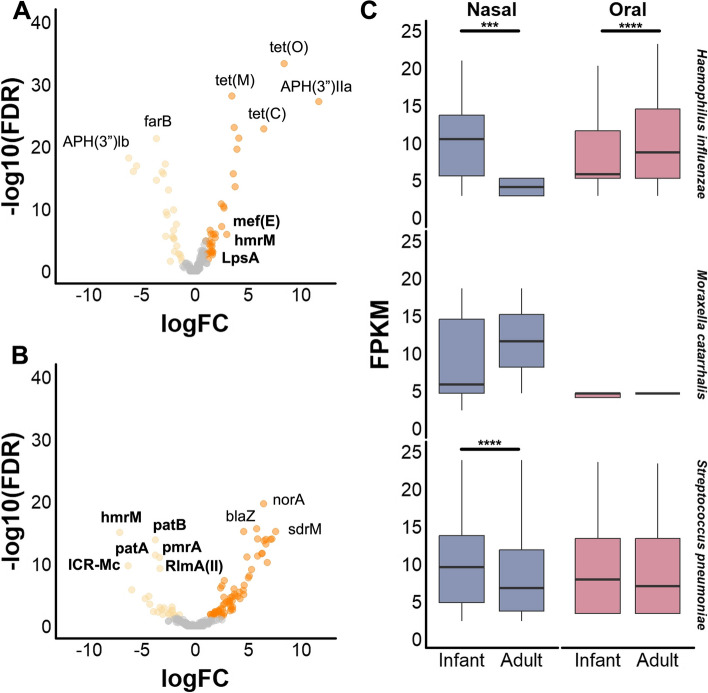
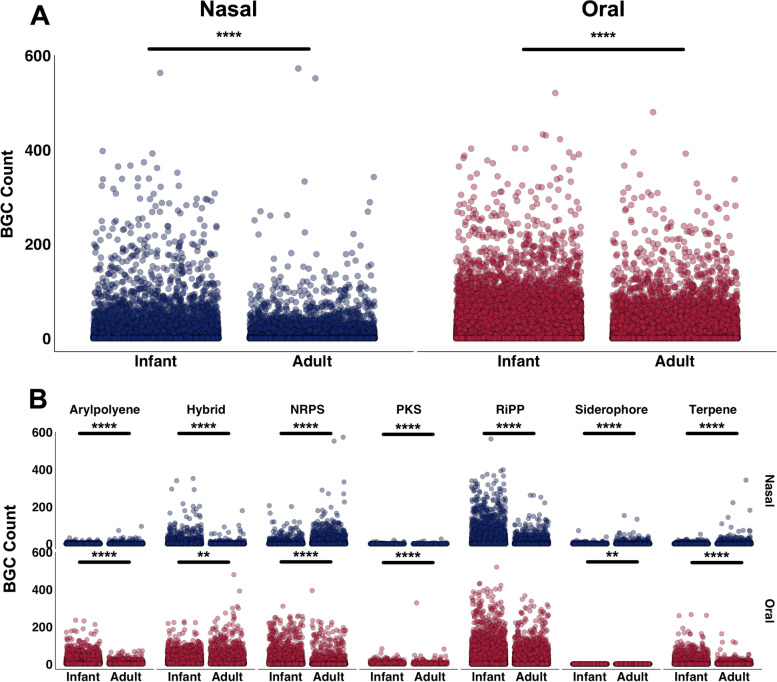
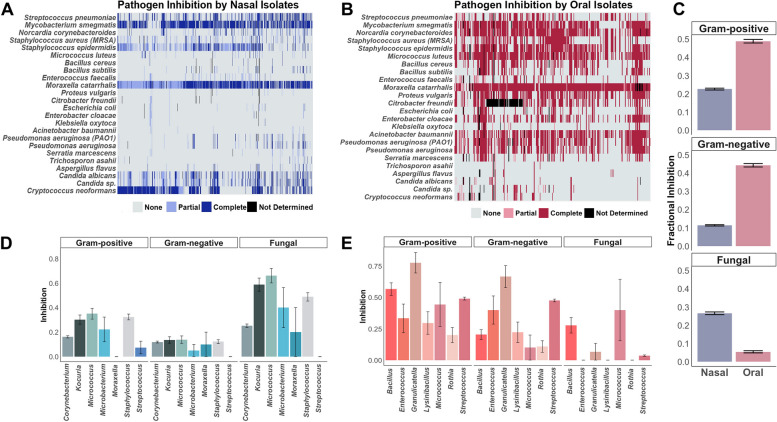
Results: We find that beta diversity of nasal and oral microbiomes varies with age, with nasal microbiomes showing greater population-level variation compared to oral microbiomes. Infant microbiome alpha diversity was significantly lower across nasal samples and higher in oral samples, relative to adults. Accordingly, we demonstrate significant differences in genus- and species-level composition of microbiomes between sites and age groups. Antimicrobial resistome patterns likewise varied across body sites, with oral microbiomes showing higher resistance gene abundance compared to nasal microbiomes. Biosynthetic gene clusters encoding specialized metabolite production were found in higher abundance across infant oral microbiomes, relative to adults. Investigation of pathogen inhibition revealed greater inhibition of gram-negative and gram-positive bacteria by oral commensals, while nasal isolates had higher antifungal activity.
Conclusions: In summary, we identify significant differences in the microbial communities inhabiting nasal and oral cavities of healthy infants relative to adults. These findings inform our understanding of the interactions impacting respiratory microbiome composition and functions related to colonization resistance, with important implications for host health across the lifespan. Video Abstract.
© 2024. The Author(s).
Conflict of interest statement
The authors declare no competing interests.
Figures
Update of
-
Upper respiratory microbial communities of healthy populations are shaped by niche and age.bioRxiv [Preprint]. 2024 Apr 14:2024.04.14.589416. doi: 10.1101/2024.04.14.589416. bioRxiv. 2024. Update in: Microbiome. 2024 Oct 18;12(1):206. doi: 10.1186/s40168-024-01940-8. PMID: 38645133 Free PMC article. Updated. Preprint.
Similar articles
-
Upper respiratory microbial communities of healthy populations are shaped by niche and age.bioRxiv [Preprint]. 2024 Apr 14:2024.04.14.589416. doi: 10.1101/2024.04.14.589416. bioRxiv. 2024. Update in: Microbiome. 2024 Oct 18;12(1):206. doi: 10.1186/s40168-024-01940-8. PMID: 38645133 Free PMC article. Updated. Preprint.
-
Altered nasal and oral microbiomes define pediatric sickle cell disease.mSphere. 2025 Jun 25;10(6):e0013725. doi: 10.1128/msphere.00137-25. Epub 2025 May 14. mSphere. 2025. PMID: 40366139 Free PMC article.
-
Nepali oral microbiomes reflect a gradient of lifestyles from traditional to industrialized.Microbiome. 2024 Nov 4;12(1):228. doi: 10.1186/s40168-024-01941-7. Microbiome. 2024. PMID: 39497165 Free PMC article.
-
Comparison of Respiratory Microbiomes in Influenza Versus Other Respiratory Infections: Systematic Review and Analysis.Int J Mol Sci. 2025 Jan 17;26(2):778. doi: 10.3390/ijms26020778. Int J Mol Sci. 2025. PMID: 39859492 Free PMC article.
-
The effect of sample site and collection procedure on identification of SARS-CoV-2 infection.Cochrane Database Syst Rev. 2024 Dec 16;12(12):CD014780. doi: 10.1002/14651858.CD014780. Cochrane Database Syst Rev. 2024. PMID: 39679851 Free PMC article.
Cited by
-
Fungal Diversity and Interactions in the Nasal and Oral Cavities of Individuals with Allergic Rhinitis, Asthma and Healthy Controls.Microorganisms. 2025 May 25;13(6):1204. doi: 10.3390/microorganisms13061204. Microorganisms. 2025. PMID: 40572092 Free PMC article.
-
The porcine skin microbiome exhibits broad fungal antagonism.Fungal Genet Biol. 2024 Aug;173:103898. doi: 10.1016/j.fgb.2024.103898. Epub 2024 May 28. Fungal Genet Biol. 2024. PMID: 38815692 Free PMC article.
-
Revisiting the cancer microbiome using PRISM.bioRxiv [Preprint]. 2025 Jan 24:2025.01.21.634087. doi: 10.1101/2025.01.21.634087. bioRxiv. 2025. PMID: 39896561 Free PMC article. Preprint.
References
-
- Gonzalez-Martin C. Airborne infectious microorganisms. Encycl Microbiol (4th Edn). Academic Press; 2019. p. 52–60.
MeSH terms
Grants and funding
LinkOut - more resources
Full Text Sources
