. 2025 Mar 6;37(4):203-220.
doi: 10.1093/intimm/dxae063.

JunB is required for CD8+ T cell responses to acute infections

Affiliations

JunB is required for CD8+ T cell responses to acute infections

Shukla Sarkar et al. Int Immunol. .

Abstract

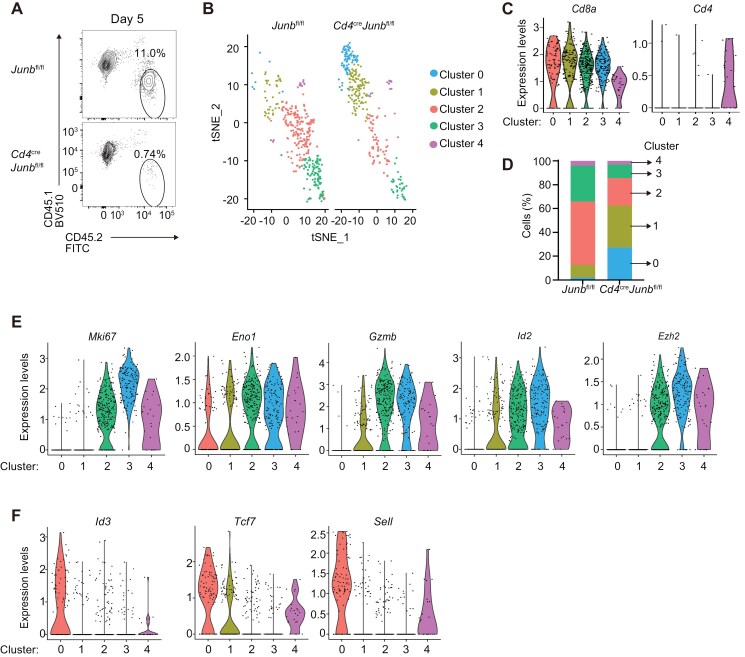
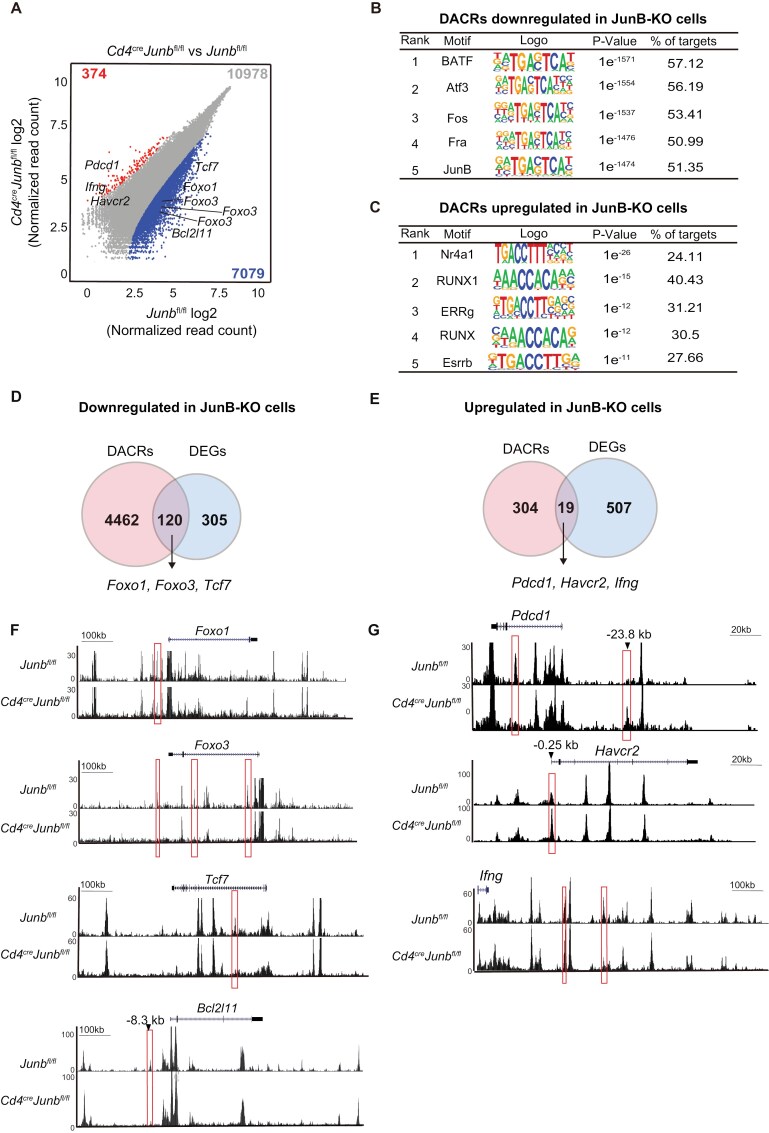
Basic-leucine zipper transcription factor ATF-like (BATF) and interferon regulatory factor 4 (IRF4) are crucial transcription factors for the generation of cytotoxic effector and memory CD8+ T cells. JunB is required for expression of genes controlled by BATF and IRF4 in CD4+ T cell responses, but the role of JunB in CD8+ T cells remains unknown. Here, we demonstrate that JunB is essential for cytotoxic CD8+ T cell responses. JunB expression is transiently induced, depending on the T cell receptor signal strength. JunB deficiency severely impairs the clonal expansion of effector CD8+ T cells in response to acute infection with Listeria monocytogenes. Junb-deficient CD8+ T cells fail to control transcription and chromatin accessibility of a specific set of genes regulated by BATF and IRF4, resulting in impaired cell survival, glycolysis, and cytotoxic CD8+ T cell differentiation. Furthermore, JunB deficiency enhances the expression of co-inhibitory receptors, including programmed cell death 1 (PD-1) and T cell immunoglobulin mucin-3 (TIM3) upon activation of naive CD8+ T cells. These results indicate that JunB, in collaboration with BATF and IRF4, promotes multiple key events in the early stage of cytotoxic CD8+ T cell responses.

Keywords: AP-1; apoptosis; co-inhibitory molecules; effector and memory CD8+ T cells; glycolysis.


Figures

Graphical Abstract
Graphical Abstract
Figure 1.
Figure 1.
JunB expression is induced in CD8+ T cells activated in response to L. monocytogenes infection. (A, B) OT-I T cells (CD45.2+) were transferred into congenic recipient mice (CD45.1+), followed by LM-OVA infection. Cells isolated from the spleen on Days 4 and 7 p.i. were subjected to flow cytometry analysis. (A) Left: representative histograms showing expression of JunB in activated OT-I T cells (CD45.2+ CD44hi) or recipient naive CD8+ T cells (CD45.1+ CD44lo). Right: graph showing MFI of JunB expression. (B) Left: plots showing expression of JunB and BATF, or JunB and IRF4 in OT-I T cells gated on CD45.2+ and that in recipient CD8+ T cells gated on CD45.2. Right: graph showing percentages of cells co-expressing JunB and BATF or IRF4. Error bars indicate 1 SD (n = 3–4). *P < .01, ***P < .001, ****P < .0001 (unpaired two-tailed Student’s test). Data are representative of two independent experiments. (C) OT-I T cells were stimulated with irradiated splenocytes pulsed with an OVA-derived peptide (N4) or its variants (T4 or Q4H7). At 24 h after activation, JunB expression was analyzed by flow cytometry. (D) Naive CD8+ T cells were activated by anti-CD3 antibody with or without anti-CD28 antibody in the presence or absence of cytokines IL-2 or IL-12. At 24 h after activation, JunB expression was analyzed by flow cytometry. (E) Naive CD8+ T cells were activated by anti-CD3 antibody with or without anti-CD28 antibody in the presence of pharmacological inhibitors for JNK (JNKi), PI3K (PI3Ki), or mTOR (rapamycin). At 24 h post activation, JunB expression was analyzed by flow cytometry. (C–E) Left: flow cytometry histograms showing JunB expression. Right: graph showing mean fluorescence intensity (MFI) of JunB expression. Error bars indicate SD (n = 3). **P < .01, ***P < .001, ****P < .0001, ns: not significant (one-way ANOVA with Bonferroni’s multiple comparison tests). Data are representative of two independent experiments. ANOVA, analysis of variance.
Figure 2.
Figure 2.
JunB is required for clonal expansion of CD8+ T cells in response to L. monocytogenes infection. (A) Control (Junbfl/fl) or Junb-deficient (Junbfl/flCd4Cre) mice were infected with LM-OVA (5 × 103 CFU). On Day 7, cells were isolated from the spleen and subjected to flow cytometry analysis of binding to OVA tetramer. Left: representative plots showing binding of OVA tetramers (H-2Kb-restricted OVA tetramer) and expression of CD44 in cells gated on CD3+ CD8+. Right: graphs showing proportions of H-2Kb-restricted OVA tetramer+ CD44+ cells in CD8+ T cells (top) and their absolute numbers (bottom). Error bars indicate SD (n = 4 per group). (B–E) Control (Junbfl/fl) or Junb-deficient (Junbfl/flCd4Cre) OT-I T cells (CD45.1 CD45.2+) (1 × 104 cells) were transferred with an equal number of wild-type OT-I T cells (CD45.1+ CD45.2+) into congenic recipient mice (CD45.1+ CD45.2), followed by infection with LM-OVA. At the indicated time points, cells were isolated from the spleen and subjected to flow cytometry analysis. (B) Schematic showing the experimental design. (C) Flow cytometry analysis of the frequency of OT-I T cells (gated on CD3+CD8+ T cells) on Days 7, 14, and 40. Left: representative plots showing expression of CD45.1 and CD45.2. Numbers next to the outlined areas indicate the percentage of cells expressing the surface markers. Right: graphs showing the ratio of Junbfl/fl or Cd4creJunbfl/fl OT-I T cells (CD45.1 CD45.2+) versus co-transferred OT-I T cells (CD45.1+CD45.2+). Error bars indicate SD (n = 4 per group). (D) Flow cytometry analysis of expression of Bim and active Caspase 3 in OT-I T cells on Day 5. Left: representative plots showing expression of Bim (top) or active Caspase 3 (bottom). Right: graphs showing percentages of OT-I T cells expressing Bim (top) or active Caspase 3 (bottom). Error bars indicate SD (n = 3–6 per group). (E) Flow cytometry analysis of expression of KLRG1 and CD127 in OT-I T cells on Day 7. Left: representative plots. Right: graphs showing percentages of SLECs (KLRG1hiCD127lo) and MPECs (KLRG1loCD127hi). Error bars indicate SD (n = 3–4 per group). (A, C–E) *P < .05, **P < .01, ****P < .0001 (unpaired two-tailed Student’s t-test). Data represent two independent experiments.
Figure 3.
Figure 3.
JunB is critical to generate proliferating effector CD8+ T cells. Control (Junbfl/fl) or Junb-deficient (Junbfl/flCd4Cre) OT-I T cells (CD45.2+) were transferred into congenic recipient mice (CD45.1+), followed by infection with LM-OVA. On Day 5, living OT-I T cells (CD45.2+) were sorted from splenocytes and subjected to scRNA-seq analysis. t-SNE clustering analysis was performed using pooled scRNA-seq data of control and Junb-deficient OT-I T cells. (A) Flow cytometry plots showing the frequency of OT-I T cells (CD45.2+) before sorting. (B) t-SNE clustering detected five clusters (Clusters 0–4). (C) Violin plots showing Cd8a and Cd4 expression in each cluster. (D) Stacked bar charts showing percentages of cells in each cluster. Violin plots showing expression of representative genes highly expressed in Clusters 2 and 3 (E) and those highly expressed in Clusters 0 and/or 1 (F). Each gene name is shown on the plots.
Figure 4.
Figure 4.
JunB promotes survival of naive CD8+ T cells activated with strong stimulatory signals in vitro. Control (Junbfl/fl) or Junb-deficient (Junbfl/flCd4Cre) naive CD8+ T cells were activated with anti-CD3, anti-CD28, IL-2, and IL-12 in vitro. (A) Cell proliferation was analyzed by flow cytometry. Prior to activation, naive CD8+ T cells were stained with cell trace violet (CTV), and CTV dilution was analyzed on Days 1, 2, and 3 after activation. (B) Expression of Bim and active Caspase 3 at 48 h after activation was analyzed by flow cytometry. Left: representative histograms. Right: graphs showing percentages of cells expressing Bim (upper panel) and active Caspase 3 (lower panel). (C) Cell viability at 72 h after activation was analyzed by flow cytometry of cells stained with Zombie-NIR dye. Left: representative histograms. Right: graph showing percentages of dead cells stained with Zombie-NIR. (D) ECAR was measured using seahorse analysis. Cells activated for 48 h were placed on a Seahorse assay plate and were incubated with sequential injections of glucose, oligomycin, and 2-DG. Left: kinetics of ECAR. Right: graphs showing ECAR in basal glycolysis and glycolytic capacity. (E) OCR was measured using seahorse analysis. Cells activated for 48 h were placed on a Seahorse assay plate and were incubated with sequential injections of oligomycin, FCCP, and rotenone/antimycin. Left: kinetics of OCR. Right: graphs showing OCR in basal and maximal respiration. (B–E) Error bars indicate SD (n = 3). *P < .05, **P < .01, ***P < .001, ****P < .0001 (unpaired two-tailed Student’s t-test). Data are representative of two independent experiments. FCCP, fluorocarbon cyanide phenylhydrazone.
Figure 5.
Figure 5.
JunB regulates the expression of genes associated with CD8+ T cell responses. Control (Junbfl/fl) or Junb-deficient (Junbfl/flCd4Cre) naive CD8+ T cells were activated by anti-CD3 and anti-CD28 antibodies, IL-2, and IL-12 in vitro for 48 or 96 h and subjected to RNA-seq analysis (n = 3–4). (A) Mean average plots of DEGs between control and Junb-deficient cells (log2 fold change >0.5 or <−0.5, adjusted P value <.05). Significantly upregulated and downregulated genes in Junb-deficient cells are marked. DEG numbers and names of representative genes are shown; genes downregulated by JunB deficiency are shown in purple, upregulated genes in orange, and unchanged genes in black. (B) Enrichr pathway analysis of DEGs at 96 h. (C) Venn diagrams show the relationship between genes regulated by JunB and IRF4 (upper panel) and BATF (lower panel). DEGs in Junb-deficient CD8+ T cells were compared with genes affected by deficiency of BATF and IRF4 (obtained from previous studies, GSE49929, GSE54215). (D) Heat map showing DEGs related to cytokines and cytolytic molecules, genes related to glycolysis, and differentiation/activation of effector and memory CD8+ T cells. (E) Venn diagrams showing DEGs in Junb-deficient CD8+ T cells, categorized by whether they were bound by JunB or BATF.
Figure 6.
Figure 6.
JunB controls the expression of co-inhibitory and co-stimulatory receptors. Naive Control (Junbfl/fl) or Junb-deficient (Junbfl/flCd4Cre) naive CD8+ T cells were activated by anti-CD3 and anti-CD28 antibodies, IL-2, and IL-12 in vitro for 96 h. Flow cytometry analysis of co-inhibitory receptors, PD-1, TIM3, TIGIT, and CD160 (A), and co-stimulatory receptor CD28 (B). Error bars indicate SD (n = 3). ***P < .001, ****P < .0001 (unpaired two-tailed Student’s t-test). Data are representative of two independent experiments.
Figure 7.
Figure 7.
JunB governs chromatin accessibility to regulate a subset of transcriptional regulatory target genes. Control (Junbfl/fl) or Junb-deficient (Junbfl/flCd4Cre) naive CD8+ T cells were activated by anti-CD3 and anti-CD28 antibodies, IL-2, and IL-12 in vitro for 96 h and subjected to ATAC-seq analysis. (A) Scatterplot showing DACRs in Junb-deficient CD8+ T cells vs control cells (log2 fold change >0.5, false discover rate <0.05). Chromatin-accessible regions with decreased accessibility and increased accessibility in Junb-deficient cells are marked. Numbers on the plot represent total counts of chromatin-accessible regions (in gray), along with those exhibiting decreased accessibility (in blue) and increased accessibility (in red) in Junb-deficient CD8+ cells. Motif enrichment analysis of DACRs with decreased (B) or increased (C) accessibility in Junb-deficient CD8+ T cells. Venn diagrams illustrate the overlap between DACRs with increased accessibility and upregulated DEGs in Junb-deficient CD8+ T cells (D), as well as DACRs with decreased accessibility and downregulated DEGs (E). Genome browser images showing downregulated DACRs at the Bcl2l11, Foxo1, Foxo3, Tcf7, and Bcl2l11 loci (F) and upregulated DACRs at the Pdcd1, Havcr2, and Ifng loci (G) in Junb-deficient cells. DACRs affected by JunB deficiency are marked with red boxes.

References

    1. Reina-Campos M, Scharping NE, Goldrath AW.. CD8(+) T cell metabolism in infection and cancer. Nat Rev Immunol 2021;21:718–38. https://doi.org/10.1038/s41577-021-00537-8 - DOI - PMC - PubMed
    1. Williams MA, Bevan MJ.. Effector and memory CTL differentiation. Annu Rev Immunol 2007;25:171–92. https://doi.org/10.1146/annurev.immunol.25.022106.141548 - DOI - PubMed
    1. Cui W, Kaech SM.. Generation of effector CD8+ T cells and their conversion to memory T cells. Immunol Rev 2010;236:151–66. https://doi.org/10.1111/j.1600-065X.2010.00926.x - DOI - PMC - PubMed
    1. Kaech SM, Wherry EJ.. Heterogeneity and cell-fate decisions in effector and memory CD8+ T cell differentiation during viral infection. Immunity 2007;27:393–405. https://doi.org/10.1016/j.immuni.2007.08.007 - DOI - PMC - PubMed
    1. Joshi NS, Cui W, Chandele A, et al.Inflammation directs memory precursor and short-lived effector CD8(+) T cell fates via the graded expression of T-bet transcription factor. Immunity 2007;27:281–95. https://doi.org/10.1016/j.immuni.2007.07.010 - DOI - PMC - PubMed

Publication types

MeSH terms

Substances