. 2024 Oct 20;15(1):9050.
doi: 10.1038/s41467-024-53233-1.

Iron-loaded cancer-associated fibroblasts induce immunosuppression in prostate cancer

Affiliations

Iron-loaded cancer-associated fibroblasts induce immunosuppression in prostate cancer

Kai Zhang et al. Nat Commun. .

Abstract

Iron is an essential biomineral in the human body. Here, we describe a subset of iron-loaded cancer-associated fibroblasts, termed as FerroCAFs, that utilize iron to induce immunosuppression in prostate cancer and predict an unfavorable clinical outcome. FerroCAFs secrete myeloid cell-associated proteins, including CCL2, CSF1 and CXCL1, to recruit immunosuppressive myeloid cells. We report the presence of FerroCAFs in prostate cancer from both mice and human, as well as in human lung and ovarian cancers, and identify a conserved cell surface marker, the poliovirus receptor. Mechanistically, the accumulated iron in FerroCAFs is caused by Hmox1-mediated iron release from heme degradation. The intracellular iron activates the Kdm6b, an iron-dependent epigenetic enzyme, to induce an accessible chromatin state and transcription of myeloid cell-associated protein genes. Targeting the FerroCAFs by inhibiting the Hmox1/iron/Kdm6b signaling axis incurs anti-tumor immunity and tumor suppression. Collectively, we report an iron-loaded FerroCAF cluster that drives immunosuppression through an iron-dependent epigenetic reprogramming mechanism and reveal promising therapeutic targets to boost anti-tumor immunity.


Conflict of interest statement

The authors declare no competing interests.

Figures
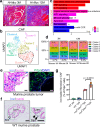
Fig. 1
Fig. 1. A subset of iron-related CAFs is positively correlated with PCa disease progression.
a Masson’s Trichrome staining reveals collagens and extracellular matrix deposition (blue) in Hi-Myc GEMM prostate tumors from the 3-month-old (n = 3 mice) and 12-month-old (n = 3 mice) hosts. Scale bar = 200  μm. b The UMAP plot shows the re-clustered CAF population in the 3-month-old (n = 2 mice) and 12-month-old (n = 2 mice) Hi-Myc GEMM prostate tumors, identifying 5 clusters of CAF subsets. Cluster 1-CAFs (pink) were pinpointed by dashed line. c KEGG analysis of scRNA-seq data shows that two iron-associated molecular traits are enriched in Cluster-1 CAFs. The scRNA data were from the prostate tumors of 3-month-old (n = 2 mice) and 12-month-old (n = 2 mice) Hi-Myc GEMM mice. d Bar charts based on our scRNA-seq data demonstrate the proportions of 5 subsets of CAF in Hi-Myc tumors of 3-month-old (3M, n = 2 mice) and 12-month-old (12M, n = 2 mice) hosts and reveal the change of each CAF subpopulation during disease progression. e Prussian Blue Iron Staining (left) and IF staining (right) on serial mycHiptenΔ/Δ GEMM prostate tumor sections identifying iron-enriched stromal like cells are mostly positive for Pdpn expression. n = 3 mice. Scale bar = 100 μm. f Prussian Blue Iron Staining demonstrates that iron-enriched fibroblast cells are scarcely presented in WT C57BL/6 murine prostates. n = 4 mice. Scale bar = 50 μm. g Quantification of the percentage of iron-enriched fibroblast or CAFs in Pdpn+ cells in 3-month-old and 12-month-old mycHiptenΔ/Δ prostate tumors and their age-matched WT prostates, n = 4 mice. For statistics in this figure, the two-tail unpaired Student’s-t test was applied for (g), and data were shown as means ± SD. Source data are provided as a Source Data file.
Fig. 2
Fig. 2. The frequency of iron-loaded CAFs in different PCa stages.
ac IF images show three distinct histological regions including Pan-CK-VIM+ CAF region, pan-CK+VIM- tumor area and pan-CK+VIM+ EMT tumor regions in PCa specimens with a high Gleason (HG) Score (GS ≥ 8). n = 7 patients. Scale bar = 100 μm. d Prussian Blue Iron staining on a serial PCa clinical tumor section of (ac) reveals the distribution of iron-enriched cells across the PCa section. n = 7 patients. Scale bar = 100 μm. Prussian Blue Iron staining and IF staining images identify the iron-loaded cells are mainly presented in CAF (e) regions, but are scarce in Tumor (f) or EMT-tumor (g) regions. n = 7 patients. Scale bar = 5 μm. (h) Quantification of the iron-loaded cell percentage in CAF, Tumor, and EMT-Tumor regions of HG-PCa clinical specimens. n = 7 patients. DAB-enhanced Prussian Blue Iron staining images showing the presentation of iron-loaded fibroblasts or iron-loaded CAFs (brown) in the stroma of tumor adjacent normal region (I), Benign prostatic hyperplasia (BPH) (j), low Gleason Score Grading (LG-HSPC) (k) and high Gleason Score Grading (l) hormone sensitive prostate cancer (HG-HSPC) tissues. Scale bar = 100 μm. m Quantification of iron-loaded fibroblasts or CAFs in Normal (n = 7 patients), BPH (n = 6 patients), LG-HSPC (n = 7 patients) and HG-HSPC (n = 7 patients) sections. n DAB-enhanced Prussian Blue Iron Staining showing that the iron-loaded stromal like fibroblasts (brown) were even presented in 4 out of 7 cases of core needle punctured metastatic castration resistant prostate cancers (mCRPC, n = 7 patients). Scale bar = 100 μm. For statistics in this figure, the one-way ANOVA test was applied for statistical analyses in (h) and (m). Source data are provided as a Source Data file.
Fig. 3
Fig. 3. The iron-loaded FerroCAFs express Pvr and genes encoding myeloid cell associated secretory proteins (MASP).
a IF co-staining of Pvr and Pdpn on the mycHiptenΔ/Δ prostate tumor sections, unraveling the existence of Pvr+ FerroCAFs. n = 3 mice. Scale bar = 5 μm. IHC in combined with conventional Prussian Blue Iron staining assay reveal the iron-loaded signature of Pvr+ (b) Pdpn+ (c) CAFs in serial mycHiptenΔ/Δ tumor sections. n = 3 mice. Scale bar = 5 μm. Ferro-Orange probe detects the intracellular Fe2+ in FACS-isolated Lineage negative (Lin-) Pvr-/lo and Lin-Pvr+ CAFs from mycHiptenΔ/Δ prostate tumors (d). Quantification of Ferro-Orange median fluorescent intensity (MFI, e, n = 3 mice). f Heatmap of our scRNA-seq data showing that the most upregulated differentially expressed genes (DEGs) in Cluster-1 FerroCAFs include many MASP genes versus other CAF subsets (n = 2 Hi-Myc mice, 3 and 12-month-old, respectively). g RT-qPCR confirming the upregulation of MASP genes in FACS-sorted Lin-Pvr+ FerroCAFs versus Lin-Pvr-/lo non-FerroCAFs from 3 mycHiptenΔ/Δ mice. h Co-IF-staining of Csf1/Vim and Ccl2/Vim on FACS-sorted Lin-Pvr-/lo CAFs and Lin-Pvr+ FerroCAFs from mycHiptenΔ/Δ prostate tumors (n = 3 mice). Scale bar = 10 μm. i Heatmap demonstrating a strongest cell-cell interaction between FerroCAFs and myeloid cells among other cell components (n = 2 Hi-Myc mice, 3 and 12-month-old, respectively). RT-qPCR results showing increased immunosuppressive genes including Arg1 (j), Tgfb (k) and Il10 (l) in Raw264.7 monocytes upon the stimulation of Lin-Pvr+ FerroCAFs-conditional medium (CM) compared to Lin-Pvr-/lo CAF-CM-treated cells. The Pvr+ and Pvr-/lo CAFs were FACS-isolated from the tumors of 3 mycHiptenΔ/Δ mice (n = 3 mice). m Immunoblots confirm the activation of Erk and Stat3 triggered by Csf1/Csfr and Cxcl1/Cxcr2 signaling, upon Lin-Pvr+ FerroCAFs-CM treatment in Raw264.7 monocytes. The Pvr+ and Pvr-/lo CAFs were FACS-purified from the tumors of mycHiptenΔ/Δ mice (n = 3 mice). For statistics in this figure, the two-tail unpaired Student’s-t test was used in (e), (g), and (jk), and data were shown as means ± SD. Source data are provided as a Source Data file.
Fig. 4
Fig. 4. The iron-loaded phenotype and MASP expression in FerroCAFs is dependent on upregulated Hmox1.
UMAP plots based on our scRNA-seq data demonstrate the mRNA levels of Tfrc (a), Slc11a2 (b), Slc40a1 (c) and Hmox1 (d) in 5 CAF subsets, revealing that Hmox1 (d) is upregulated in Cluster-1 FerroCAFs compared to other subsets. The Cluster-1 FerroCAFs were pinpointed by dashed lines (n = 2 Hi-Myc mice, 3 and 12-month-old, respectively). e RT-qPCR data validate the selective upregulation of Hmox1 in FACS-sorted Lin-Pvr-/lo non-FerroCAFs and Lin-Pvr+ FerroCAFs, respectively (n = 3 mice, biological replicates). Flow cytometric analyses (f) and quantification results (g) show a decreased intracellular Fe2+ level upon Hmox1 inhibitor Zinc Protoporphyrin (iHmox1, 1 μM, treated for 48 h) in FACS-sorted Lin-Pvr+ FerroCAFs. The Pvr+ CAFs were FACS-isolated from the tumors of 3 mycHiptenΔ/Δ mice (n = 3 mice). RT-qPCR data (h) and immunoblots (i) demonstrate a significant decrease of MASP-related genes in FACS-isolated Lin-Pvr+ FerroCAFs at mRNA and protein levels upon iHmox1 treatment (n = 3 mice). The iHmox1 treatment induces decreased tumor size (j) and significantly reduced tumor weight (k) as compared to vehicle (n = 8 mice). Scale bar = 1 cm in (j). IHC staining (l) and quantification results (m) reveal a significantly decreased tumor cell proliferation index, as exemplified by reduced frequency of Ki67+ cells upon iHmox1 treatment (n = 8 mice). Scale bar = 50 μm. n The body weights of iHmox1 and vehicle-treated mice were shown (for each group, n = 8 mice). For statistics in this figure, the two-tail unpaired Student’s-t test was utilized in (e), (g), (h), and (m, n), and (k) and data were shown as means ± SD. Source data are provided as a Source Data file.
Fig. 5
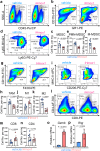
Fig. 5. Pharmacological blockade of Hmox1 in FerroCAFs provokes anti-tumor activity in PCa.
a Flow cytometric plots showing that Hmox1 inhibition did not alter the immune cell infiltration (CD45+ cells) as compared to vehicle. Flow cytometric plots (b) and quantification results (c) reveal decreased CD11b+GR-1+ MDSCs in iHmox1-treated tumors compared to vehicle-treated ones. MDSCs were gated on CD45+ cell population (each group, n = 8 mice). Flow cytometric plots (d) and quantification of Ly6G+ PMN-MDSCs (e) and Ly6C+ M-MDSCs (f) in iHmox1-treated tumors in comparison to vehicle-treated counterparts. PMN-MDSCs and M-MDSCs were gated on CD11b+GR-1+ MDSCs (each group, n = 8 mice). Flow cytometric plots (g) and quantification results (h) showing the reduced CD11b+F4/80+ TAMs in iHmox1-treated tumors compared to vehicle-treated counterparts. TAMs were gated on CD45+ cell population (each group, n = 8 mice). Flow cytometric plots (i) and quantification data of MHC-II+ M1-like TAMs (j) and CD206+ M2-like TAMs (k) gated on CD11b+F4/80+ macrophages in iHmox1-treated tumors and vehicle-treated counterparts (each group, n = 8 mice). Flow cytometric plot (l) and quantifications (m, n) showing an increase in CD8+ T cells in tumors upon iHmox1 treatment as compared to vehicle control. The CD4+ and CD8+ T cells were gated on CD45+ population (each group, n = 8 mice). RT-qPCR results showing that iHmox1-treated tumors exhibit significantly upregulated mRNAs of Gzmb (o) and Ifng (p) in FACS-sorted T cells (each group, n = 3 mice). For statistics in this figure, the two-tail unpaired Student’s-t test was applied for (c), (e, f), (h), (j, k), (m, n) and (o, p), data were shown as means ± SD. Source data are provided as a Source Data file.
Fig. 6
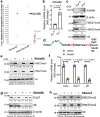
Fig. 6. Kdm6b confers immunosuppressive activity to FerroCAFs via MASP expression.
a The Bubble Chart shows that the most upregulated iron-dependent epigenetic enzyme is Kdm6b in FerroCAFs versus non-FerroCAFs based on our scRNA-seq data (n = 2 Hi-Myc mice, 3 and 12-month-old, respectively). RT-qPCR data (b) and immunoblots (c) confirm that Kdm6b is significantly higher at both mRNA and protein levels in FACS-isolated Lin-Pvr+ FerroCAFs than Lin-Pvr-/lo counterparts. The Lin-Pvr+ and Lin-Pvr-/lo CAFs were FACS-isolated from the tumors of 3 mycHiptenΔ/Δ mice. Representative immunoblots were displayed in (c) from 3 lines of CAFs isolated from 3 mycHiptenΔ/Δ mice (n = 3 mice). (d) A schematic illustration revealing our hypothesis that the Hmox1/iron/Kdm6b signaling axis sustains iron-loaded phenotype and MASP expression of FerroCAFs. Immunoblots (e) and RT-qPCR (f) results demonstrate decreases in MASP-related genes including Ccl2, Cxcl1 and Il6 at both mRNA and protein levels upon the treatment of a Kdm6b inhibitor (iKdm6b, GSK-J4, 1 μM, treated for 48 h) in FerroCAFs. The Lin-Pvr+ FerroCAFs were FACS-isolated from the tumors of 3 mycHiptenΔ/Δ mice (n = 3 mice). g Immunoblots showing decreased MASP-related factors including Cxcl1 and Il6 in FerroCAFs upon iKdm6b treatment versus vehicle control in FerroCAFs. The Lin-Pvr+ FerroCAFs were FACS-isolated from the tumors of 3 mycHiptenΔ/Δ mice (n = 3 mice). h Immunoblots revealing upregulated H3K27me2/3 levels in FerroCAFs upon iHmox1 treatment (iHmox1, Zinc Protoporphyrin, 1 μM, treated for 48 h) in FerroCAFs. The Lin-Pvr+ FerroCAFs were FACS-isolated from the tumors of 3 mycHiptenΔ/Δ mice (n = 3 mice). For statistics in this figure, the two-tail unpaired Student’s-t test was used for statistical analyses in (b) and (f), and data were shown as means ± SD. Source data are provided as a Source Data file.
Fig. 7
Fig. 7. Hmox1-KO leads to enhanced H3K27me3 marks at MASP gene locus.
CUT&Tag analyses on sgCtrl-FerroCAFs and sgHmox1-FerroCAFs showing a globally increased DNA-binding intensity of anti-H3K27me3 antibody (a), particularly, in MASP-related gene locus, such as, Ccl2 (b), Cxcl1/2 (c), and Il6 (d) upon CAF-specific Hmox1-knockout. The Integrative Genomic Viewer (IGV) scales were shown, n = 2, biological replicates. Source data are provided as a Source Data file.
Fig. 8
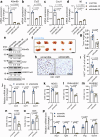
Fig. 8. Suppression of Kdm6b inhibits the immunosuppressive and pro-tumorigenic activities of FerroCAFs.
RT-qPCR results confirm the knockdown efficiency of shRNAs against Kdm6b (a) and show the decreased mRNA levels of Ccl2 (b), Cxcl1, (c) and Il6 (d) upon Kdm6b knockdown (Kdm6b-KD) in FerroCAFs. FerroCAFs were FACS-isolated from the tumors of 3 mycHiptenΔ/Δ mice (n = 3 mice). e Immunoblots unveil the knockdown efficiency of shRNAs against Kdm6b at protein level and demonstrate the decreased Il6 and Ccl2 levels and the restored H3K27me3 modifications upon Kdm6b-KD in FerroCAFs. Representative immunoblots were displayed from 3 lines of CAFs isolated from 3 mycHiptenΔ/Δ mice (n = 3 mice). Kdm6b-KD (The shKdm6b−2# with a stronger knockdown efficiency was used for in vivo experiments) in FerroCAFs shows reduced pro-tumorigenic activity compared to scramble shRNA controls, as exemplified by reduced tumor sizes (f), decreased tumor weight (g) and prohibited cell proliferation index (h, i) (n = 5 mice). Scale bar = 1 cm in (f). Scale bar = 100 μm in (h). j RT-qPCR results reveal the significantly reduced MASP-related factors including Ccl2, Csf1 and Cxcl1 in Kdm6b-KD-FerroCAF-induced tumors compared to Scramble-FerroCAF-induced counterparts. FerroCAFs were FACS-isolated from the tumors of 3 mycHiptenΔ/Δ mice (n = 3 mice). Quantification results based on flow cytometric analysis show the reduced MDSCs (CD11b+GR-1+) (k), including PMN-MDSCs (Ly6G+) (l) and M-MDSCs (Ly6C+) (m), reduced TAMs (CD11b+F4/80+) (n) and restored CD8+ T cells (o) in Kdm6b-KD-FerroCAF-induced tumors compared to Scramble-FerroCAF-promoted counterparts (n = 5 mice). p Kdm6b-KD-FerroCAF-induced tumors exhibit decreased mRNA levels of immunosuppressive genes, such as, Arg1, Tgfb and Il10, but increased cytotoxic T cell associated genes including Ifng and Gzmb, in contrast to scramble-FerroCAF-promoted tumors (n = 3 mice). For statistics in this figure, the one-way ANOVA test was used for (ad). The two-tail unpaired Student’s t-test was applied for (g, i) and (jp) and data were shown as means ± SD. Source data are provided as a Source Data file.
Fig. 9
Fig. 9. FerroCAFs abundance in human PCa predicts unfavorable clinical outcomes.
a UMAP plots show the re-analyses on a reported human PCa scRNA-seq dataset (GSE141445) and identify an HMOX1-expressing cluster-1 CAF that recapitulates murine Cluster-1 FerroCAFs. Only the CAF population was sub-clustered and displayed in (a, left). The HMOX1-expressing cluster-1 CAF subset was pointed out by dashed lines (a, right). This dataset of GSE141445 contains 13 patients (n = 13 patients). b KEGG analysis shows that HMOX1+ cluster 1 CAFs are featured with two iron associated signatures including “mineral absorption” and “ferroptosis” (Dataset: GSE 141445). This dataset of GSE141445 contains 13 patients (n = 13 patients). c The Bubble chart shows FerroCAFs-associated signature gene cluster (FerroScore) including HMOX1, KDM6B, CCL2, CSF1, IL6, CXCL1 and CXCL2 are higher in HG-PCa (n = 5 patients) samples LG-PCa (n = 7 patients) counterparts (Dataset: GSE 141445). d Pearson correlation analyses reveal positive associations of FerroScore with T cell dysfunction (left panel), MDSC (middle panel) and TAM (right panel). Data were analyzed by TIDE. This dataset of TCGA human prostate cancer contains 498 patients (n = 498 patients). Using TCGA bulk RNA-seq (e, TCGA, n = 498 patients) and a scRNA-seq dataset (f, GSE46602, n = 36 patients) (f), the FerroScore-high PCa patients exhibit a significantly shortened overall survival (e) and a higher biochemical recurrence (BCR) (f) as compared to FerroScore-low subjects. For statistics in this figure, the log-rank Mantel-Cox test was used in (e) and (f). Source data are provided as a Source Data file.
Fig. 10
Fig. 10. Perturbation of Hmox1/iron/Kdm6b axis in FerroCAFs leads to restored anti-tumor immunity.
a Iron-loaded FerroCAFs induce immunosuppression in PCa via the Hmox1/iron/Kdm6b signaling axis. The upregulated Hmox1 causes iron accumulation, activates the iron-dependent histone lysine demethylase Kdm6b, and induces a MASP expression. By recruiting MDSCs and TAMs into the tumor site, FerroCAFs foster an immunosuppressive TME and predicts a poorer clinical outcome. b Inhibition of FerroCAFs by targeting the Hmox1/iron/Kdm6b axis via multiple inhibitors, for instance, Zinc Protoporphyrin, (Hmox1 inhibitor), Deferasirox (iron chelator), and GSK-4J (Kdm6b inhibitor), exhibits an inhibitory effect on MASP expression and tumor progression, implying translational implications. All images and elements in (a) and (b) were created by ourselves and have not been used in previous publications or else where. Source data are provided as a Source Data file.

References

    1. Abbate, V. & Hider, R. Iron in biology. Metallomics Integr. Biometal Sci.9, 1467–1469 (2017). - PubMed
    1. Jiang, Y. et al. Iron-dependent histone 3 lysine 9 demethylation controls B cell proliferation and humoral immune responses. Nat. Commun.10, 2935 (2019). - PMC - PubMed
    1. Gao, X. et al. Iron-dependent epigenetic modulation promotes pathogenic T cell differentiation in lupus. The J. Clin. Investig.132, 10.1172/jci152345 (2022). - PMC - PubMed
    1. Koinis, F. et al. Myeloid-derived suppressor cells in prostate cancer: present knowledge and future perspectives. Cells11, 20 (2021). - PMC - PubMed
    1. Han, C. et al. The roles of tumor-associated macrophages in prostate cancer. J. Oncol.2022, 8580043 (2022). - PMC - PubMed

Publication types

MeSH terms