. 2024 Oct 19;14(1):24575.
doi: 10.1038/s41598-024-74224-8.

Detection and characterization of colorectal cancer by autofluorescence lifetime imaging on surgical specimens

Affiliations

Detection and characterization of colorectal cancer by autofluorescence lifetime imaging on surgical specimens

Alberto Ignacio Herrando et al. Sci Rep. .

Abstract

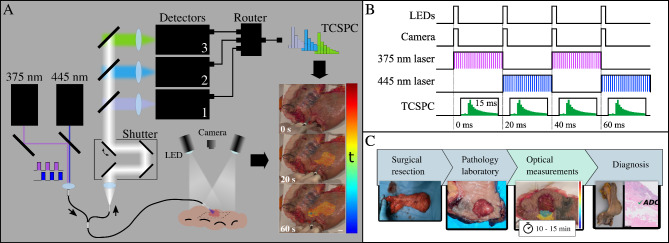
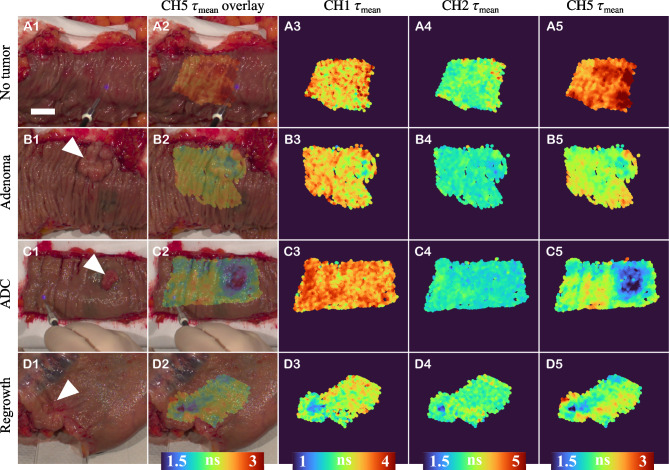
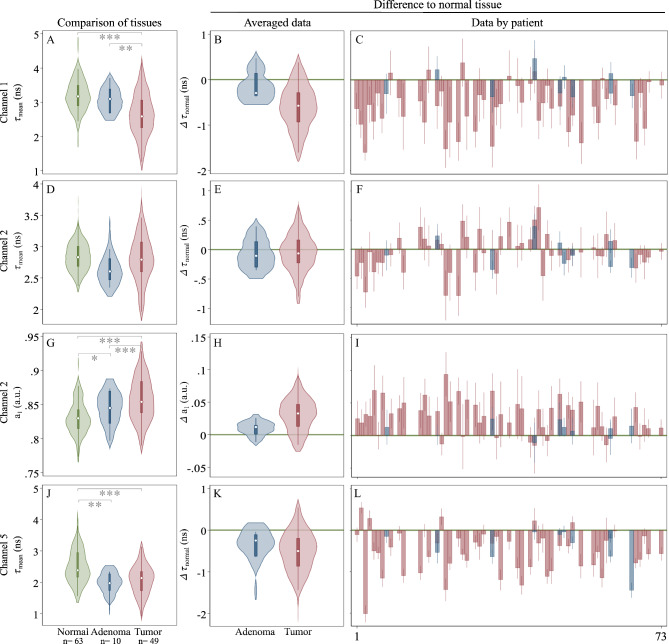
Colorectal cancer (CRC) ranks among the most prevalent malignancies worldwide, driving a quest for comprehensive characterization methods. We report a characterization of the ex vivo autofluorescence lifetime fingerprint of colorectal tissues obtained from 73 patients that underwent surgical resection. We specifically target the autofluorescence characteristics of collagens, reduced nicotine adenine (phosphate) dinucleotide (NAD(P)H), and flavins employing a fiber-based dual excitation (375 nm and 445 nm) optical imaging system. Autofluorescence-derived parameters obtained from normal tissues, adenomatous lesions, and adenocarcinomas were analyzed considering the underlying clinicopathological features. Our results indicate that differences between tissues are primarily driven by collagen and flavins autofluorescence parameters. We also report changes in the autofluorescence parameters associated with NAD(P)H that we tentatively attribute to intratumoral heterogeneity, potentially associated to the presence of distinct metabolic subpopulations. Changes in autofluorescence signatures of malignant tumors were also observed with lymphatic and venous invasion, differentiation grade, and microsatellite instability. Finally, we characterized the impact of radiative treatment in the autofluorescence fingerprints of rectal tissues and observed a generalized increase in the mean lifetime of radiated adenocarcinomas, which is suggestive of altered metabolism and structural remodeling. Overall, our preliminary findings indicate that multiparametric autofluorescence lifetime measurements have the potential to significantly enhance clinical decision-making in CRC, spanning from initial diagnosis to ongoing management. We believe that our results will provide a foundational framework for future investigations to further understand and combat CRC exploiting autofluorescence measurements.


Conflict of interest statement

The authors declare no competing interests.

Figures

Fig. 1
Fig. 1
(A) Schematic representation of the optical layout of the instrument. Black arrows indicate the signal direction. Bottom right corner: Live recording is augmented with false color maps representing time-resolved spectroscopic information obtained from the sample. (B) Timing diagram for the real-time acquisition. LEDs and cameras are triggered simultaneously at 50 Hz. Lasers are multiplexed at 50 Hz for sequential excitation at different wavelengths. TCSPC measurements are carried out at 50 Hz (25 Hz for each excitation wavelength) with an integration time of 15 ms. (C) Clinical workflow of the sample after surgical excision including estimative time for time-resolved autofluorescence measurements.
Fig. 2
Fig. 2
(A)–(D) Representative examples (in rows) illustrating the differentiation potential of optical measurements (in columns) obtained with our instrumentation. From left to right: Column 1. White light image, targeted lesions are pointed with a white arrow. Column 2. White light image augmented with a false color map of the averaged lifetime collected from CH5. Column 3, 4 and 5. Fluorescence lifetime maps obtained from CH1, CH2 and CH5, respectively. Scale bar 2 cm. The color bars for the lifetime measurements are tailored to the specific lifetimes of the target molecules in each channel. This adaptation was made to enhance the visual contrast and accurately represent the differences in fluorescence lifetimes within each sample. ADC: adenocarcinoma.
Fig. 3
Fig. 3
Absolute and relative fluorescence lifetimes measured in CH1, CH2, and CH5 from normal (green), adenoma (blue) and tumor (red) tissues. (A), (D), (J) Average autofluorescence lifetime in CH1, CH2, and CH5, respectively, in non-radiated specimens. (B), (E), (K) Relative autofluorescence lifetimes of adenoma (blue) and tumor (red) tissues with respect to their corresponding normal (green line) tissue (i.e., formula image), collected from CH1, CH2 and CH5, respectively, in non-radiated specimens. (C), (F), (L) Relative autofluorescence lifetimes in CH1, CH2, and CH5 for each patient across the cohort. (G), (H), (I) Absolute and relative values of CH2 a1 in normal, adenoma, and tumor tissues. Linear mixed-effect model was used to calculate p values (*p < 0.05, **p < 0.01, ***p < 0.001).
Fig. 4
Fig. 4
(A)–(C) Averaged autofluorescence lifetimes of paired normal (green) and tumor (red) regions from non-irradiated specimens, in CH1, CH2, and CH5, respectively of n = 49 samples. (D), (E) Scatter plots correlating CH1 (dark green) and CH5 (light blue) mean lifetimes with tumor largest axis size for early and advanced tumors, respectively. (F)–(N) Relative values comparison between relevant histological features of tumors. Components of violin plots from (F)–(N) are constituted by: white dots representing the mean, darker horizontal lines that illustrate the median, and vertical bars the interquartile range (IQR). Paired tests were used to calculate p values (*p < 0.05, **p < 0.01, ***p < 0.001).
Fig. 5
Fig. 5
(A) Tumor heterogeneity assessed by the coefficient of variation of mean autofluorescence lifetime data in n = 49 samples. White dots are the median and bars are the interquartile range. (B) Relative coefficients of variation of mean autofluorescence lifetime data across the cohort for CH2 and CH5. Paired tests were used to calculate p values (***p < 0.001).
Fig. 6
Fig. 6
Effect of radiotherapy in normal and tumor tissues. (A) and (B) Averaged lifetime values (dots) and SD (shaded area) of normal (green-yellow) and tumor (red-orange) tissues according to their previous radiation exposure across all channels. (C)–(H): Fluorescence lifetimes values obtained from CH2, CH5 and calculated OMI index (upper row) with their correspondent coefficients of variation in normal and tumor tissue of non-radiated (left) and radiated (right) specimens (lower row). Components of violin plots in (C), (E) and (G) are constituted by: white dots representing the mean, darker horizontal lines that illustrate the median, and vertical bars the interquartile range (IQR). p values (*p < 0.05, **p < 0.01, ***p < 0.001).

References

    1. Sung, H. et al. Global Cancer Statistics 2020: GLOBOCAN Estimates of Incidence and Mortality Worldwide for 36 Cancers in 185 Countries. CA Cancer J. Clin.71(3), 209–249 (2021). - PubMed
    1. Johnson, G. G. R. J., Hershorn, O., Singh, H., Park, J. & Helewa, R. M. Sampling error in the diagnosis of colorectal cancer is associated with delay to surgery: A retrospective cohort study. Surg. Endosc. 36(7), 4893–4902 (2022). - PMC - PubMed
    1. Bökkerink, G. M. et al. Value of macrobiopsies and transanal endoscopic microsurgery in the histological work-up of rectal neoplasms; A retrospective study. World J. Gastrointest. Oncol.9(6), 251 (2017). - PMC - PubMed
    1. Gondal, G. et al. Biopsy colorectal polyps is not adequate grading neoplasia. Endoscopy37(12), 1193–1197 (2005). - PubMed
    1. Costantini, M. Interobserver agreement in the histologic diagnosis of colorectal polyps the experience of the multicenter adenoma colorectal study (SMAC). J. Clin. Epidemiol.56(3), 209–214 (2003). - PubMed

LinkOut - more resources