. 2024 Oct 19;14(1):24625.
doi: 10.1038/s41598-024-75718-1.

In vitro analysis suggests that SARS-CoV-2 infection differentially modulates cancer-like phenotypes and cytokine expression in colorectal and prostate cancer cells

Affiliations

In vitro analysis suggests that SARS-CoV-2 infection differentially modulates cancer-like phenotypes and cytokine expression in colorectal and prostate cancer cells

Alberta Serwaa et al. Sci Rep. .

Abstract

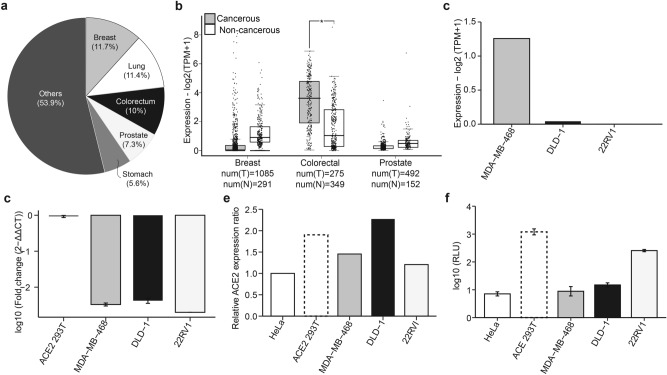
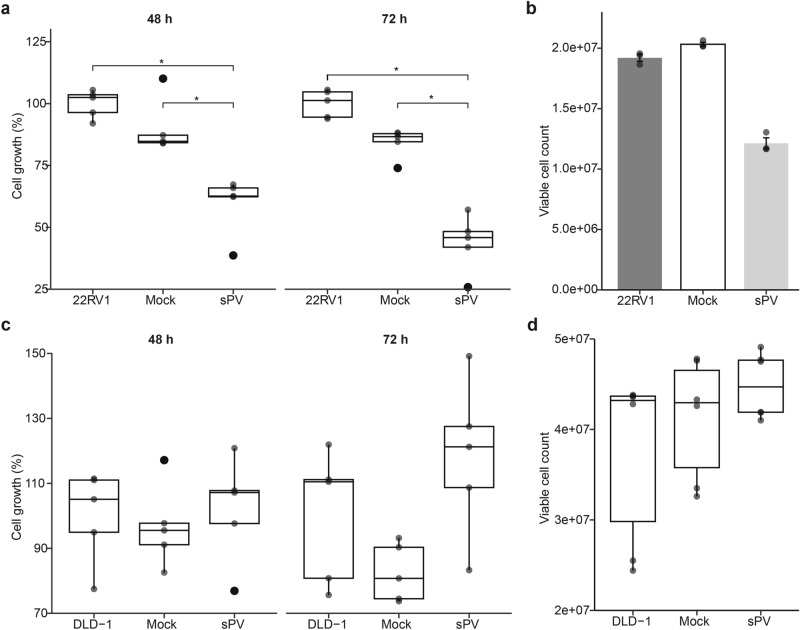
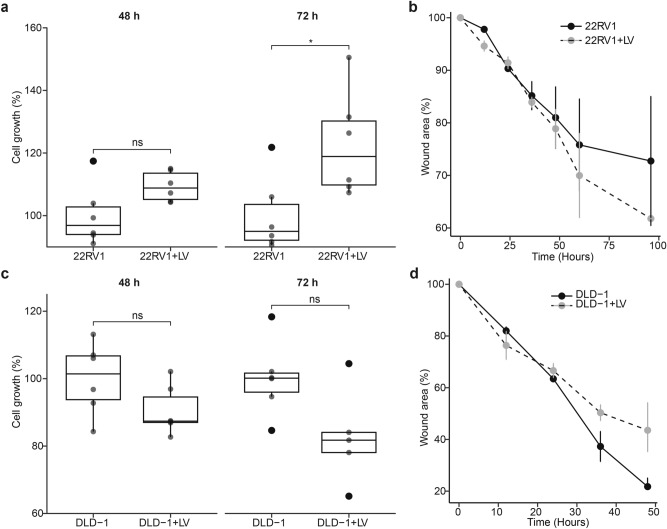
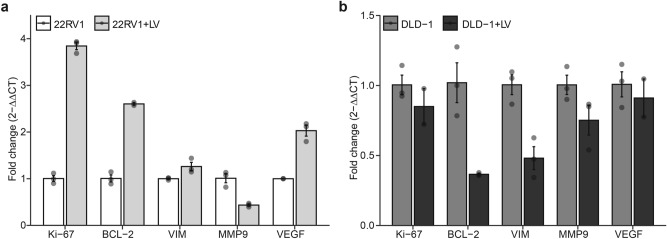
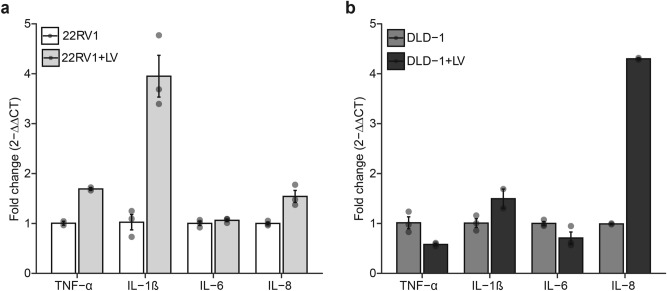
The coronavirus disease 2019 (COVID-19) reportedly exacerbates cancer outcomes. However, how COVID-19 influences cancer prognosis and development remains poorly understood. Here, we investigated the effect of Severe Acute Respiratory Syndrome Corona Virus 2 (SARS-CoV-2), the etiological agent of COVID-19, on cellular cancer phenotypes the expression of cancer-related markers, and various proinflammatory cytokines. We infected prostate (22RV1) and colorectal (DLD-1) cancer cell lines, which express angiotensin-converting enzyme 2 (ACE2), with spike pseudovirus (sPV) and laboratory stocks of live SARS-CoV-2 viruses. After infection, we quantified changes in the cellular cancer phenotypes, the gene expression levels of some cancer markers, including Ki-67, BCL-2, VIM, MMP9, and VEGF, and proinflammatory cytokines. Phenotypic analysis was performed using MTT and wound healing assays, whereas gene expression analysis was carried out using real-time quantitative PCR (RT-qPCR). We show that SARS-CoV-2 infection impacts several key cellular pathways involved in cell growth, apoptosis, and migration, in prostate and colorectal cancer cells. Our results suggest that SARS-CoV-2 infection does influence various cancer cellular phenotypes and expression of molecular cancer markers and proinflammatory cytokines, albeit in a cell-type-specific manner. Our findings hint at the need for further studies and could have implications for evaluating the impact of other viruses on cancer progression.

Keywords: COVID-19; Cancer; Cytokine expression; SARS-CoV-2; Spike pseudovirus.


Conflict of interest statement

The authors declare no competing interests.

Figures

Fig. 1
Fig. 1
ACE2 expression and SARS-CoV-2 infection of various cancer cells. (a) Pie chart showing the proportion of various cancers globally. Data from GLOBOCAN (https://www.uicc.org/news/globocan-2020-new-global-cancer-data). (b) Box plots comparing the expression of ACE2 expression in tumor (grey) and corresponding normal (white) breast, colorectal, and prostate tissues. The expression cut-off was set at 1 from the log2 fold change (Log2FC) with a p-value cut of 0.01. Data are presented as a fold change of log expression of ACE2 transcripts per million (Log2TPM). The numbers of T = tumor and N = normal tissues are provided. The horizontal line across the box is the median expression while the whiskers depict a 1.5 × interquartile range. (c) Bar plot showing ACE2 expression in MDA-MB-468, DLD-1, and 22RV1 cell lines. The values were transformed to log2(TPM + 1). Data from DEPMAP (https://depmap.org/portal/interactive/). (d) Bar plots summarizing the mRNA expression of ACE2 transcripts across the three cell lines were determined using RT-qPCR. The data represent log-transformed fold changes for at least three independent experiments. Error bars depict the standard error of the mean (SEM). (e) Bar plot showing expression of ACE2 protein in the three cell lines measured using dot blot assay. Dot intensities were quantified with ImageJ/Fiji and expressed as the relative protein expression ratios of net band to net loading control. (f) Bar plots showing the infectivity of various cell lines with SARS-CoV-2 spike pseudovirus (sPV). The infectivity measurements were performed using luciferase assay on a GloMax luminescence plate reader. Infectivity was expressed as log10 relative light unit (RLU). Errors bars represent SEM. ACE2 293 T, a cell line stably expressing ACE2, and HeLa cells, known to lack ACE2, were used as controls.
Fig. 2
Fig. 2
Effect of SARS-CoV-2 spike pseudovirus (sPV) infection on the proliferation and viability of prostate and colorectal cancer cell lines. (a) Box plots showing the proliferation of 22RV1, a prostate cancer cell line, infected with mock and sPV for 48 and 72 h. Data are expressed as the percentage cell growth calculated by (mean absorbance of test/mean absorbance of control) × 100. Box plots represent the median and upper and lower quartiles of the distribution whereas whiskers represent 1.5 times the interquartile range. (b) Bar plots showing the viability of 22RV1, a prostate cancer cell line, infected with mock and sPV for 72 h. The data is a representation of the Mean ± SEM of experimental groups. (c) Box plots showing the proliferation and viability of DLD-1, a colorectal cancer cell line, infected with mock and sPV for 48 and 72 h. Data are expressed as the percentage cell growth calculated by (mean absorbance of test/mean absorbance of control) × 100. (d) Box plots showing the viability of DLD-1, a colorectal cancer cell line, infected with mock and sPV for 72 h. Box plots represent the median and upper and lower quartiles of the distribution whereas whiskers represent 1.5 times the interquartile range.
Fig. 3
Fig. 3
Effect of SARS-CoV-2 infection on prostate and colorectal cancer cell proliferation and migration. (a) Box plots showing the proliferation of 22RV1, a prostate cancer cell line infected with LV for 48 and 72 h. Data are expressed as the percentage cell growth calculated by (mean absorbance of test/mean absorbance of control) × 100. Box plots represent the median and upper and lower quartiles of the distribution whereas whiskers represent 1.5 times the interquartile range. (b) Line plots showing the changes in the wound area in LV infected and uninfected 22RV1 cells across different time points. Error bars represent the SEM. (c) Box plots showing the proliferation of DLD-1, a colorectal cancer cell line infected with LV for 48 and 72 h. Data are expressed as the percentage cell growth calculated by (mean absorbance of test/mean absorbance of control) × 100. Box plots represent the median and upper and lower quartiles of the distribution whereas whiskers represent 1.5 times the interquartile range. (d) Line plots showing the changes in the wound area in LV-infected and uninfected DLD-1 cells across different time points. Error bars represent the SEM.
Fig. 4
Fig. 4
Effect of SARS-CoV-2 infection on the expression of various cancer markers in prostate and colorectal cancer cells. (a) Bar plots showing the relative expression of proliferative, apoptotic, migratory, and angiogenic markers in 22RV1 infected with LV. Data are expressed as the fold change calculated by 2-ΔΔCT. Error bars depict SEM. (b) Bar plots showing the relative expression of proliferative, apoptotic, migratory, and angiogenic markers in DLD-1 infected with LV. Data are expressed as the fold change calculated by 2-ΔΔCT. Error bars depict SEM.
Fig. 5
Fig. 5
SARS-CoV-2 increases certain proinflammatory cytokine expression. (a) Bar plots showing the relative expression of four proinflammatory cytokines in 22RV1 infected with LV. (b) Bar plots showing the relative expression of four proinflammatory cytokines in DLD-1 infected with LV. Data are expressed as the fold change calculated by 2-ΔΔCT. Error bars depict SEM.

References

    1. Bennett, J. E. et al. NCD Countdown 2030: Worldwide trends in non-communicable disease mortality and progress towards Sustainable Development Goal target 3.4. Lancet392, 1072–1088 (2018). - PubMed
    1. Garcia-Closas, M., Gunsoy, N. B. & Chatterjee, N. Combined associations of genetic and environmental risk factors: Implications for prevention of breast cancer. JNCI Comment.106, 1–6 (2014). - PMC - PubMed
    1. Blackadar, C. B. WJ CO. World J Clin Oncol7, 54–86 (2016). - PMC - PubMed
    1. Krump, N. A. & You, J. Molecular mechanisms of viral oncogenesis in humans. Nat. Rev. Microbiol.16, 684–698 (2018). - PMC - PubMed
    1. O’Donnell, J. S., Teng, M. W. L. & Smyth, M. J. Cancer immunoediting and resistance to T cell-based immunotherapy. Nat. Rev. Clin. Oncol.16, 151–167 (2019). - PubMed

MeSH terms