. 2024 Oct 19;17(1):433.
doi: 10.1186/s13071-024-06520-1.

Role of cuproptosis in mediating the severity of experimental malaria-associated acute lung injury/acute respiratory distress syndrome

Affiliations

Role of cuproptosis in mediating the severity of experimental malaria-associated acute lung injury/acute respiratory distress syndrome

Xinpeng Hou et al. Parasit Vectors. .

Abstract

Background: Malaria-associated acute lung injury/acute respiratory distress syndrome (MA-ALI/ARDS) is a fatal complication of Plasmodium falciparum infection that is partially triggered by macrophage recruitment and polarization. As reported, copper exposure increases the risk of malaria infection, and copper accumulation-induced cuproptosis triggers M1 macrophage polarization. It is thus hypothesized that cuproptosis could act as a critical mediator in the pathogenesis of MA-ALI/ARDS, but its underlying mechanism remains unclear. The present study aimed to explore the role of cuproptosis in the severity of murine MA-ALI/ARDS.

Methods: We utilized an experimental model of MA-ALI/ARDS using female C57BL/6 mice with P. berghei ANKA infection, and treated these animals with the potent copper ion carrier disulfiram (DSF) or copper ion chelator tetrathiomolybdate (TTM). The RAW 264.7 macrophages, which were stimulated with infected red blood cells (iRBCs) in vitro, were also targeted with DSF-CuCl2 or TTM-CuCl2 to further investigate the underlying mechanism.

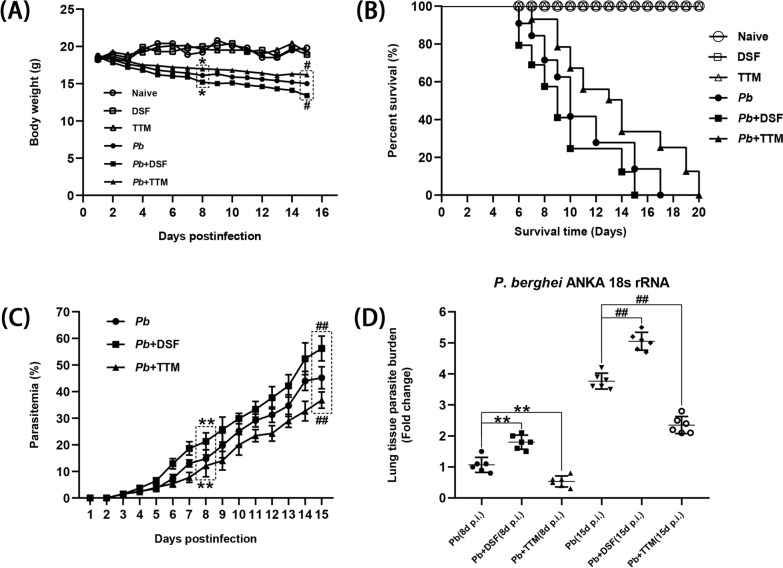
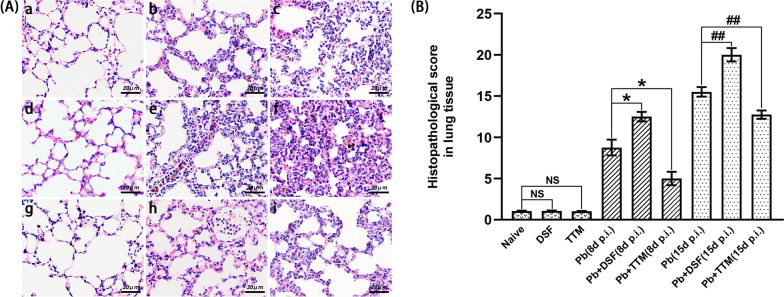
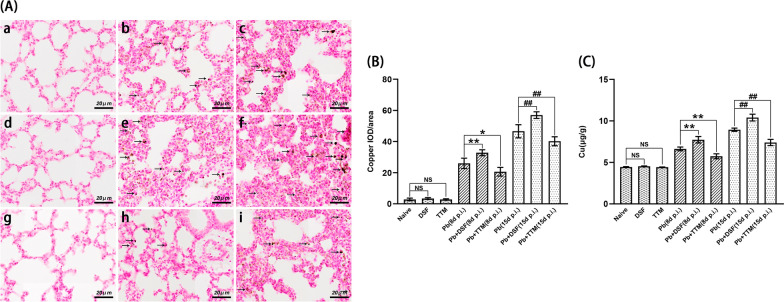
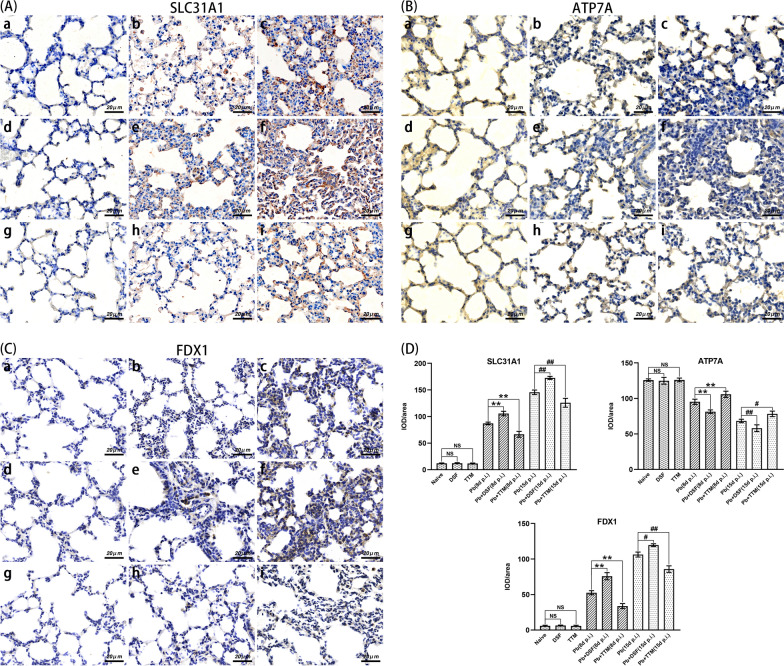
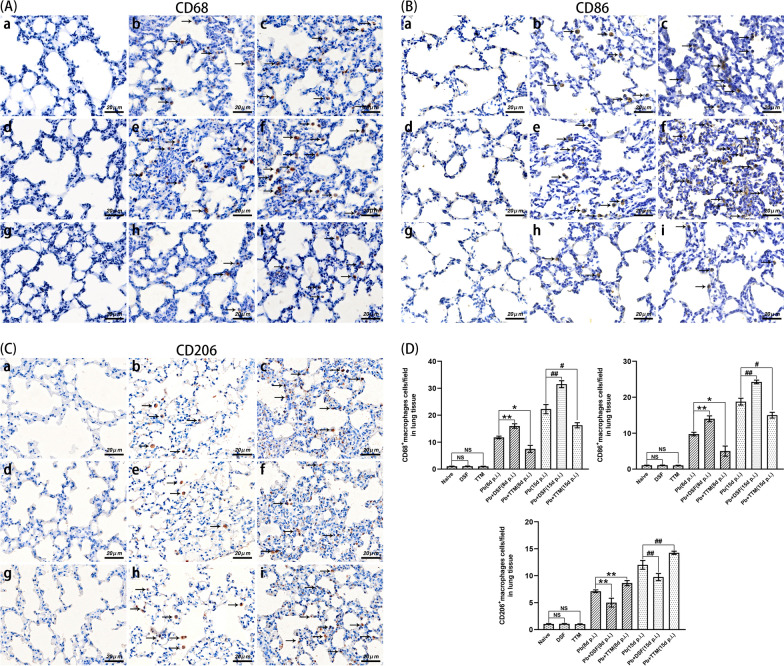
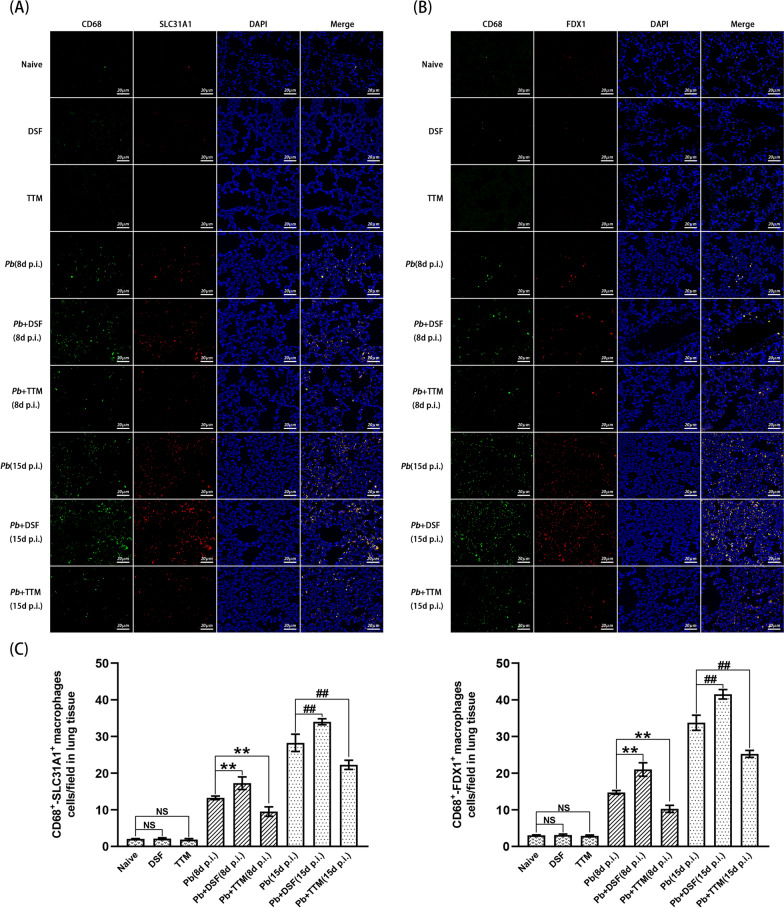
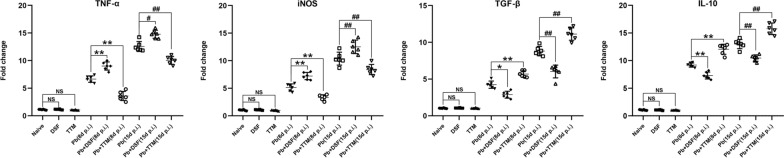
Results: Our findings showed a dramatic elevation in the amount of copper and the expression of SLC31A1 (a copper influx transporter) and FDX1 (a key positive regulator of cuproptosis) but displayed a notable reduction in the expression of ATP7A (a copper efflux transporter) in the lung tissue of experimental MA-ALI/ARDS mice. Compared to the P. berghei ANKA-infected control group, mice that were administered DSF exhibited a remarkable increase in parasitemia/lung parasite burden, total protein concentrations in bronchoalveolar lavage fluid (BALF), lung wet/dry weight ratio, vascular leakage, and pathological changes in lung tissue. Strikingly, the experimental MA-ALI/ARDS mice with DSF treatment also demonstrated dramatically elevated copper levels, expression of SLC31A1 and FDX1, numbers of CD86+, CD68+, SLC31A1+-CD68+, and FDX1+-CD68+ macrophages, and messenger RNA (mRNA) levels of pro-inflammatory cytokines (tumor necrosis factor [TNF-α] and inducible nitric oxide synthase [iNOS]) in lung tissue, but showed a remarkable decrease in body weight, survival time, expression of ATP7A, number of CD206+ macrophages, and mRNA levels of anti-inflammatory cytokines (transforming growth factor beta [TGF-β] and interleukin 10 [IL-10]). In contrast, TTM treatment reversed these changes in the infected mice. Similarly, the in vitro experiment showed a notable elevation in the mRNA levels of SLC31A1, FDX1, CD86, TNF-α, and iNOS in iRBC-stimulated RAW 264.7 cells targeted with DSF-CuCl2, but triggered a remarkable decline in the mRNA levels of ATP7A, CD206, TGF-β, and IL-10. In contrast, TTM-CuCl2 treatment also reversed these trends in the iRBC-stimulated RAW 264.7 cells.

Conclusions: Our data demonstrate that the activation of cuproptosis with DSF aggravated the severity of MA-ALI/ARDS by partially inducing M1 polarization of pulmonary macrophages, while inhibition of cuproptosis with TTM contrarily ameliorated the severity of MA-ALI/ARDS by promoting macrophage M2 polarization. Our findings suggest that blockage of cuproptosis could be a potential therapeutic strategy for treatment of MA-ALI/ARDS.

Keywords: ALI/ARDS; Cuproptosis; M1/M2 polarization; Macrophage; Malaria.


Conflict of interest statement

The authors declare no competing interests.

Figures

Fig. 1
Fig. 1
The effect of DSF or TTM on morbidity and mortality in response to P. berghei ANKA infection. A, B Body weight and survival time were monitored daily in the different groups and analyzed by time-series analysis and log-rank test, respectively. C Peripheral blood parasitemia levels were determined in the different groups by Giemsa-stained thin blood smears. Differences in parasitemia were compared using a time-series analysis. D Estimation of lung parasite burden at 8 and 15 dpi was determined by calculating the mRNA levels of P. berghei ANKA 18S rRNA with qPCR assay. *P < 0.05 and **P < 0.01 vs. the P. berghei ANKA-infected control mice at 8 dpi; #P < 0.05 and ##P < 0.01 vs. the P. berghei ANKA-infected control mice at 15 dpi
Fig. 2
Fig. 2
The effect of DSF or TTM on changes in total protein concentration in BALF, lung wet/dry weight ratio, and lung vascular leakage in the experimental MA-ALI/ARDS mice. A Total protein concentration in BALF was determined in different groups using a BCA protein quantification kit. B The degree of pulmonary edema was assessed by calculating the ratio of lung wet/dry weight. C The degree of lung vascular leakage was determined by calculating the concentration of Evans blue dye in lung tissue. Differences between two groups or among multiple groups were compared using the independent-samples t-test or one-way ANOVA, respectively. Experiments were conducted with six mice per group, and data are presented as mean ± SD. *P < 0.05 and **P < 0.01 vs. the P. berghei ANKA-infected control mice at 8 dpi; #P < 0.05 and ##P < 0.01 vs. the P. berghei ANKA-infected control mice at 15 dpi. NS = non-significant, P > 0.05, relative to naïve mice
Fig. 3
Fig. 3
The effect of DSF or TTM on lung histopathological changes in the experimental MA-ALI/ARDS mice after DSF or TTM treatment. A Representative images of lung histopathological changes by H&E staining under a light microscope at a magnification of ×200: a naïve mice; b P. berghei ANKA-infected control mice at 8 dpi; c P. berghei ANKA-infected control mice at 15 dpi; d DSF-treated uninfected mice; e DSF-treated P. berghei ANKA-infected mice at 8 dpi; f DSF-treated P. berghei ANKA-infected mice at 15 dpi; g TTM-treated uninfected mice; h TTM-treated P. berghei ANKA-infected mice at 8 dpi; i TTM-treated P. berghei ANKA-infected mice at 15 dpi. B Analysis of semiquantitative lung histopathological scores. Differences in semiquantitative histopathological scores between two groups or among multiple groups were compared using the independent-samples t-test or one-way ANOVA, respectively. Experiments were conducted with six mice per group, and data are presented as mean ± SD. *P < 0.05 and **P < 0.01 vs. the P. berghei ANKA-infected control mice at 8 dpi; # P < 0.05 and ##P < 0.01 vs. the P. berghei ANKA-infected control mice at 15 dpi. NS = non-significant, P > 0.05, relative to naïve mice
Fig. 4
Fig. 4
The effect of DSF or TTM on pulmonary copper accumulation in the experimental MA-ALI/ARDS mice. A Representative images of pulmonary copper accumulation in mice using rubeanic acid copper staining under a light microscope at a magnification of ×200. The positive copper granules show a dark brown color (arrows). a Naïve mice; b P. berghei ANKA-infected control mice at 8 dpi; c P. berghei ANKA-infected control mice at 15 dpi; d DSF-treated uninfected mice; e DSF-treated P. berghei ANKA-infected mice at 8 dpi; f DSF-treated P. berghei ANKA-infected mice at 15 dpi; g TTM-treated uninfected mice; h TTM-treated P. berghei ANKA-infected mice at 8 dpi; i TTM-treated P. berghei ANKA-infected mice at 15 dpi. B The degree of positive copper granules in lung tissue was analyzed by IOD/area using Image-Pro Plus 6.0 software under a Leica DMIRE2 microscope at a magnification of ×200. C The concentration of copper in lung tissue was determined by ICP-MS. Differences in the degree of positive copper granules and concentration of copper between two groups or among multiple groups were compared using the independent-samples t-test or one-way ANOVA, respectively. Experiments were conducted with six mice per group, and data are presented as mean ± SD. *P < 0.05 and **P < 0.01 vs. the P. berghei ANKA-infected control mice at 8 dpi; #P < 0.05 and ##P < 0.01 vs. the P. berghei ANKA-infected control mice at 15 dpi. NS = non-significant, P > 0.05, relative to naïve mice
Fig. 5
Fig. 5
The effect of DSF or TTM on pulmonary cuproptosis-related marker expression in the experimental MA-ALI/ARDS mice. A–C Representative images of pulmonary cuproptosis-related marker (SLC31A1, ATP7A, and FDX1) expression in different groups using immunohistochemical staining: a naïve mice; b P. berghei ANKA-infected control mice at 8 dpi; c P. berghei ANKA-infected control mice at 15 dpi; d DSF-treated uninfected mice; e DSF-treated P. berghei ANKA-infected mice at 8 dpi; f DSF-treated P. berghei ANKA-infected mice at 15 dpi; g TTM-treated uninfected mice; h TTM-treated P. berghei ANKA-infected mice at 8 dpi; i TTM-treated P. berghei ANKA-infected mice at 15 dpi. D The IOD/area of positively stained cuproptosis-related marker expression was calculated from more than 20 lung fields per animal. The differences in IOD/area of positive expression between two groups or among multiple groups were compared using the independent-samples t-test or one-way ANOVA, respectively. Experiments were conducted with six mice per group, and data are presented as mean ± SD. *P < 0.05 and **P < 0.01 vs. the P. berghei ANKA-infected control mice at 8 dpi; #P < 0.05 and ##P < 0.01 vs. the P. berghei ANKA-infected control mice at 15 dpi. NS = non-significant, P > 0.05, relative to naïve mice
Fig. 6
Fig. 6
The effect of DSF or TTM on pulmonary macrophage M1/M2 polarization in experimental MA-ALI/ARDS mice. AC Representative images of positively stained pulmonary CD68+, CD86+, and CD206+ macrophages in different groups using immunohistochemical staining. The positively stained CD68+, CD86+, and CD206+ macrophages showed a dark brown color (arrows). a Naïve mice; b P. berghei ANKA-infected control mice at 8 dpi; c P. berghei ANKA-infected control mice at 15 dpi; d DSF-treated uninfected mice; e DSF-treated P. berghei ANKA-infected mice at 8 dpi; f DSF-treated P. berghei ANKA-infected mice at 15 dpi; g TTM-treated uninfected mice; h TTM-treated P. berghei ANKA-infected mice at 8 dpi; i TTM-treated P. berghei ANKA-infected mice at 15 dpi. D The numbers of positively stained CD68+, CD86+, and CD206+ macrophages were calculated from more than 20 fields per animal. Differences in the numbers of positively stained cells between two groups or among multiple groups were compared using the independent-samples t-test or one-way ANOVA, respectively. Experiments were conducted with six mice per group, and data are presented as mean ± SD. *P < 0.05 and **P < 0.01 vs. the P. berghei ANKA-infected control mice at 8 dpi; #P < 0.05 and ##P < 0.01 vs. the P. berghei ANKA-infected control mice at 15 dpi. NS = non-significant, P > 0.05, relative to naïve mice
Fig. 7
Fig. 7
The effect of DSF or TTM on changes in the numbers of SLC31A1+-CD68+ and FDX1+-CD68+ pulmonary macrophages in experimental MA-ALI/ARDS mice. A, B Representative images of pulmonary SLC31A1+-CD68+ and FDX1+-CD68+ macrophages in different groups using double immunofluorescence staining under a fluorescence microscope at a magnification of ×200. The positively stained CD68+ macrophages appear green, while the positively SLC31A1+ or FDX1+ cells appear red. Co-expression of SLC31A1+-CD68+ or FDX1+-CD68+ cells exhibits a yellow color. C The numbers of positively SLC31A1+-CD68+ or FDX1+-CD68+ pulmonary macrophages were calculated from more than 20 lung fields per animal. Differences in the numbers of SLC31A1+-CD68+ and FDX1+-CD68+ macrophages between two groups or among multiple groups were compared using the independent-samples t-test or one-way ANOVA, respectively. Experiments were conducted with six mice per group, and data are presented as mean ± SD. *P < 0.05 and **P < 0.01 vs. the P. berghei ANKA-infected control mice at 8 dpi; #P < 0.05 and ##P < 0.01 vs. the P. berghei ANKA-infected control mice at 15 dpi. NS = non-significant, P > 0.05, relative to naïve mice
Fig. 8
Fig. 8
The effect of DSF or TTM on changes in pulmonary inflammatory response in experimental MA-ALI/ARDS mice. Total RNA was extracted from the lung tissue of the different groups, and the mRNA levels of TNF-α, iNOS, TGF-β, and IL-10 were determined using qPCR and 2−ΔΔCT methods. Independent-samples t-tests or one-way ANOVA were conducted to assess differences between two groups or among multiple groups, respectively. Experiments were conducted with six mice per group, and data are presented as mean ± SD. *P < 0.05 and **P < 0.01 vs. the P. berghei ANKA-infected control mice at 8 dpi; #P < 0.05 and ##P < 0.01 vs. the P. berghei ANKA-infected control mice at 15 dpi. NS = non-significant, P > 0.05, relative to naïve mice
Fig. 9
Fig. 9
The effect of co-culture of DSF-CuCl2 or TTM-CuCl2 on the mRNA levels of SLC31A1, ATP7A, FDX1, CD86, CD206, TNF-α, iNOS, TGF-β, and IL-10 in iRBC-stimulated RAW 264.7 cells in vitro. The RAW 264.7 cells were pretreated with 5.0 × 106 iRBCs for 6 h, then treated with PBS, DSF-CuCl2, or TTM-CuCl2 for 24 or 48 h. The qPCR method was used to quantify the mRNA levels of target genes. &P < 0.05 and &&P < 0.01 vs. RAW 264.7 cells treated with only PBS for 24 h; *P < 0.05 and **P < 0.01 vs. iRBC-stimulated RAW 264.7 cells for 24 h; $ P < 0.05 and $$ P < 0.01 vs. RAW 264.7 cells treated with only PBS for 48 h; # P < 0.05 and ## P < 0.01 vs. iRBC-stimulated RAW 264.7 cells for 48 h. Data are taken as mean ± SD. The experiment was conducted 4–5 times with similar results

References

    1. WHO. World Malaria Report 2023. Geneva: World Health Organization. 2023.
    1. Milner DA Jr. Malaria pathogenesis. Cold Spring Harb Perspect Med. 2018;8:a025569. - PMC - PubMed
    1. Balaji SN, Deshmukh R, Trivedi V. Severe malaria: biology, clinical manifestation, pathogenesis and consequences. J Vector Borne Dis. 2020;57:1–13. - PubMed
    1. Siagian FE. Pulmonary complication in severe malaria. IJPR. 2021;8:19–27.
    1. Taylor WRJ, Hanson J, Turner GDH, White NJ, Dondorp AM. Respiratory manifestations of malaria. Chest. 2012;142:492–505. - PubMed