

Multi-modal characterisation of early-stage, subclinical cardiac deterioration in patients with type 2 diabetes
- PMID: 39427200
- PMCID: PMC11491016
- DOI: 10.1186/s12933-024-02465-y
Multi-modal characterisation of early-stage, subclinical cardiac deterioration in patients with type 2 diabetes
Erratum in
-
Correction: Multi-modal characterisation of early-stage, subclinical cardiac deterioration in patients with type 2 diabetes.Cardiovasc Diabetol. 2025 Jan 29;24(1):43. doi: 10.1186/s12933-024-02563-x. Cardiovasc Diabetol. 2025. PMID: 39881292 Free PMC article. No abstract available.
Abstract
Background: Type 2 diabetes mellitus (T2DM) is a major risk factor for heart failure with preserved ejection fraction and cardiac arrhythmias. Precursors of these complications, such as diabetic cardiomyopathy, remain incompletely understood and underdiagnosed. Detection of early signs of cardiac deterioration in T2DM patients is critical for prevention. Our goal is to quantify T2DM-driven abnormalities in ECG and cardiac imaging biomarkers leading to cardiovascular disease.
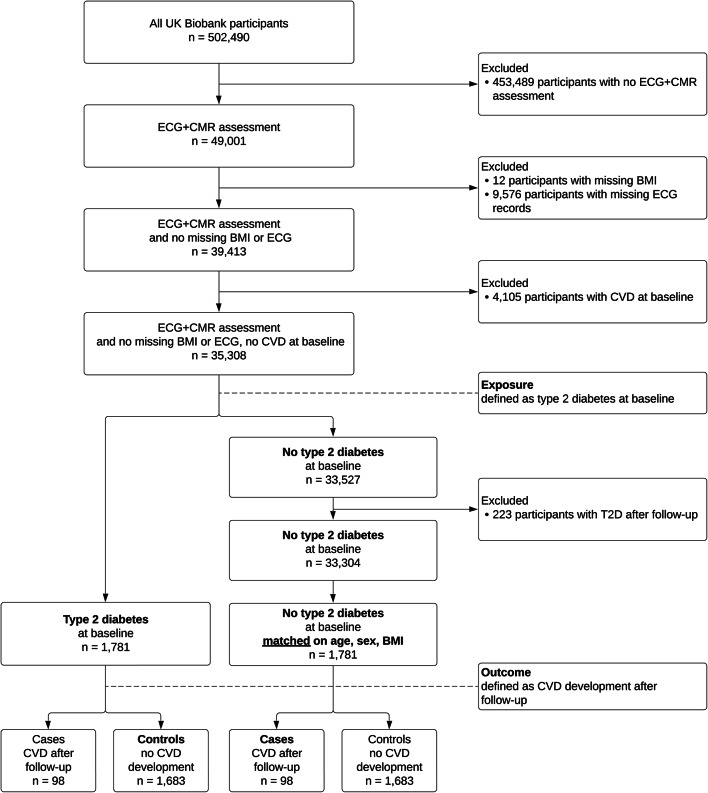
Methods: We quantified ECG and cardiac magnetic resonance imaging biomarkers in two matched cohorts of 1781 UK Biobank participants, with and without T2DM, and no diagnosed cardiovascular disease at the time of assessment. We performed a pair-matched cross-sectional study to compare cardiac biomarkers in both cohorts, and examined the association between T2DM and these biomarkers. We built multivariate multiple linear regression models sequentially adjusted for socio-demographic, lifestyle, and clinical covariates.
Results: Participants with T2DM had a higher resting heart rate (66 vs. 61 beats per minute, p < 0.001), longer QTc interval (424 vs. 420ms, p < 0.001), reduced T wave amplitude (0.33 vs. 0.37mV, p < 0.001), lower stroke volume (72 vs. 78ml, p < 0.001) and thicker left ventricular wall (6.1 vs. 5.9mm, p < 0.001) despite a decreased Sokolow-Lyon index (19.1 vs. 20.2mm, p < 0.001). T2DM was independently associated with higher heart rate (beta = 3.11, 95% CI = [2.11,4.10], p < 0.001), lower stroke volume (beta = -4.11, 95% CI = [-6.03, -2.19], p < 0.001) and higher left ventricular wall thickness (beta = 0.133, 95% CI = [0.081,0.186], p < 0.001). Trends were consistent in subgroups of different sex, age and body mass index. Fewer significant differences were observed in participants of non-white ethnic background. QRS duration and Sokolow-Lyon index showed a positive association with the development of cardiovascular disease in cohorts with and without T2DM, respectively. A higher left ventricular mass and wall thickness were associated with cardiovascular outcomes in both groups.
Conclusion: T2DM prior to cardiovascular disease was linked with a higher heart rate, QTc prolongation, T wave amplitude reduction, as well as lower stroke volume and increased left ventricular wall thickness. Increased QRS duration and left ventricular wall thickness and mass were most strongly associated with future cardiovascular disease. Although subclinical, these changes may indicate the presence of autonomic dysfunction and diabetic cardiomyopathy.
Keywords: Cardiovascular diseases; Cross-sectional studies; Diabetes mellitus (type 2); Electrocardiography; Magnetic resonance imaging; UK Biobank.
© 2024. Crown.
Conflict of interest statement
The authors declare no competing interests.
Figures
References
-
- Marx N, Federici M, Schütt K, Müller-Wieland D, Ajjan RA, Antunes MJ, et al. 2023 ESC Guidelines for the management of cardiovascular disease in patients with diabetes: developed by the task force on the management of cardiovascular disease in patients with diabetes of the European Society of Cardiology (ESC). Eur Heart J [Internet]. 2023;44(39):4043–140. 10.1093/eurheartj/ehad192. - PubMed
-
- World Health Organisation. https://www.who.int/health-topics/cardiovascular-diseases. [cited 2024 Jan 25]. Cardiovascular diseases. https://www.who.int/health-topics/cardiovascular-diseases
-
- Seferović PM, Paulus WJ, Rosano G, Polovina M, Petrie MC, Jhund PS, et al. Diabetic myocardial disorder. A clinical consensus statement of the Heart Failure Association of the ESC and the ESC working group on myocardial & pericardial diseases. Eur J Heart Fail. 2024 - PubMed
Publication types
MeSH terms
Substances
Grants and funding
LinkOut - more resources
Full Text Sources
Medical
