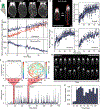
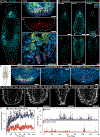
. 2024 Nov 26;43(11):114892.
doi: 10.1016/j.celrep.2024.114892. Epub 2024 Oct 19.

A genetic and microscopy toolkit for manipulating and monitoring regeneration in Macrostomum lignano

Affiliations

A genetic and microscopy toolkit for manipulating and monitoring regeneration in Macrostomum lignano

R Nelson Hall et al. Cell Rep. .

Abstract

Live imaging of regenerative processes can reveal how animals restore their bodies after injury through a cascade of dynamic cellular events. Here, we present a comprehensive toolkit for live imaging of tissue regeneration in the flatworm Macrostomum lignano, including a high-throughput cloning pipeline, targeted cellular ablation, and advanced microscopy solutions. Using tissue-specific reporter expression, we examine how various structures regenerate. Enabled by a custom luminescence/fluorescence microscope, we overcome intense stress-induced autofluorescence to demonstrate genetic cellular ablation and reveal the limited regenerative capacity of neurons and their essential role during wound healing, contrasting muscle cells' rapid regeneration after ablation. Finally, we build an open-source tracking microscope to continuously image freely moving animals throughout the week-long process of regeneration, quantifying kinetics of wound healing, nerve cord repair, body regeneration, growth, and behavioral recovery. Our findings suggest that nerve cord reconnection is highly robust and proceeds independently of regeneration.

Keywords: CP: Stem cell research; flatworms; live imaging; luminescence; nervous system; regeneration; transgenics.


Conflict of interest statement

Declaration of interests H.L. and M.P. are co-founders of Cephla, commercializing the Squid platform.

Figures

Figure 1.
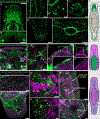
Figure 1.. A modular cloning protocol enables rapid generation of tissue-specific reporter lines
(A) A Diagram showing the design of the cloning toolkit. A parts library, composed of promoters, genes, and terminators, is used to assemble transcriptional units (TUs) via Golden Gate reactions (gray and brown regions), along with adapter oligos containing indexed unique sequences (UNS) that define their position in the later Gibson assembly. Within each reaction, each lettered site (A through D) ligates with its complementary overhang (matching colors), thus stitching together a complete TU flanked by the appropriate unique sequence adapters. A PCR reaction amplifies the assembled TUs and Gibson assembly, then combines TUs into a destination vector (pDest). Throughout this paper, transgenes are presented in the form “pPromoter:Gene:tTerminator.” (B) Maximum intensity projection (MIP) of a confocal stack showing mNeonGreen fluorescence in the pEnolase:GeNL:tEnolase strain. Dashed boxes: general regions shown in (C). A-P, anterior-posterior. Scale bar: 100 μm. (C) Example images of the pEnolase:GeNL:tEnolase transgene expression across various tissues. Scale bars: 20 μm (i and ii) and 10 μm (iii–vi). (D) Confocal MIP of an animal expressing pPC2:GeNL-NTR2.0:tPC2. Scale bar: 100 μm. All animals were imaged live and anesthetized with 7.14% MgCl2. See also Figure S1 and Video S1.
Figure 2.
Figure 2.. Tissue-specific labeling resolves detailed anatomy
(A) Confocal MIP of the nervous system in the anterior. Arrowheads (from top to bottom): anterior sensory projections, neuropil, and nerve ring around the pharynx. (B) A close-up of the two photoreceptor cells and the visual axons. (C) The major ventral nerve cord (VNC, left) and minor nerve cords (middle and right). (D) An overview of the nervous system in the tail showing VNCs looping around the tail base. (E) Neurons posterior to the VNC loop each sending a projection into the VNC and another outward. (F) A circular arrangement of neurons around the opening of the stylet. (G) Dense nerve fibers around the opening of the antrum. (H) Tiled gut cells with highly vacuolated cytoplasm. (I) Large pAPOB::GeNL+ cells (green) enclosing other cells (magenta) present in the anterior of the animal. Arrowheads: enclosed cells. (J) Ovaries (magenta) are wrapped by pAPOB::GeNL+ cell bodies (green) on the exterior, which extend cytoplasmic processes around individual oocytes. (J′)A magnified view. (K) A pAPOB::GeNL+ cell (green) sits on the exterior of the testes (magenta). (K′) A magnified view of this cell, which extends a long process down the length of the testes. (L) Crosshatched circular and diagonal muscles (green) with intestinal cells beneath (magenta). (M) An overview of the muscular structure in the tail showing the male copulatory apparatus (green). Arrowhead: the stylet opening. (N) The male copulatory apparatus, with the false seminal vesicle (fsv), seminal vesicle (sv), and stylet (st) wrapped by muscles (green). Abundant prostate gland cells (magenta) surround the seminal vesicles and stylet. (O) Individual muscle cell bodies hang like beads from circular muscle fibers (green) around the gut (magenta). Arrowheads: gut muscle fibers. (P) Body-wall muscles and gut muscles (green) sandwich the ovaries (magenta). Dashed line: gut boundary. Arrows trace the two layers of muscles. (Q) The antrum is surrounded by concentric muscle rings intersected by a second set of perpendicular radial muscle cells (green). Arrows trace the radial and perpendicular muscle fibers. (R) Schematics showing the regions imaged in (A)–(Q) (dashed boxes). Scale bars: 50 μm (A, D), 20 μm (B, C, G, H, L–O, Q), and 10 μm (E, F, I–K, P). All animals were imaged live and anesthetized with 7.14% MgCl2. See also Figures S1 and S2; Videos S1 and S2.
Figure 3.
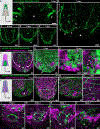
Figure 3.. Time-course imaging using tissue-specific reporters reveals stages of posterior regeneration
(A) (Left) Cartoon showing an amputated animal with the nervous system highlighted. Dashed line: amputation plane. (Right) Confocal MIP of a posterior-facing wound at 6 hpa. VNCs (arrowheads) are severed but extend projections toward the wound site (asterisk). (B) Another view of severed VNCs extending projections toward the wound (asterisk) forming loops with minor nerve cords (arrowheads trace the loop). (C) By 48 hpa, VNCs have reconnected fully. (D) By 4 dpa, neurons posterior to the VNC loop have begun repopulating the tail. (E) By 7 dpa, the posterior neurons have regained their normal configuration. (F) (Left) Cartoon showing an amputated animal with GeNL expression in the gut (green) and ubiquitous mScarlet expression (magenta). (Right) By 6 hpa, the epithelium (magenta) is stretched toward the wound with the gut underneath (green). (G) A confocal slice deeper into the tissue showing the gut (green) appearing immediately beneath the epithelium (magenta) at the wound. (H) By 24 hpa, presumptive phagocytes adjacent to the gut (green) are in close contact with cells in the blastema (magenta) (left). (H′) A magnified view showing that numerous blastemal cells (magenta) are surrounded by cytoplasmic processes of pAPOB::GeNL+ cells (green) (right). (I) (Left) Cartoon showing an amputated animal with GeNL expression in muscles (green) and ubiquitous mScarlet expression (magenta) (left). (Right) At 6 hpa, circular muscles are wavy and buckled as the wound (asterisk) closes. (J) By 24 hpa, muscles (green) enclose the wound. (J′) A magnified view showing slight disorganization in the new muscle network (green) in the blastema. (K) Example of a muscle fiber at 3 dpa with a terminus ending in many filamentous projections (arrowhead). (L–O) Staged progression of male reproductive organ regeneration. (L) Stage 1: a ring of GeNL+ cells appears in the posterior blastema. (M) Stage 2: multiple rings of GeNL+ cells outline the primordia of seminal vesicles and stylet. A stylet primordium begins to form (arrowhead). (N) Stage 3: the rings continue to grow into larger chambers as the stylet continues to elongate, and the prostate gland cells (magenta) extend projections into the chambers and growing stylet (arrowhead). (O) Stage 4: the stylet adopts its final bent shape, the chambers have grown into matured seminal vesicles, and numerous prostate gland cells send abundant processes into the stylet. Numbers indicate GeNL+ circular rings. Scale bars: 20 μm (B-J), 10 μm (A, L–O, H′, J′), 5 μm (K). All images are oriented with the anterior facing up. All animals were imaged live and anesthetized with 7.14% MgCl2. See also Video S3.
Figure 4.
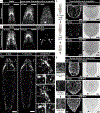
Figure 4.. Luminescence imaging tracks neural ablation outcomes
(A and B) Time-course fluorescence (A) and luminescence (B) images of PC2 animals after neural ablation. Arrowheads: lateral ganglia. (C) Luminescence images of the same animal immediately after 6 days of MTZ (5 mM) treatment (left) followed by 7 days of recovery in ASW (middle). The highlighted regions (dashed boxes, i, i*) show little change between the two time points in the lateral ganglia. Further magnified views (dashed boxes, ia, ib, i*a, i*b) show specific cell arrangements that can be mapped between the time points to highlight the lack of change (right). (D) Neural ablation prevents wound healing and subsequent regeneration. Control animals treated with 0.5% DMSO successfully reconnect their VNCs and close the epidermis (top) (n = 4/4). Animals after neural ablation fail to heal by 24 hpa (middle) (n = 6/7). By 48 hpa, epidermal integrity continues to deteriorate (bottom) (n = 5/8). All ablated and amputated animals (n > 40) lysed by 7 dpa. Arrowheads: wound sites. (E) Muscle ablation results in disruption to diagonal and circular muscles but does not prevent wound healing and regeneration after amputation. Control animals treated with 0.5% DMSO successfully close their wounds. Animals treated with 5 mM MTZ for 7 days show severe disruption and loss of circular and diagonal muscle fibers, yet successfully heal their wounds after amputation, similar to controls. By 7 dpa, animals have recovered much of their muscle fiber network, and tails have regenerated. Arrowheads indicate closed wounds (top and middle) and a regenerating tail (bottom). All animals were imaged live and anesthetized with 7.14% MgCl2 supplemented with FFz for luminescence imaging. Scale bars: 100 μm (A–C) and 50 μm (D, E). See also Figure S3 and Video S3.
Figure 5.
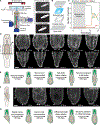
Figure 5.. Tracking microscopy enables continuous imaging of posterior neural regeneration in free-moving animals
(A) (Left) Diagram of the tracking microscope. (Right) Overview of the tracking routine involving IR imaging, segmentation, and stage repositioning. (B) Exploded diagram of the long-term imaging chamber. (C) Survival curve of ten animals placed in individual chambers and maintained at room temperature in darkness. All animals were phenotypically normal and active up to 9 days, when half of the animals began reducing their movement and forming mucus cysts. By week 3, only one animal had lysed. (D) Representative images of neural repair and regeneration from a head fragment taken from a continuous week-long tracking fluorescence microscopy session. Images are from the region highlighted in the cartoon (dashed box). Scale bar: 100 μm. (E) Cartoon showing the different stages of neural repair and regeneration following a horizontal cut. (F) Representative fluorescence images of neural repair and regeneration from an oblique cut. Arrowheads: termini of the ventral nerve cords. Scale bar: 100 μm. (G) Cartoon showing the course of neural repair and regeneration after an oblique cut. The oblique cut introduces an asymmetry evident in the uneven extension of the VNCs and offsets the location of regenerated tail plate. In the first 30 hpa, the left nerve cord extends a longer distance than the right, eventually meeting slightly off-center by 40 hpa. By 65 hpa, the tail plate begins to form adjacent to the point of nerve cord reconnection, consistent with the anatomical posterior of the animal, and the tail continues to re-center by 80 hpa. See also Figure S5 and Video S4.
Figure 6.
Figure 6.. Continuous live imaging allows quantification of regeneration progress across scales
(A) (Left) Schematic of oblique amputation. Nerve cords are manually annotated from the lateral ganglia (large upper dots) to the termini of the nerve cords (large lower dots). Scale bar: 50 μm. (Middle) The length of each nerve cord is plotted over time, showing linear extension. (Bottom) The Euclidian distance between the nerve cord termini also decreases linearly. Dashed lines: time points corresponding to the fluorescence images shown above. (B) Example showing body extension during regeneration (top left). Scale bar: 50 μm. Quantification of body length in three animals. The length of the animal is normalized to the starting length, and the data are fit to a curve y=y0y1ekx, where y is the length of the animal, y0 is the final length, y0y1 is the starting length of the animal, k is the time constant, and x is time. Dots: data points. Lines: best fit. (C) Activity score of a tracked animal over ~140 h. The highlighted regions correspond to a period of quiescence (left) in which the animal remains stationary, and a period of high activity (right) in which the animal explores much of its enclosure (dashed circle). Trajectories of the animal’s position over time in each time period are shown above. (D) Example fluorescence images of tracked animals during the quiescent and active periods. Each image is spaced ~20–25 min apart. During times of high activity, the animal is often stretched, whereas the animal occasionally bends during the quiescent period. Scale bar: 100 μm. (E) Normalized average activity within 10-h windows measured from the activity score in (C). Dotted line: low average activity during the first 30 hpa, followed by an increase in average activity. See also Figure S5.
Figure 7.
Figure 7.. Multi-modal imaging characterizes posterior regeneration defects in β-catenin RNAi animals
(A) Homeostatic expression of β-catenin (cyan) and wnt-1 (red) in intact animal. (i) An overview of the whole animal. (ii) A magnified view showing adhesive glands (yellow) in relation to wnt-1 expression (red). (iii) The same view as (ii) showing just wnt-1 expression. Dashed line: outline of the tail plate. (iv) wnt-1+ cells and PNA-stained adhesive glands are adjacent to each other in the posterior. Scale bars: 50 μm (i), 20 μm (ii and iii), and 10 μm (iv). (B) β-catenin (cyan) and wnt-1 (red) expression after amputation. By 0.5 hpa, neither β-catenin nor wnt-1 expression is activated at wounds. By 6 hpa, β-catenin is upregulated around the gut in both anterior and posterior fragments and highly concentrated at wounds. Finally, at 24 hpa, β-catenin expression is largely restricted to the wounds in both anterior and posterior fragments, with wnt-1 expression beginning to appear in the new posterior pole of the anterior fragment. Arrowheads: wound sites. Box and inset: β-catenin and wnt-1 expression localized to the posterior pole at 24 hpa. Scale bars: 50 μm. (C) Cartoon of the amputation made (far left). The posteriors of control (left, n = 4/4) showing a regenerated array of adhesive glands and wnt-1+ cells. In contrast, β-catenin RNAi animals show none (middle, n = 16/22) or few (right, n = 6/22) wnt-1+ cells and no adhesive glands at 7 dpa. Scale bars: 20 μm. (D and E) Luminescence imaging of control-treated (left) and β-catenin RNAi-treated (right) PC2 animals. At 24 hpa (D), animals in both groups heal the wound and the VNCs reconnect. At 7 dpa (E), control animals regenerate a full tail with neurons innervating the tail plate (arrow), while β-catenin RNAi animals show no tail regeneration or tail-plate neurons radiating from the ventral nerve cord. Scale bars: 100 μm. (F) Normalized body length of control (blue) or β-catenin RNAi animals (red) showing no growth after β-catenin knockdown. Dots: individual data points. Lines: best fit. (G) Activity score of control animals (top) compared to β-catenin RNAi animals (bottom) showing the lack of recovery after β-catenin knockdown. Animals in (A)–(C) were fixed and mounted for imaging, while animals in (D) and (E) were imaged live and anesthetized with 7.14% MgCl2 supplemented with FFz for luminescence imaging. See also Figures S6 and S7.

References

    1. Poss KD, and Tanaka EM (2024). Hallmarks of regneration. Cell Stem Cell 31, 1244–1261. - PMC - PubMed
    1. Tanaka EM (2016). The molecular and cellular choreography of appendage regeneration. Cell 165, 1598–1608. - PubMed
    1. Reddien PW (2018). The cellular and molecular basis for planarian regeneration. Cell 175, 327–345. - PMC - PubMed
    1. Currie JD, Kawaguchi A, Traspas R, Schuez M, Chara O, and Tanaka E. (2016). Live imaging of axolotl digit regeneration reveals spatiotemporal choreography of diverse connective tissue progenitor pools. Dev. Cell 39, 411–423. - PMC - PubMed
    1. Zattara EE, Turlington KW, and Bely AE (2016). Long-term time-lapse live imaging reveals extensive cell migration during annelid regeneration. BMC Dev. Biol 16, 6. - PMC - PubMed

Publication types

Associated data

LinkOut - more resources