. 2024 Dec;103(12):104369.
doi: 10.1016/j.psj.2024.104369. Epub 2024 Sep 28.

Effects of dietary paddy rice on the growth, serum biochemistry, intestinal development, microbiota, and metabolism of young laying ducks in a rice-duck-crayfish farming system

Affiliations

Effects of dietary paddy rice on the growth, serum biochemistry, intestinal development, microbiota, and metabolism of young laying ducks in a rice-duck-crayfish farming system

Xiaolong He et al. Poult Sci. 2024 Dec.

Abstract

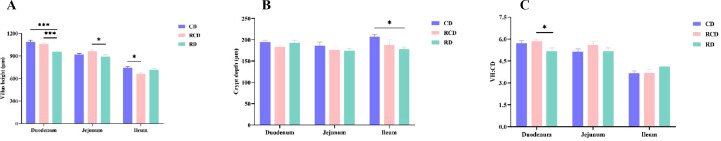
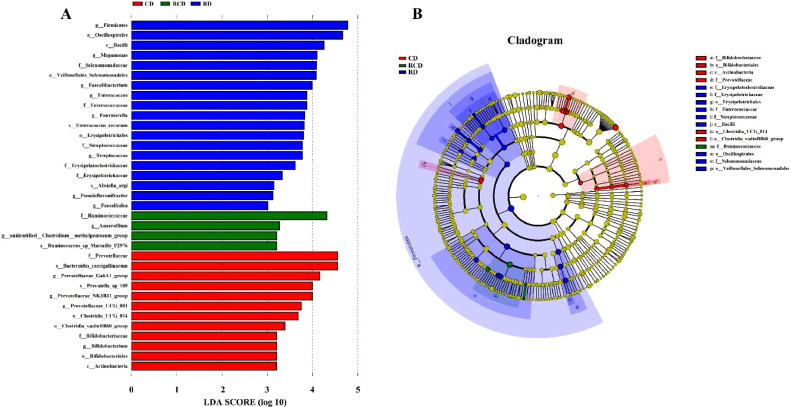
This study investigated the effects of feeding paddy rice on the physiology, metabolism, and gut microbiota of ducks in a rice-duck-crayfish (RDC) system. A total of 540 ducks (20-days-old) were randomly divided into 3 groups with 3 replicates and 60 ducks per replicate. The 40-d experiment involved 3 diet treatments: a complete diet (CD), 50% paddy rice + 50% complete diet (RCD), and 100% paddy rice diet (RD). Results show that feeding paddy rice did not significantly affect duck growth, the final weight in the RD group was reduced by 5%, and the feed-to-gain ratio increased by 7% compared to the CD group. Additionally, compared with the CD group, the keel length, gizzard and proventriculus indices, and serum high-density lipoprotein levels increased (P < 0.05), and duodenal villus height and ileal crypt depth (P < 0.05) reduced in the RD group and ileal villus height decreased in the RCD group (P < 0.05). Compared with the CD group, the cecal abundance of Bacteroidota, Prevotellaceae_Ga6A1_group, and Prevotellaceae_NK3B31_group decreased in the RD group (P < 0.05) while the abundance of Firmicutes, Megamonas and Faecalibacterium increased (P < 0.05). Metabolome analysis revealed that serum citric acid increased (P < 0.05) in the RCD and RD groups, whereas cytidine, cytosine, and 4-aminobutyric acid decreased (P < 0.05) in the RD group. In conclusion, these preliminary results suggest that paddy rice supplementation under an RDC system had no significant effect on duck growth, but it did cause changes in intestinal morphology, microbiota, and serum metabolic profiles. However, it is important to note that the limited overall number of replicates in this study contributed to a certain degree of high variance. While the growth differences among groups were not statistically significant, the full replacement of paddy rice still poses potential performance losses. In practical applications, this finding provides a reference for the RDC system, but further validation through larger-scale trials is required.

Keywords: duck; gut microbiota; metabolome; paddy rice; rice–duck–crayfish farming.


Figures

Figure 1
Figure 1
Effects of dietary paddy rice on the intestinal morphology of young laying ducks in a rice–duck–crayfish farming system. Data were shown as Mean ± SEM. Asterisks indicate significant differences as per the one-way ANOVA (* P < 0.05, ** P < 0.01, *** P < 0.001). Abbreviations: CD = Complete Diet, RCD = 50% Paddy Rice+50% Complete Diet, RD = 100% Paddy Rice Diet, VH:CD = villus height: crypt depth.
Figure 2
Figure 2
Diversity analysis of gut microbiota. (A) Venn diagram of the shared or unique ASVs of CD, RCD and RD groups. (B) The Chao1 index, Shannon index, Simpson index and Observed_species index were used to describe the ɑ diversity of gut microbiota of ducks. (C)Principal coordinate analysis (PCoA) based on weighted UniFrac distance of all the samples, and (D) non-metric multidimensional scaling analysis (NMDS) (n = 6 per group). Abbreviations: CD, complete diet, RCD, 50% paddy rice+50% complete diet, RD, 100% paddy rice diet.
Figure 3
Figure 3
Analysis of the composition of cecal microbiota. (A, C) Changes in the relative abundance of bacteria at levels of phylum and genus, respectively. (B, D) Differential bacterial relative abundance at the phylum and genus level between groups. Data are expressed as Mean ± SEM (n = 6 per group). Asterisks indicate significant differences (*P < 0.05, **P < 0.01). Abbreviations: CD, complete diet, RCD = 50% paddy rice+50% complete diet, RD = 100% paddy rice diet.
Figure 4
Figure 4
The linear discriminant analysis effect size (LEfSe) analysis of cecum differential microorganisms in CD, RCD, and RD groups. (A) Linear discriminant analysis (LDA) bar showed the change of the abundance of each species on the difference between the 3 groups (LDA score > 3.0). (B)The cladogram shows the phylogenetic distribution of microbiota between 3 groups. The nodes with different color represent the microbes that are significantly enriched in the corresponding groups. The yellow nodes represent the microbes that have no significant difference between the 3 groups. Abbreviations: CD, complete diet; RCD, 50% paddy rice+50% complete diet; RD, 100% paddy rice diet.
Figure 5
Figure 5
Metabolite profile analysis of serum by untargeted LC-MS/MS metabolomics. (A, B) 3D and 2D graph of PCA analysis among CD, RCD and RD groups (n = 6 per group). (C) Partial least squares-discrimination analysis (PLS-DA). The plot of serum metabolite profiles indicating the significantly different serum metabolite profiles among 3 groups. Abbreviations: CD, complete diet; RCD, 50% paddy rice+50% complete diet; RD, 100% paddy rice diet.
Figure 6
Figure 6
Analysis of differential metabolites. (A)Volcanic diagram. Each point represents a metabolite. The significantly up-regulated metabolites are represented by red dots, while down-regulated metabolites are represented by blue dots (n = 6 per group). (B) Serum differential metabolites pathways enriched by Kyoto Encyclopedia of Genes and Genomes (KEGG) among 3 groups. The color of the spot indicates P-value. The size of the spot represented the number of different metabolites enriched. (C) The enriched to key metabolites of metabolic pathways. * P < 0.05, ** P < 0.01. Abbreviations: CD, complete diet; RCD, 50% paddy rice+50% complete diet; RD, 100% paddy rice diet.
Figure 7
Figure 7
(A, B and C) Heatmaps of Spearman's correlation between differential microbiota and differential metabolites. The horizontal and vertical coordinates represent differential flora (phylum and genus level) and differential metabolites. Red indicates a positive correlation; the blue indicates a negative correlation, and the darker the color represents the stronger the correlation. Abbreviations: CD, complete diet; RCD, 50% paddy rice+50% complete diet; RD, 100% paddy rice diet. * P < 0.05, ** P < 0.01, *** P < 0.001.

References

    1. Abazari A., Navidshad B., Aghjehgheshlagh F.M., Nikbin S. The effect of rice husk as an insoluble dietary fiber source on intestinal morphology and Lactobacilli and Escherichia coli populations in broilers. Iran. J. Vet. Med. 2016;10:217–224.
    1. Adewole D.I., Oladokun S., Santin E. Effect of organic acids–essential oils blend and oat fiber combination on broiler chicken growth performance, blood parameters, and intestinal health. Anim. Nutr. 2021;7:1039–1051. - PMC - PubMed
    1. Anderson J.W., Jones A.E., Riddell-Mason S. Ten different dietary fibers have significantly different effects on serum and liver lipids of cholesterol-fed rats. J. Nutr. 1994;124:78–83. - PubMed
    1. Arnold P.K., Jackson B.T., Paras K.I., Brunner J.S., Hart M.L., Newsom O.J., Alibeckoff S.P., Endress J., Drill E., Sullivan L.B., Finley L.W.S. A non-canonical tricarboxylic acid cycle underlies cellular identity. Nature. 2022;603:477–481. - PMC - PubMed
    1. Biddle A., Stewart L., Blanchard J., Leschine S. Untangling the genetic basis of fibrolytic specialization by Lachnospiraceae and Ruminococcaceae in diverse gut communities. Diversity. 2013;5:627–640.