. 2024 Oct 20;21(1):268.
doi: 10.1186/s12974-024-03262-w.

MOG-specific CAR Tregs: a novel approach to treat multiple sclerosis

Affiliations

MOG-specific CAR Tregs: a novel approach to treat multiple sclerosis

Jihane Frikeche et al. J Neuroinflammation. .

Abstract

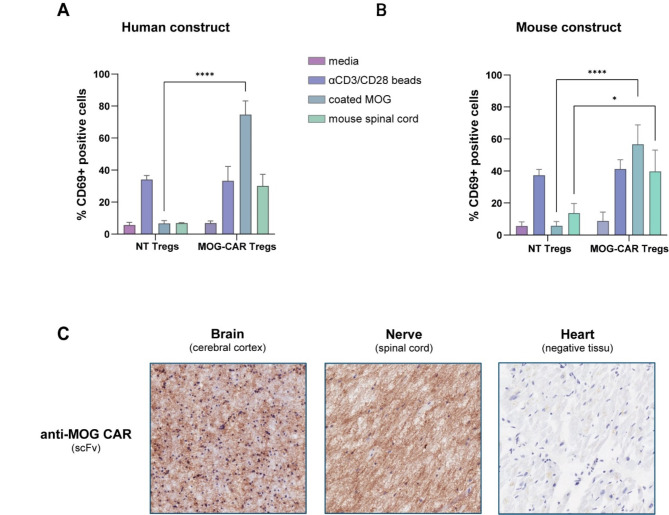
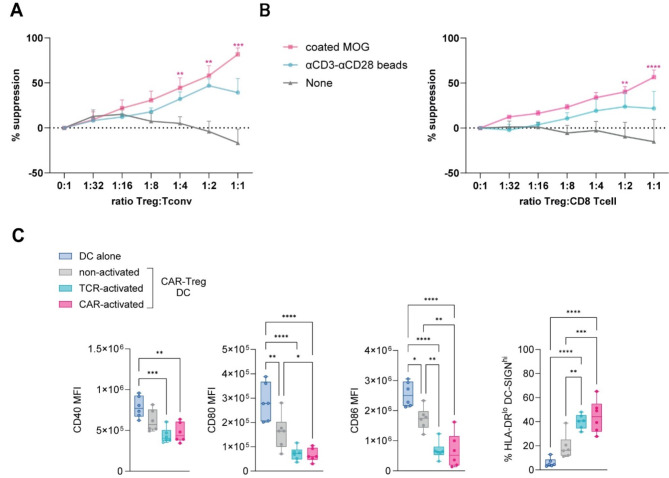
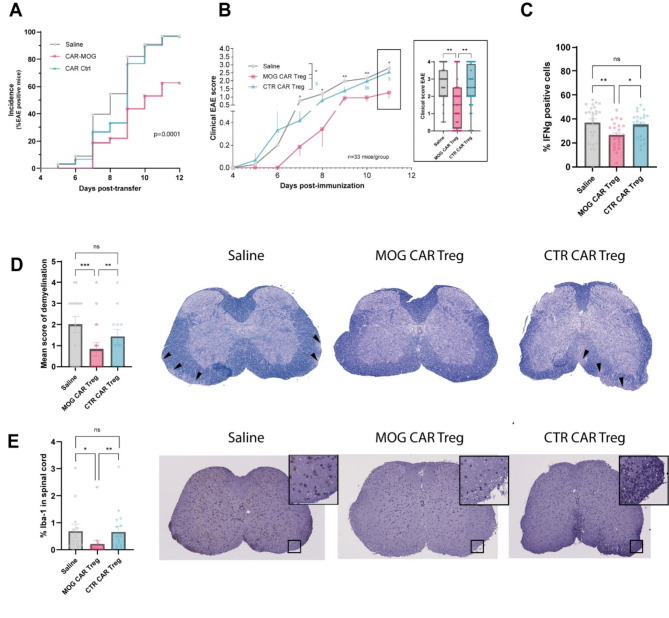
Multiple sclerosis (MS) is an autoimmune disease affecting the central nervous system (CNS) with the immune system attacking myelin sheaths leading to neuronal death. While several disease-modifying therapies are available to treat MS, these therapies are not universally effective and do not stop disease progression. More personalized long-term treatment options that target specific aspects of the disease, such as reducing relapse frequency, delaying disability accumulation, and addressing symptoms that impact daily functioning, as well as therapies that can promote neuroprotection and repair are needed. Chimeric Antigen Receptor (CAR) Tcell therapies have revolutionized cancer treatment by intravenously (IV) administering a defined dose of T cells with high specificity provided by the CAR. An autologous CAR T cell therapy using suppressive regulatory T cells (Tregs) inducing long-lasting tolerance would be the ideal treatment for patients. Hence, we expanded the application of CAR-T cells by introducing a CAR into Tregs to treat MS patients. We developed a myelin oligodendrocyte glycoprotein (MOG)-specific CAR Treg cell therapy for patients with MS. MOG is expressed on the outer membrane of the myelin sheath, the insulating layer the forms around nerves, making it an ideal target for CAR Treg therapy. Our lead candidate is a 2nd generation CAR, composed of an anti-MOG scFv screened from a large human library. In vitro, we demonstrated CAR-dependent functionality and showed efficacy in vivo using a passive EAE mouse model. Additionally, the MOG-CAR Tregs have very low tonic signaling with a desirable signal-to-noise ratio resulting in a highly potent CAR. In summary our data suggest that MOG-CAR Tregs are a promising MS treatment option with the potential to induce long-lasting tolerance in patients.

Keywords: CAR-Treg; Cell therapy; MOG; Multiple sclerosis.


Conflict of interest statement

The authors declare no competing interests.

Figures

Fig. 1
Fig. 1
Design, generation and expression of MOG-CAR construct in human and mouse Tregs. (A) Top: Cross reactivity of the scFv analyzing the binding of scFv-streptavidin to human or mouse MOG protein. Bottom: Schematic diagram of the mouse and human MOG-CAR constructs. (B) Representative plot of transduction. Naïve Tregs were left untransduced (NT Tregs) or transduced with a MOG-CAR. At the end of the expansion, cells were analyzed by flow cytometry for CAR expression. GFP and Protein L double positive cells were analyzed to determine the percentage of transduction of the human construct. NGFR positive cells expressed the percentage of transduction for mouse MOG-CAR construct. The percentage of transduction of the human MOG-CAR construct (GFP+ProtL+) and the mouse MOG-CAR construct (NGFR+) was between 50–60%. (C) Phenotype of not transduced and MOG-CAR human Tregs after 12 days of expansion (D) Percentage of FOXP3 expression in mouse MOG-CAR Tregs during 13 days of expansion
Fig. 2
Fig. 2
Human and mouse MOG-CAR Tregs are functionally active in vitro and recognize MOG in human tissue. Percentage of CD69 expression (activation marker) on human (A) or mouse (B) Not transduced Tregs (NT) or CAR-Tregs after 24 h treatment with culture media (media), anti-CD3/CD28 beads, 3 µg of recombinant MOG protein or spinal cord isolated from C57Bl/6 mice. Two-way ANOVA with Šídák’s multiple comparisons test was performed. *p < 0.05, **p < 0.01, ***p < 0.001, ****p < 0.0001. (C) Histology analysis staining MOG protein on human brain/spinal cord with anti-MOG CAR (scFv) (Brown staining: MOG). Human heart tissue was used as an irrelevant control tissue
Fig. 3
Fig. 3
Human MOG-CAR Tregs mediate target-antigen-specific immunosuppression and immunomodulation. (A) Suppression of human CD4 polyclonally stimulated responder T cell (Tconv) proliferation by human MOG-CAR Tregs in co-culture. Human Tregs were pre-stimulated with culture media (None), anti-CD3/CD28 beads, or MOG-coated protein. The graph represents the mean of 5 donors. (B) Suppression of human CD8 polyclonally stimulated responder T cell proliferation by human MOG-CAR Tregs in co-culture. Human Tregs were pre-stimulated with culture media (None), anti-CD3/CD28 beads, or MOG-coated protein. The graph represents the mean of 4 donors. Two-way ANOVA with Tukey’s multiple comparisons test was performed. *p < 0.05, **p < 0.01, ***p < 0.001, ****p < 0.0001. (C) MOG-CAR Tregs inhibited the maturation of monocyte-derived dendritic cells (DC). Autologous immature DC were treated with LPS to induce maturation (DC alone) or co-cultured with pre-stimulated MOG-CAR Tregs in the presence of LPS (CAR-Treg DC). After 3-days co-culture, DC phenotype was analyzed for surface expression of CD80, CD86, CD40, DC-SIGN and HLA-DR. One-way ANOVA with Tukey’s multiple comparisons test was performed. *p < 0.05, **p < 0.01, ***p < 0.001, ****p < 0.0001
Fig. 4
Fig. 4
MOG-CAR Tregs engineered from MS patient blood are functionally active in vitro. (A) Percentage of naïve Tregs (CD25hi CD127lo CD45RA+) among the CD4 cells of healthy donors and RRMS patients. (B) Fold expansion of healthy donors (grey) and RRMS patients (red) Tregs between day 0 to day 11 of the culture. (C) Percentage of transduction of the MOG-CAR with the lentivirus vector (at 1.107UI/ml) in Tregs from healthy donors and RRMS patients. (D) Percentage of FOXP3 expression, FOXP3 TSDR hypomethylation and Helios expression on Tregs from healthy donors and RRMS patients. (E) Activation of MOG-CAR Tregs from healthy and RRMS patients analyzed using activation marker CD69 expression at cell surface of Tregs. Tregs were incubated 24 h with media, anti-CD3/CD28 beads or coated MOG (3 µg/ml). (F) Suppression of human CD4 polyclonally stimulated responder T cell (Tconv) proliferation by human MOG-CAR Tregs from healthy donors or RRMS patients in co-culture. Human Tregs were pre-stimulated with culture media (no activation), anti-CD3/CD28 beads, or MOG coated protein (3 µg/ml). Two-way ANOVA with Tukey’s multiple comparisons test was performed. *p < 0.05, **p < 0.01
Fig. 5
Fig. 5
MOG-CAR Tregs localize in the CNS of EAE mice. (A) and (B) are experiments performed in PLP induced EAE in SJL mice. Bioluminescence (photon/sec) of mice (A) and organs (B) from immunized or not immunized SJL mice. Mice were injected with MOG-CAR Tregs or with saline solution (No CAR Tregs). The graph shows the quantification of photons in the brain from day 9 to day 18. In (B) the graph shows the bioluminescence in the different organs at day 14. (C) was performed in another EAE model (adoptive transfer EAE). Number of mouse transduced Tregs (CD4+FOXP3+NGFR+) in the CNS of EAE mice after treatment with MOG-CAR Tregs or CTRL CAR Tregs. Cell number under 20 were considered as a background. Mann Whitney test was performed. *p < 0.05
Fig. 6
Fig. 6
MOG-CAR Tregs delay the onset of EAE and reduce CNS inflammation. Monitoring of incidence (A) and clinical score (B) of passive EAE in C57Bl/6 mice. Mice were injected with pathogenic cells from donors’ mice and 24 h later MOG-CAR (pink), Ctrl-CAR Tregs (blue) or saline solution (grey) were injected i.v. Error bars represent mean ± SEM from 4 independent experiments including 33 mice/group. 2-way Anova Tukey’s multiple comparison was performed (Statistics MOG-CAR versus Saline: *<0.05, **<0.005, Statistics MOG-CAR versus CAR Ctrl: $<0.05, $$<0.005). (C) Percentage of IFN-γ positive CD4 cells after ex-vivo stimulation with MOG peptide. After mice sacrifice, cells recovered from the from CNS were incubated O/N with MOG peptide (10 µg/ml). 16 h later BFA was added to the media and intracellular staining was performed. Error bars represent mean ± SEM from 4 independent experiments including 33 mice/group. Stats: One-way ANOVA with Tukey’s multiple comparisons test. (D) The graph shows the mean score of demyelination for each spinal cord section. The mean score is (sum (number of spinal cord sections affected x severity)) / total number of spinal cord sections examined in each group. On the right: Representative transverse section of spinal cord from EAE mice stained with Luxol blue. Black arrows show demyelinated zone. (E) The graph represents the marked area after normalization in % of Iba-1 immunostainings obtained in spinal cord. Kruskal-Wallis test with multiple comparisons *<0.05, **<0.005. On the right: Representative transverse section of spinal cord from EAE mice stained with Iba-1 (brown staining)

References

    1. Noseworthy John H. Progress in determining the causes and treatment of multiple sclerosis. Nature. 1999;399(6738Suppl):A40–47. - PubMed
    1. Raine CS, Cross AH. Axonal dystrophy as a consequence of long-term demyelination. Lab Invest. 1989;60(5):714–25. - PubMed
    1. Martin R, et al. Molecular Mimicry and Antigen-specific T cell responses in multiple sclerosis and chronic CNS Lyme Disease. J Autoimmun. 2001;16(3):187–92. - PubMed
    1. O’Connor KC, Bar-or A, Hafler DA. The neuroimmunology of multiple sclerosis: possible roles of T and B lymphocytes in immunopathogenesis. J Clin Immunol. 2001;21(2):81–92. - PubMed
    1. Verma Nirupama D, et al. Multiple sclerosis patients have reduced resting and increased activated CD4 + CD25 + FOXP3 + T regulatory cells. Sci Rep. 2021;11(1):10476. - PMC - PubMed

MeSH terms

Substances

LinkOut - more resources