. 2024 Nov 15;151(22):dev202892.
doi: 10.1242/dev.202892. Epub 2024 Nov 15.

Viscous shear is a key force in Drosophila ventral furrow morphogenesis

Affiliations

Viscous shear is a key force in Drosophila ventral furrow morphogenesis

Amanda Nicole Goldner et al. Development. .

Abstract

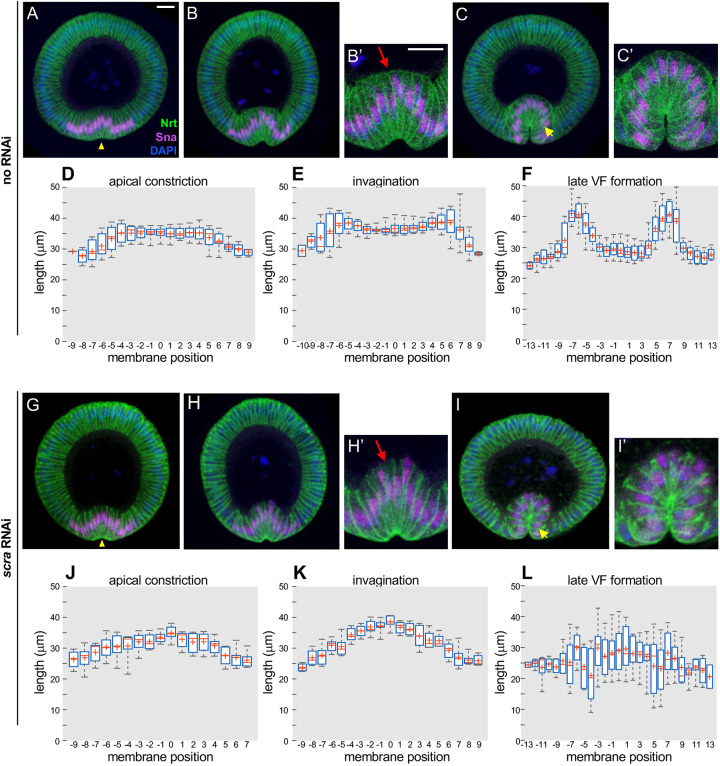
Ventral furrow (VF) formation in Drosophila melanogaster is an important model of epithelial folding. Previous models of VF formation require cell volume conservation to convert apically localized constriction forces into lateral cell elongation and tissue folding. Here, we have investigated embryonic morphogenesis in anillin knockdown (scra RNAi) embryos, where basal cell membranes fail to form and therefore cells can lose cytoplasmic volume through their basal side. Surprisingly, the mesoderm elongation and subsequent folding that comprise VF formation occurred essentially normally. We hypothesized that the effects of viscous shear may be sufficient to drive membrane elongation, providing effective volume conservation, and thus driving tissue folding. Since this hypothesis may not be possible to test experimentally, we turned to a computational approach. To test whether viscous shear is a dominant force for morphogenesis in vivo, we developed a 3D computational model incorporating both accurate cell and tissue geometry, and experimentally measured material parameters. Results from this model demonstrate that viscous shear generates sufficient force to drive cell elongation and tissue folding in vivo.

Keywords: Drosophila; Anillin; Gastrulation; Morphogenesis; Shear; Viscosity.


Conflict of interest statement

Competing interests The authors declare no competing or financial interests.

Figures

Fig. 1.
Fig. 1.
Basal membranes are not required for VF formation. Confocal immunofluorescence (A-C′,G-I′) and quantification of tissue morphology (D-F,J-L) in controls lacking scraTRiP (A-F) and in scra RNAi (G-L) embryos. (D-F,J-L) The x-axis in the plot is the membrane position counted as the number of cells between it and the ventral midline, with negative numbers to the left and positive to the right; the ventral midline is identified as the center of the pattern of Snail expression. (A,G) Embryos at apical constriction stage. Yellow arrowheads indicate the apical surface of ventral mesoderm cells, which are constricting in both genetic backgrounds. (B,H) Embryos at early invagination stage. Ventrally located (Snail positive) mesoderm cells elongate along their apical-basal axis in both genotypes, and tissue invagination has begun. Basal surfaces, indicated by red arrows in B′ and H′, are closed in control but remain open in scra RNAi embryos. (C,I) Embryos at late VF stage. Mesodermal cells have fully invaginated into the interior of the embryo in both genotypes, although basal surfaces still remain open in scra RNAi embryos. Yellow arrows indicate the peripheral VF cells, which are shorter in scra RNAi than in control. All images shown were cropped, rotated ventral side down and set against a black background. (C′,I′) Higher magnifications of C,I. Scale bars: 20 µm. (D-F) Mesoderm lateral membrane lengths in control embryos during (D) apical constriction (n=9 embryos), (E) invagination (n=7 embryos) and (F) late VF formation (n=10 embryos). (J-L) Mesoderm lateral membrane lengths in scra RNAi embryos during (J) apical constriction (n=8 embryos), (K) invagination (n=8 embryos) and (L) late VF formation (n=6 embryos). (B′,C′,H′,I′) 2× magnifications of B,C,H,I, respectively. Data are represented as box and whisker plots, where the central mark is the median, the cross is the mean, and the box edges are the 25th and 75th percentiles. Although control and scra RNAi embryos appear qualitatively similar at the level of gross tissue morphology, lateral membrane lengths at each of the three stages of VF formation are significantly different between these two genotypes by the two-sample Kolmogorov Smirnov test (wild type versus scra RNAi, P<0.001); see the section ‘Statistical analysis of immunostaining results’ for further details. See also Figs S2-S6.
Fig. 2.
Fig. 2.
scra RNAi VFs remain folded, despite degradation of lateral membranes. (A-D) Low magnification transmission electron micrographs of embryo sections prepared using a combined high pressure freezing/freeze substitution method during invagination (A,B) or late VF formation (C,D) in control (A,C) and scra RNAi (B,D) embryos. Interstitial spaces are visible on the basal sides of VF cells (green arrowheads) in control embryos during both early (A) and late (C) VF formation. Basal interstitial spaces are absent (yellow brackets) and lateral membranes are starting to degrade into vesicles (red arrowheads) in early VF formation scra RNAi embryos (B). Basal interstitial spaces are still absent (yellow arrowheads) during late VF formation in scra RNAi embryos (D) and lateral interstitial spaces are no longer visible, replaced by an increased number of vesicles (red arrowheads). (A′-D′) Hand-drawn traces of A-D, respectively, highlighting intact interstitial spaces (green), nuclei (blue) and vesicles (red). Scale bar: 10 μm.
Fig. 3.
Fig. 3.
Simplified two-dimensional model of VF formation. (A) Two-dimensional model of VF formation. The initial state of the tissue is shown on the left. Middle panel shows a transient intermediate state of tissue during invagination; instantaneous fluid flow lines are also shown in red and blue. Right panel is the final state of the furrow (once maximal invagination depth has been reached, see Materials and Methods). (B-E) Final states of similar simulations in which specific material parameters or features have been altered. (B) Same parameters as in A, without the basal membranes. Cytoplasm can move between the cellular interiors and the yolk sack unobstructed. VF still forms successfully. (C) Same parameters as in A, except with the value of cytoplasmic/yolk viscosity reduced 100-fold. VF forms successfully. (D) Same parameters as in A, except without the basal membranes and with the value of the viscosity reduced 100-fold. The depth of VF invagination is markedly reduced. (E) Same parameters as in B, except that active stresses are ramped up 33-fold more slowly. The depth of VF invagination is markedly reduced. Changing cytoplasmic viscosity is (mathematically) equivalent to changing the time-scale of force ramping: changing either of those two quantities ultimately changes the ratio of the characteristic time of the mechanical tissue response and the time on which the active force attains its final value. We conclude that VF invagination requires cell volume conservation either due to the presence of the basal membranes (as in the control case) or due to the presence of sufficient viscous shear forces confining the cytoplasm to the cellular interior in the absence of the basal membranes (as in the scra RNAi background).
Fig. 4.
Fig. 4.
Three-dimensional model of VF formation based on in vivo measurements. (A) VF formation with basal membranes present (wild-type case). Left panel is starting configuration, middle panel is an intermediate time point and right panel is the final state of the furrow (once maximal invagination depth has been reached, see Materials and Methods). (B) Same as A, without the basal membranes. The VF forms successfully. Cells in the peripheral regions of the VF (arrows) are significantly shorter than the corresponding cells in A (quantified in Fig. S4). (C) Same as B, except that active stresses are ramped up threefold more slowly. Maximal invagination is reached approximately 3 min into force ramping (compared with ∼1 min in both A and B). (D) Simulations of tissue without basal membranes were run using a variety of ramping speeds. For each simulation, the maximal furrow depth (see red arrow in schematic on the right) is plotted as a function of the time taken to reach maximal VF invagination. Indicated points correspond to the simulations shown in B and C. Model parameters and simulation procedures are provided in the supplementary Materials and Methods.

References

    1. Alim, K., Andrew, N., Pringle, A. and Brenner, M. P. (2017). Mechanism of signal propagation in Physarum polycephalum. Proc. Natl. Acad. Sci. USA 114, 5136-5141. 10.1073/pnas.1618114114 - DOI - PMC - PubMed
    1. Barrett, K., Leptin, M. and Settleman, J. (1997). The Rho GTPase and a putative RhoGEF mediate a signaling pathway for the cell shape changes in Drosophila gastrulation. Cell 91, 905-915. 10.1016/S0092-8674(00)80482-1 - DOI - PubMed
    1. Bhuiyan, N. I. and Shafiq, S. A. (1959). The differentiation of the posterior pole-plasm in the housefly Musca vicina Macquart. Exp. Cell Res. 16, 427-429. 10.1016/0014-4827(59)90274-5 - DOI - PubMed
    1. Campos-Ortega, J. A. and Hartenstein, V. (1985). The Embryonic Development of Drosophila melanogaster. Berlin: Springer.
    1. Cheikh, M. I., Tchoufag, J., Osterfield, M., Dean, K., Bhaduri, S., Zhang, C., Mandadapu, K. K. and Doubrovinski, K. (2023). A comprehensive model of Drosophila epithelium reveals the role of embryo geometry and cell topology in mechanical responses. eLife 12, e85569. 10.7554/eLife.85569.sa2 - DOI - PMC - PubMed

LinkOut - more resources