. 2024 Oct 7;6(5):fcae356.
doi: 10.1093/braincomms/fcae356. eCollection 2024.

Individualized cortical gyrification in neonates with congenital heart disease

Affiliations

Individualized cortical gyrification in neonates with congenital heart disease

Daniel Cromb et al. Brain Commun. .

Abstract

Congenital heart disease is associated with impaired early brain development and adverse neurodevelopmental outcomes. This study investigated how individualized measures of preoperative cortical gyrification index differ in 142 infants with congenital heart disease, using a normative modelling approach with reference data from 320 typically developing infants. Gyrification index Z-scores for the whole brain and six major cortical areas were generated using two different normative models: one accounting for post-menstrual age at scan, post-natal age at scan and sex, and another additionally accounting for supratentorial brain volume. These Z-scores were compared between congenital heart disease and control groups to test the hypothesis that cortical folding in infants with congenital heart disease deviates from the normal developmental trajectory. The relationships between whole-brain gyrification index Z-scores from the two normative models and both cerebral oxygen delivery and neurodevelopmental outcomes were also investigated. Global and regional brain gyrification was significantly reduced in neonates with congenital heart disease, but not when supratentorial brain volume was accounted for. This finding suggests that whilst cortical folding is reduced in congenital heart disease, it is primarily driven by a reduction in brain size. There was a significant positive correlation between cerebral oxygen delivery and whole-brain gyrification index Z-scores in congenital heart disease, but not when supratentorial brain volume was accounted for. Cerebral oxygen delivery is therefore likely to play a more important role in the biological processes underlying volumetric brain growth than cortical folding. No significant associations between whole-brain gyrification index Z-scores and motor/cognitive outcomes or autism traits were identified in the 70 infants with congenital heart disease who underwent neurodevelopmental assessment at 22-months. Our results suggest that chronic in utero and early post-natal hypoxia in congenital heart disease is associated with reductions in cortical folding that are proportional to reductions in supratentorial brain volume.

Keywords: MRI; cerebral oxygen delivery; neurodevelopmental outcomes.


Conflict of interest statement

The authors report no competing interests.

Figures

Graphical Abstract
Graphical Abstract
Figure 1
Figure 1
Cortical surfaces. Examples of the left and right hemisphere pial surfaces (green) and outer smoothed surfaces (yellow) used for calculation of the GI, overlaid on T2-weighted brain MRIs for one subject, acquired at 39+3 weeks. The surface renderings of both the pial and outer smoothed surfaces are shown alongside.
Figure 2
Figure 2
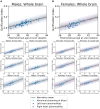
Cortical GI measurements—normative Model 1. Cortical GI measurements in 142 neonates with CHD overlaid on normative Model 1, accounting for PMA at scan, post-natal age at scan and sex. The normative mean derived from an independent population of 320 healthy control infants is shown as a black line. Shaded areas represent ±1, ± 2 and ±3 Sds from the normative model mean, separately for male (A) and female (B) infants. Individual data points for control neonates are not shown, for better visualisation.
Figure 3
Figure 3
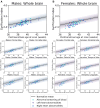
Cortical GI measurements—normative Model 2. Cortical GI measurements in 142 neonates with CHD overlaid on normative Model 2, accounting for PMA at scan, post-natal age at scan, sex and STBV. The normative mean derived from an independent population of 320 healthy control infants is shown as a black line. Shaded areas represent ±1, ± 2 and ±3 Sds from the normative model mean, separately for male (A) and female (B) infants. Individual data points for control neonates are not shown, for better visualisation.
Figure 4
Figure 4
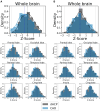
GI Z-score histograms. Histograms showing the distribution of GI Z-scores from normative Model 1 (A) and normative Model 2 (B) for the whole brain as well as the frontal, occipital, parietal, temporal, insular and cingulate cortices for both the healthy cohort (dHCP) (N = 320) and CHD infants (N = 142).
Figure 5
Figure 5
Whole brain GI Z-scores. Whole brain GI Z-scores for all healthy control infants (orange) and three categories of infants with CHD (abnormal streaming, N = 60, left-sided cardiac lesions, N = 43, right-sided cardiac lesions, N = 39), based on the haemodynamic impact of the underlying cardiac diagnosis. Two-tailed t-tests were used to show that mean whole-brain GI Z-scores derived from a normative model accounting for PMA, post-natal age at scan and sex are significantly reduced in all three groups when compared to control infants (N = 320) (A) (abnormal streaming = − 0.29 (t = 2.01, PFDR = 0.045); left-sided lesions = − 0.67 (t = 2.71, PFDR = 0.021); right-sided lesions = − 0.63 (t = 2.04, PFDR = 0.045)), but that there were no significant reductions in mean whole-brain GI Z-scores derived from a normative model accounting for PMA, post-natal age at scan, sex and STBV in any of the three cardiac groups when compared to control infants (N = 320) (B) (abnormal streaming = 0.23 (t = −1.54, PFDR = 0.37); left-sided lesions = − 0.14 (t = 0.80, PFDR = 0.63); right-sided lesions = 0.090 (t = − 0.43, PFDR = 0.67)). In both plots, solid lines represent the median value for each group; dashed lines represent the mean.
Figure 6
Figure 6
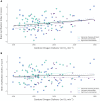
CDO2 and whole brain GI. CDO2 demonstrates a significant positive correlation with whole brain GI Z-scores derived from normative Model 1, which accounts for PMA, post-natal age at scan and sex (A) (partial Spearman’s rank correlation R2 = 0.05, P = 0.015), but not from normative Model 2, which also accounts for STBV (B) (partial Spearman’s rank correlation R2 = 0.002, P = 0.66) in 120 neonates with CHD, after accounting for PMA at scan, post-natal age at scan and neonatal sex.

References

    1. Goldman-Rakic PS. Development of cortical circuitry and cognitive function. Child Dev. 1987;58:601–622. - PubMed
    1. Molnár Z, Clowry GJ, Šestan N, et al. New insights into the development of the human cerebral cortex. J Anat. 2019;235:432–451. - PMC - PubMed
    1. Bethlehem RAI, Seidlitz J, White SR, et al. Brain charts for the human lifespan. Nature. 2022;604:525–533. - PMC - PubMed
    1. Stiles J, Jernigan TL. The basics of brain development. Neuropsychol Rev. 2010;20:327–348. - PMC - PubMed
    1. Sun T, Hevner RF. Growth and folding of the mammalian cerebral cortex: From molecules to malformations. Nat Rev Neurosci. 2014;15:217–232. - PMC - PubMed

LinkOut - more resources