. 2024 Oct 1;14(10):7151-7175.
doi: 10.21037/qims-24-821. Epub 2024 Sep 26.

A method framework of semi-automatic knee bone segmentation and reconstruction from computed tomography (CT) images

Affiliations

A method framework of semi-automatic knee bone segmentation and reconstruction from computed tomography (CT) images

Ahsan Humayun et al. Quant Imaging Med Surg. .

Abstract

Background: Accurate delineation of knee bone boundaries is crucial for computer-aided diagnosis (CAD) and effective treatment planning in knee diseases. Current methods often struggle with precise segmentation due to the knee joint's complexity, which includes intricate bone structures and overlapping soft tissues. These challenges are further complicated by variations in patient anatomy and image quality, highlighting the need for improved techniques. This paper presents a novel semi-automatic segmentation method for extracting knee bones from sequential computed tomography (CT) images.

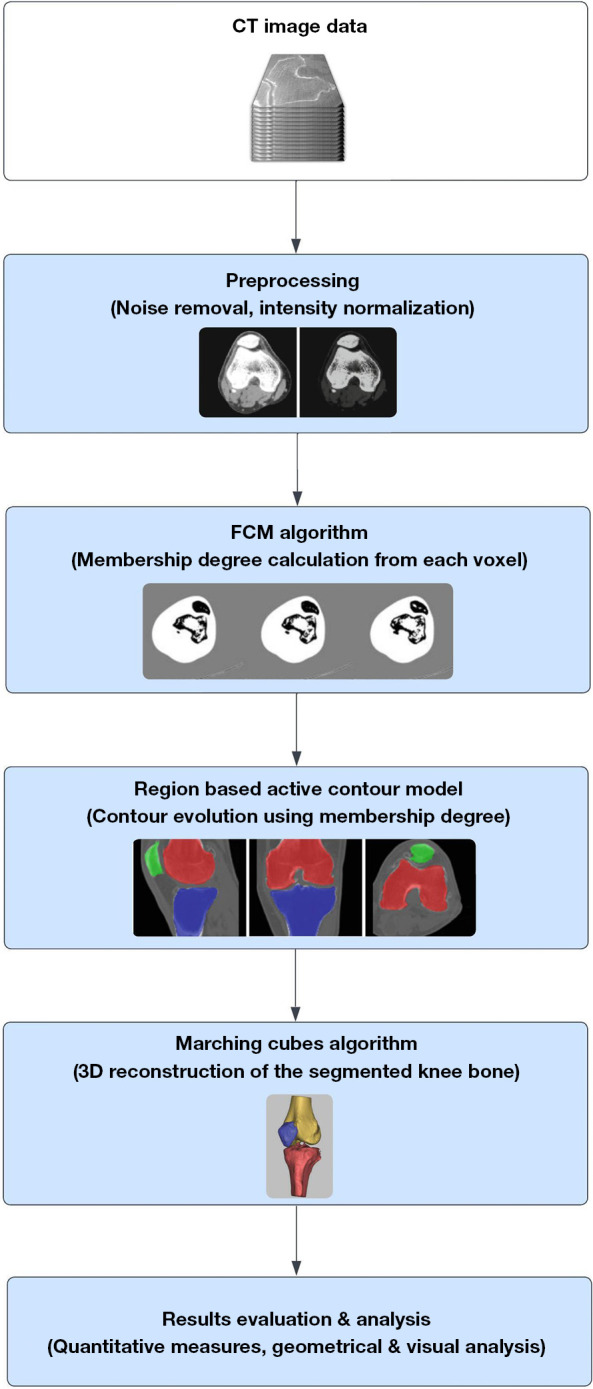
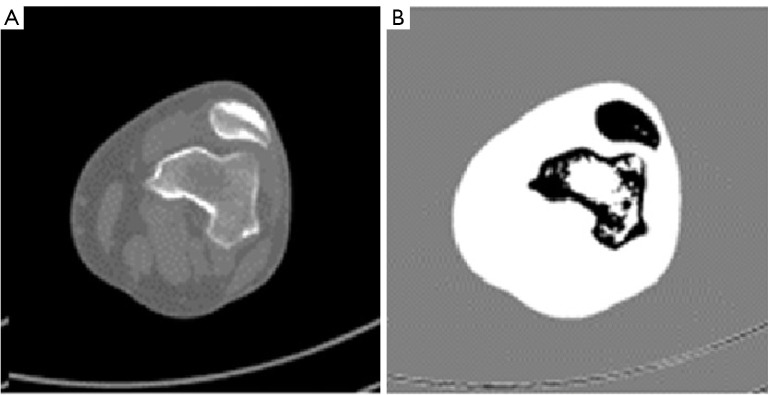
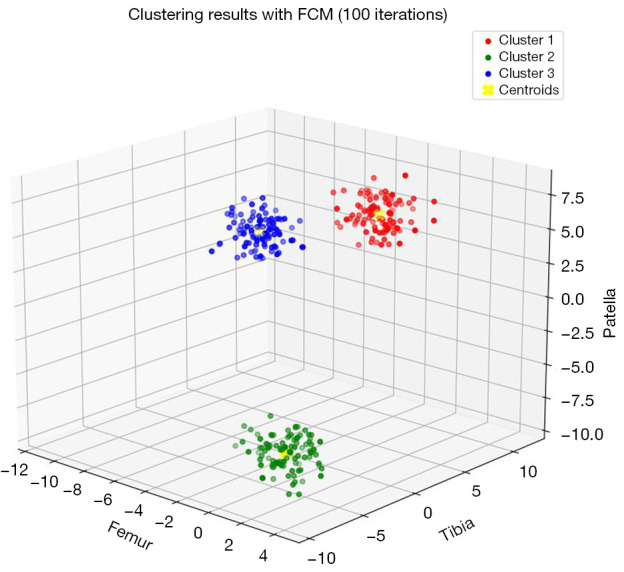
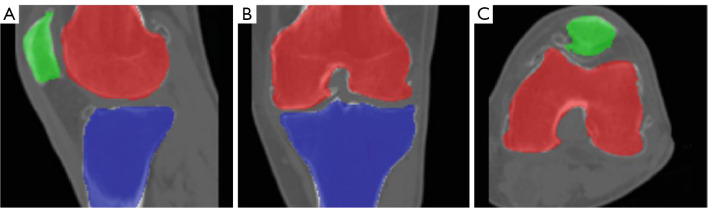
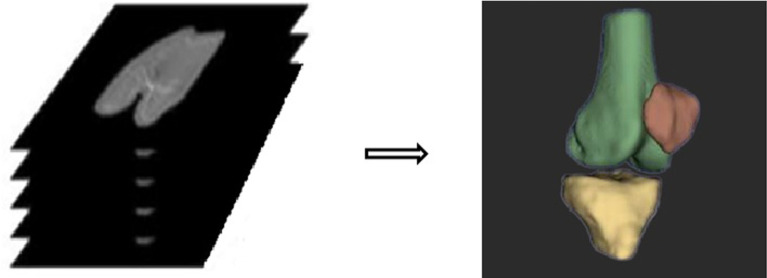
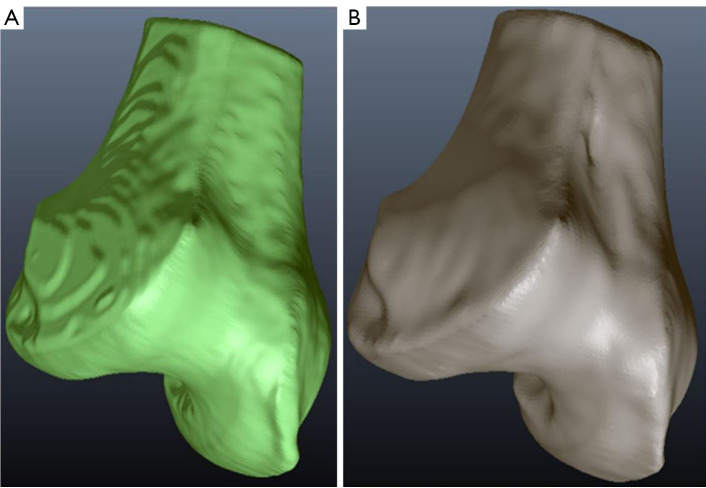
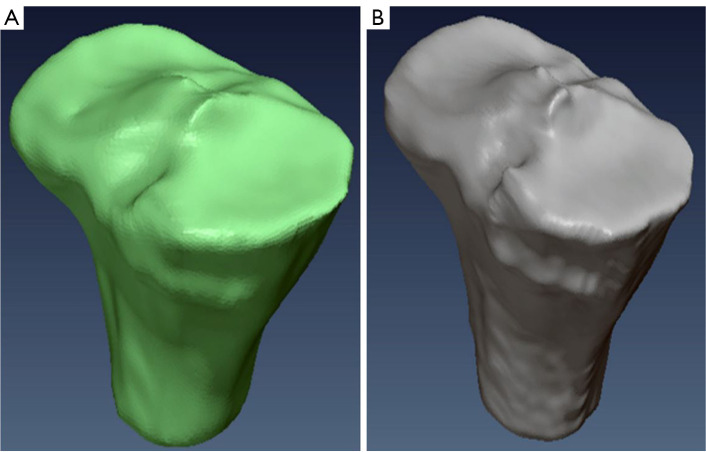
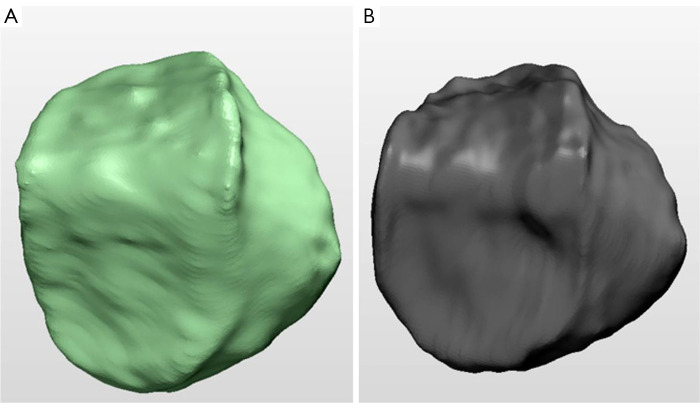
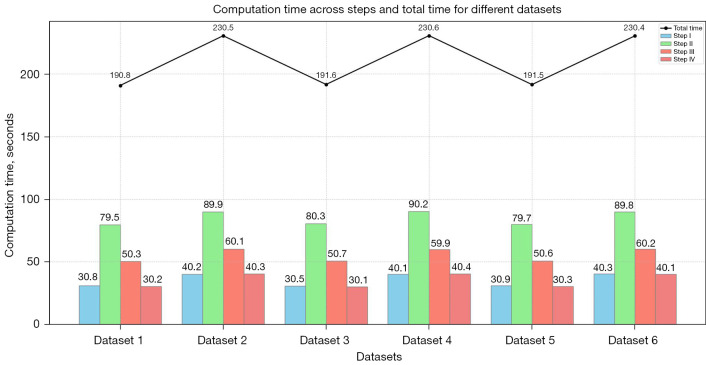
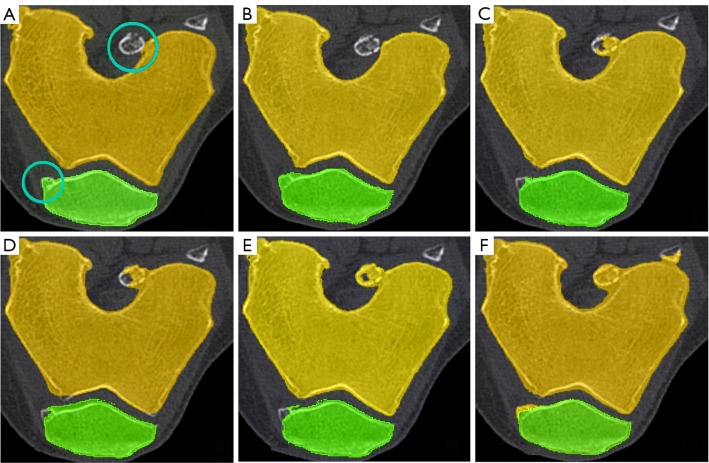
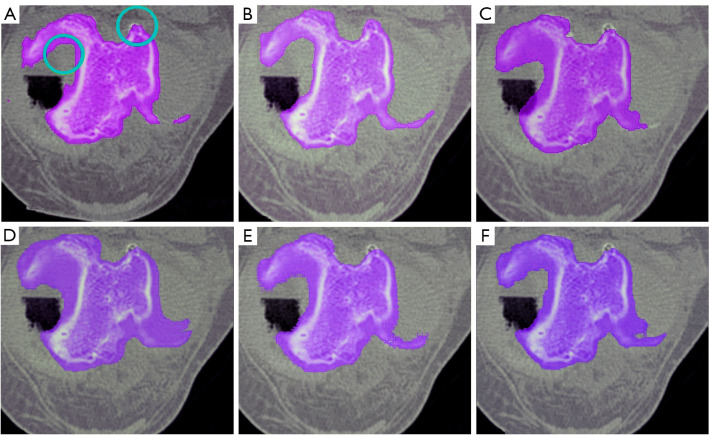
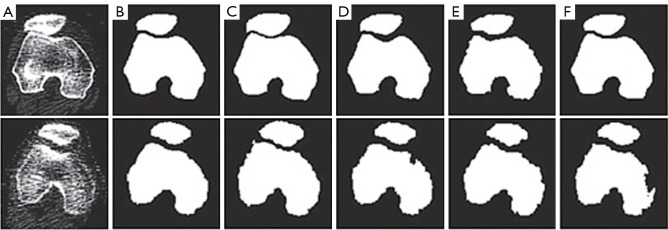
Methods: Our approach integrates the fuzzy C-means (FCM) algorithm with an adaptive region-based active contour model (ACM). Initially, the FCM algorithm assigns membership degrees to each voxel, distinguishing bone regions from surrounding soft tissues based on their likelihood of belonging to specific bone regions. Subsequently, the adaptive region-based ACM utilizes these membership degrees to guide the contour evolution and refine segmentation boundaries. To ensure clinical applicability, we further enhance our method using the marching cubes algorithm to reconstruct a three-dimensional (3D) model. We evaluated the method on six randomly selected knee joints.

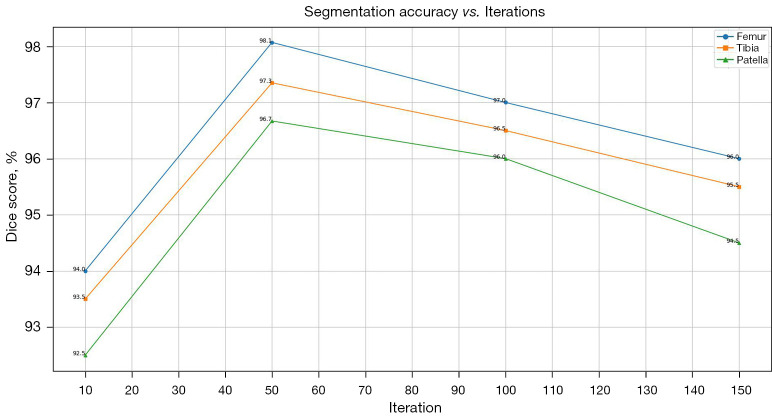
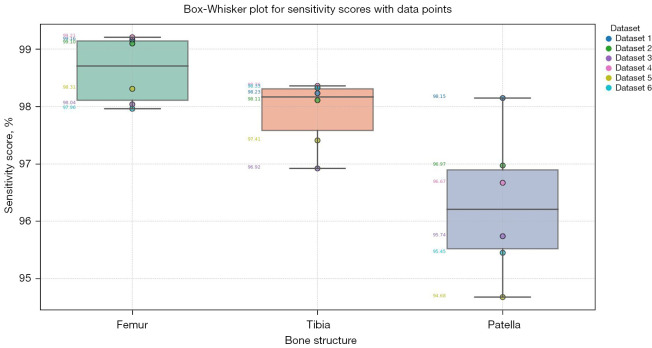
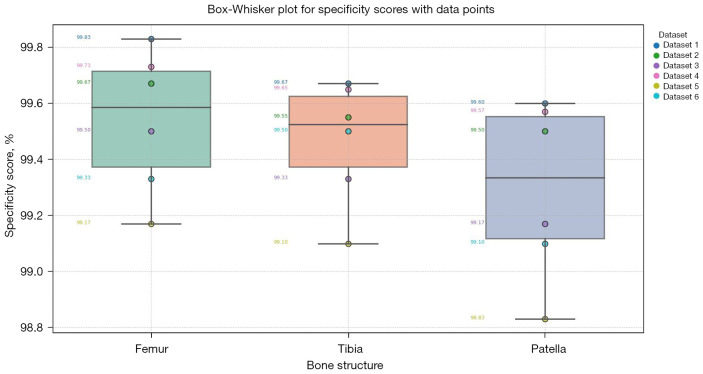
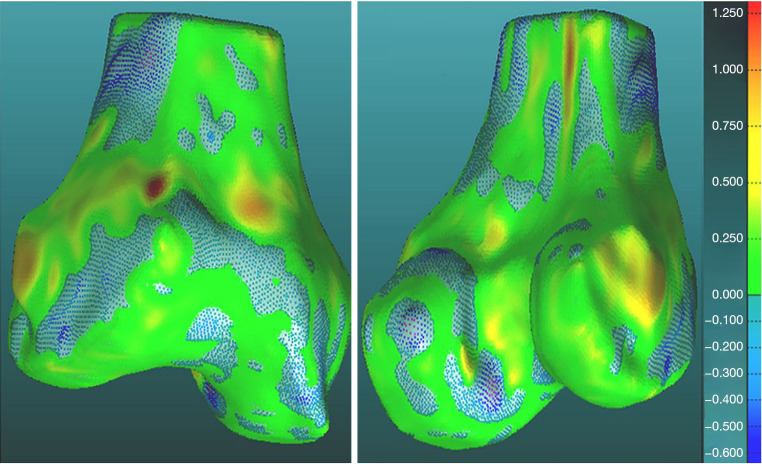
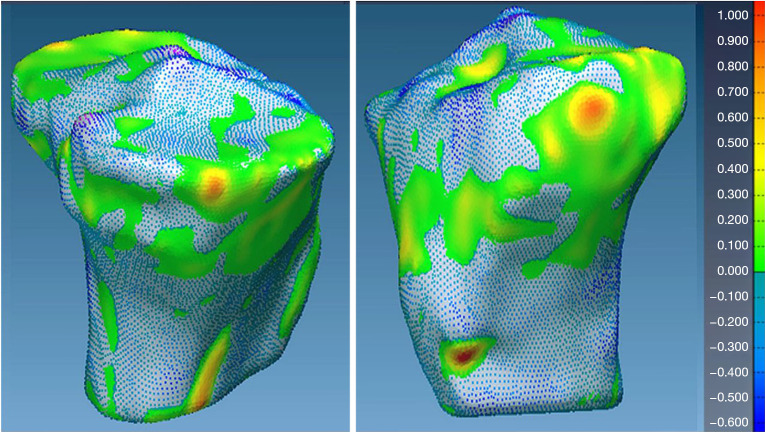
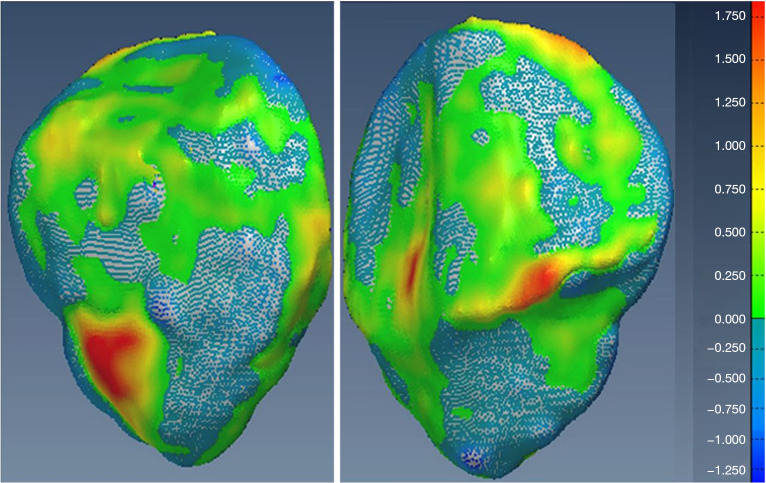
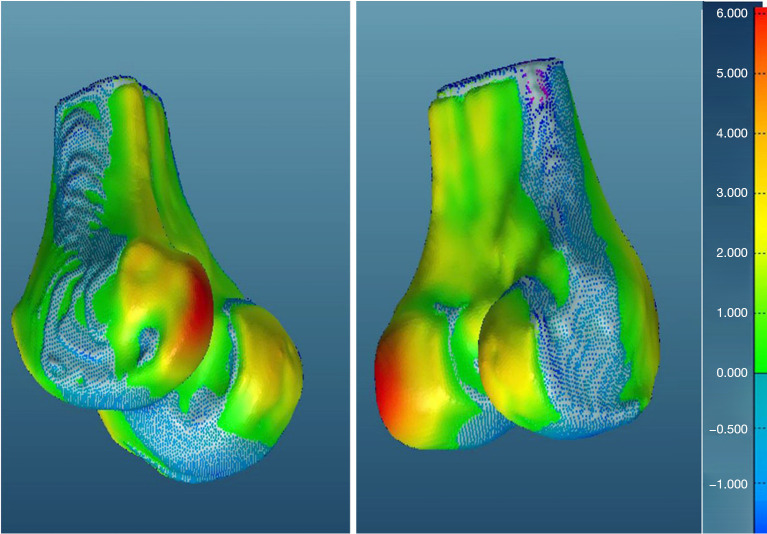
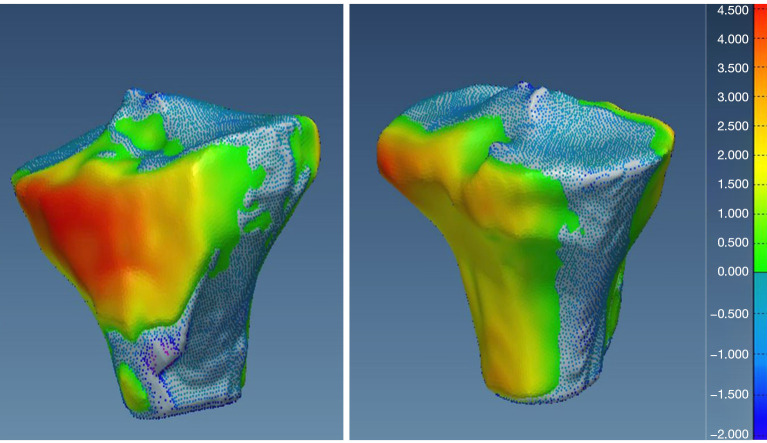
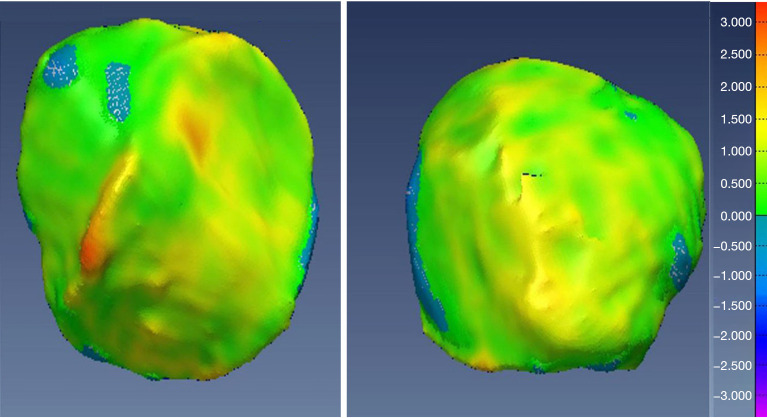
Results: We evaluated the method using quantitative metrics such as the Dice coefficient, sensitivity, specificity, and geometrical assessment. Our method achieved high Dice scores for the femur (98.95%), tibia (98.10%), and patella (97.14%), demonstrating superior accuracy. Remarkably low root mean square distance (RSD) values were obtained for the tibia and femur (0.5±0.14 mm) and patella (0.6±0.13 mm), indicating precise segmentation.

Conclusions: The proposed method offers significant advancements in CAD systems for knee pathologies. Our approach demonstrates superior performance in achieving precise and accurate segmentation of knee bones, providing valuable insights for anatomical analysis, surgical planning, and patient-specific prostheses.

Keywords: Knee bone segmentation; adaptive region based active contour model (adaptive region based ACM); fuzzy-C means (FCM); marching cubes algorithm; three-dimensional reconstruction (3D reconstruction).


Conflict of interest statement

Conflicts of Interest: All authors have completed the ICMJE uniform disclosure form (available at https://qims.amegroups.com/article/view/10.21037/qims-24-821/coif). The authors have no conflicts of interest to declare.

Figures

Figure 1
Figure 1
Flowchart of the proposed methodology. CT, computed tomography; FCM, fuzzy C-means.
Figure 2
Figure 2
CT images showing complexities such as regions of soft tissues, noises, and intensity inhomogeneity across different slices. The green marked boxes identify areas corresponding to soft tissues and noises, while the blue boxes highlight regions of intensity inhomogeneity. CT, computed tomography.
Figure 3
Figure 3
Cropping of knee CT image to eliminate extraneous background details and extract relevant bone structures. CT, computed tomography.
Figure 4
Figure 4
Outer contour extraction of the knee CT image. (A) Knee CT image showing the original data. (B) Outer contour extraction using Canny edge detection with a σ value of 1.4). CT, computed tomography.
Figure 5
Figure 5
Image processing using FCM. (A) Original DICOM image. (B) Membership degree values produced by FCM, highlighting distinct regions of interest. FCM, fuzzy C-means; DICOM, Digital Imaging and Communications in Medicine.
Figure 6
Figure 6
Convergence of the FCM objective function for different iteration limits. FCM, fuzzy C-means.
Figure 7
Figure 7
3D scatter plot illustrating clustering results obtained using FCM with 100 iterations. 3D, three-dimensional; FCM, fuzzy C-means.
Figure 8
Figure 8
Convergence of the region-based active contour model energy function over different iteration limits.
Figure 9
Figure 9
Segmentation accuracy as measured by the Dice score for femur, tibia, and patella over different iteration counts.
Figure 10
Figure 10
Segmentation results using an adaptive region-based active contour model. The femur, tibia, and patella are color-coded in red, blue, and green, respectively. The results are displayed across different views: (A) sagittal, (B) coronal, and (C) axial.
Figure 11
Figure 11
3D reconstruction of knee joint model. 3D, three-dimensional.
Figure 12
Figure 12
Comparative analysis of femur bone segmentation. (A) Automated segmentation using FCM and region-based ACM; (B) manual segmentation. FCM, fuzzy C-means; ACM, active contour model.
Figure 13
Figure 13
Comparative analysis of tibia bone segmentation. (A) Automated segmentation using FCM and region-based ACM; (B) manual segmentation. FCM, fuzzy C-means; ACM, active contour model.
Figure 14
Figure 14
Comparative analysis of tibia bone segmentation. (A) Automated segmentation using FCM and region-based ACM; (B) manual segmentation. FCM, fuzzy C-means; ACM, active contour model.
Figure 15
Figure 15
Box-whisker plot illustrating sensitivity scores for segmented knee bone regions. The plot visualizes the distribution of sensitivity scores for femur, tibia, and patella.
Figure 16
Figure 16
Box-whisker plots illustrating the specificity scores for segmented knee bone regions. The plot visualizes the distribution of specificity scores for femur, tibia, and patella.
Figure 17
Figure 17
Geometric validation of femur bone 3D mesh using color-coded map for Case 1. 3D, three-dimensional.
Figure 18
Figure 18
Geometric validation of tibia bone 3D mesh using color coded map for Case 1. 3D, three-dimensional.
Figure 19
Figure 19
Geometric validation of patella bone 3D mesh using color coded map for Case 1. 3D, three-dimensional.
Figure 20
Figure 20
Geometric validation of femur bone 3D mesh using color coded map for Case 2. 3D, three-dimensional.
Figure 21
Figure 21
Geometric validation of tibia bone 3D mesh using color coded map for Case 2. 3D, three-dimensional.
Figure 22
Figure 22
Geometric validation of patella bone 3D mesh using color coded map for Case 2. 3D, three-dimensional.
Figure 23
Figure 23
Execution time (seconds) for each step of our framework, highlighting the method’s computational efficiency across different image series.
Figure 24
Figure 24
Comparison of segmentation results for femur and patella bones in CT images with missing regions. (A) Manually segmented, (B) proposed method, (C) CPSM, (D) atlas-based, (E) ASM, and (F) deformable model. CT, computed tomography; CPSM, coupled prior shape model; ASM, active shape model.
Figure 25
Figure 25
Comparison of segmentation results for tibial bone in CT images with missing regions. (A) Manually segmented, (B) proposed method, (C) CPSM, (D) atlas-based, (E) ASM, and (F) deformable model. CT, computed tomography; CPSM, coupled prior shape model; ASM, active shape model.
Figure 26
Figure 26
Comparison of segmentation results for two cases using the proposed method and other methods. (A) Manually segmented, (B) proposed method, (C) CPSM, (D) atlas-based, (E) ASM, and (F) deformable model. CT, computed tomography; CPSM, coupled prior shape model; ASM, active shape model.

Similar articles

References

    1. Kishore VV, Dosapati UB, Deekshith E, Boyapati K, Pranay S, Kalpana V. CAD Tool for Prediction of Knee Osteoarthritis (KOA). 2024 10th International Conference on Communication and Signal Processing (ICCSP), Melmaruvathur, India, 2024:18-23.
    1. Starmans MP, van der Voort SR, Tovar JMC, Veenland JF, Klein S, Niessen WJ. Radiomics: data mining using quantitative medical image features. Handbook of medical image computing and computer assisted intervention. Academic Press, 2020:429-56.
    1. Chen H, Sprengers AMJ, Kang Y, Verdonschot N. Automated segmentation of trabecular and cortical bone from proton density weighted MRI of the knee. Med Biol Eng Comput 2019;57:1015-27. 10.1007/s11517-018-1936-7 - DOI - PMC - PubMed
    1. Walker PS. The Artificial Knee: An Ongoing Evolution. Springer, 2020.
    1. Poliakov A, Pakhaliuk V, Popov VL. Current trends in improving of artificial joints design and technologies for their arthroplasty. Front Mech Eng 2020;6:4.

LinkOut - more resources