. 2024 Sep 14;3(5):e241.
doi: 10.1002/imt2.241. eCollection 2024 Oct.

Interaction between intestinal mycobiota and microbiota shapes lung inflammation

Affiliations

Interaction between intestinal mycobiota and microbiota shapes lung inflammation

Youxia Wang et al. Imeta. .

Abstract

Gut microbiota is an intricate microbial community containing bacteria, fungi, viruses, archaea, and protozoa, and each of them contributes to diverse aspects of host health. Nevertheless, the influence of interaction among gut microbiota on host health remains uncovered. Here, we showed that the interaction between intestinal fungi and bacteria shaped lung inflammation during infection. Specifically, antifungal drug-induced dysbiosis of gut mycobiota enhanced lung inflammation during infection. Dysbiosis of gut mycobiota led to gut Escherichia coli (E. coli) overgrowth and translocation to the lung during infection, which induced lung accumulation of the CD45+F4/80+Ly6G-Ly6C-CD11b+CD11c+ macrophages. Clearance of macrophages or deletion of TLR4 (Toll-like receptor 4, recognition of LPS) rather than Dectin-1 (recognition of beta-1,3/1,6 glucans on fungi) blocked the antifungal drug-induced aggravation of lung inflammation during infection. These findings suggest that the interaction between intestinal mycobiota and commensal bacteria affects host health through the gut-lung axis, offering a potential therapeutic target for ameliorating lung inflammation during infection.

Keywords: intestinal microbiota; intestinal mycrobiota; lung inflammation; macrophages.


Conflict of interest statement

The authors declare no conflict of interest.

Figures

Figure 1
Figure 1
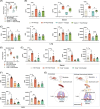
Antifungal drugs aggravate lung inflammation during infection. (A) Experimental design for fluconazole (FCZ) treatment, amphotericin‐B (AmB) treatment, and Pasteurella multocida type‐A (PmCQ2) infection. (B) Alpha‐diversity of intestinal mycobiota of mice. ACE, abundance‐based coverage estimator (n = 5 and 6). (C) Quantification of absolute abundance of the fungal populations (n = 6). (D) The survival rate of mice analyzed by Log‐rank test (n = 15). (E) Bacterial loads of mouse lung shown as mean ± SEM (n = 6). (F) The inflammation in the lung analyzed with hematoxylin–eosin (HE) staining (scale bars, 50 μm). (G–J) The levels of interleukin‐1β (IL‐1β), interferon‐γ (IFN‐γ), tumor necrosis factor‐α (TNF‐α), IL‐6, IL‐12, and IL‐17 in the serum and lung of mice (n = 8). The data of lung IL‐17 were analyzed by Mann–Whitney U test and shown as median with interquartile range (M(IQR)). (K) The survival rate of mice analyzed by Log‐rank test (n = 10). (L) Bacterial loads of mouse lung shown as mean ± SEM (n = 8). (M, N) The levels of IL‐1β, IFN‐γ, TNF‐α, and IL‐6 in the serum and lung of mice (n = 7 and 8). The data about serum IFN‐γ and IL‐6, and lung IL‐1β, TNF‐α as well as IL‐6 were analyzed by Mann–Whitney U test and shown as M(IQR). Data were analyzed by unpaired t‐test and represented as mean ± SD unless indicated. *p < 0.05, **p < 0.01, ***p < 0.001, and ****p < 0.0001.
Figure 2
Figure 2
Intestinal mycobiota inoculation relieves lung inflammation during infection. (A) Experimental design for fluconazole treatment, intestinal mycobiota inoculation, and Pasteurella multocida type‐A (PmCQ2) infection in mice. (B) The survival rate of mice (n = 10). (C) Bacterial loads of mouse lung shown as mean ± SEM (n = 8). (D) The levels of interleukin‐1β (IL‐1β), interferon‐γ (IFN‐γ), tumor necrosis factor‐α (TNF‐α), IL‐6, IL‐12, and IL‐17 in the serum and lung (n = 8). Data were analyzed by Log‐rank test (B) and one‐way analysis of variance (ANOVA) (C, D) and represented as mean ± SD unless indicated. *p < 0.05, **p < 0.01, ***p < 0.001, and ****p < 0.0001.
Figure 3
Figure 3
Dysbiosis of intestinal mycobiota promotes the expansion of Escherichia coli. (A) PCoA analysis of fungal communities in Control (Ctrl), fluconazole (FCZ), Ctrl.PmCQ2 and FCZ.PmCQ2 group (n = 5–10). (B) PCoA analysis of bacterial communities in Ctrl, FCZ, Ctrl.PmCQ2 and FCZ.PmCQ2 group (n = 8). (C) The relative abundance of E. coli in Ctrl, FCZ, Ctrl.PmCQ2, and FCZ.PmCQ2 group (n = 8). (D) Absolute abundance of the fungal population in Ctrl, FCZ, Ctrl.PmCQ2, and FCZ.PmCQ2 group (n = 6). (E) Experimental design for fecal metabolites from fluconazole treatment (or not) mice coculturing with E. coli. (F) Fecal metabolites from fluconazole treatment mice promote the growth of E. coli (n = 8). (G) Experimental design for metabolites from Candida albicans coculturing with E. coli. (H) Metabolites from C. albicans inhibit the growth of E. coli (n = 8). (I) Intestinal permeability assay of fluconazole treatment mice (n = 8). (J) Quantitative PCR for E. coli copies in blood and lung of Ctrl.PmCQ2 and FCZ.PmCQ2 group with data shown as mean ± SEM (n = 7 and 8). (K) The levels of lipopolysaccharide (LPS) in the serum and lung were analyzed by Mann–Whitney U test and shown as M(IQR) (n = 8). (L) The green‐fluorescent protein (GFP) labeled E. coli in blood (n = 6). (M) The GFP‐labeled E. coli in the lung (Scale bars, 50 μm). Data were analyzed by unpaired t test and represented as mean ± SD unless indicated. *p < 0.05, **p < 0.01, ***p < 0.001, and ****p < 0.0001.
Figure 4
Figure 4
Dysbiosis of intestinal mycobiota induces accumulation of CD11b+CD11c+ macrophages. (A, B) Flow cytometry analysis of interstitial macrophages (IM, CD11b+CD11c), alveolar macrophages (AM, CD11bCD11c+), and activated macrophages (AcM, CD11b+CD11c+) in the lung. Interstitial macrophages, alveolar macrophages, and activated macrophages were pregated by CD45+F4/80+Ly6GLy6C (n = 5 and 6). (C, D) Flow cytometry analysis of NK (NK1.1+CD3), NKT (NK1.1+CD3+), and CD11b+NK (CD11b+) cells in the lung. NK and NKT cells were pregated by CD45+F4/80; CD11b+NK cells were pregated by CD45+F4/80NK1.1+CD3 (n = 4 and 6). (E, F) Flow cytometry analysis of ILC2 (GATA3+CD25+) cells in the lung. ILC2 cells were pregated by CD45+CD127+Lin (n = 6). (G) Immunofluorescence analysis of CD11b+CD11c+F4/80+ cells and NK1.1+CD3+ cells in the lung (n = 3, Scale bar, 20 μm). The number of CD11b+CD11c+F4/80+ cells was analyzed by Mann–Whitney U test and data shown as M(IQR). The data of NK1.1+CD3+ cells number was shown as mean ± SEM. Data were analyzed by unpaired t test and represented as mean ± SD unless indicated. *p < 0.05, **p < 0.01, and ****p < 0.0001.
Figure 5
Figure 5
Escherichia coli promotes macrophage pro‐inflammatory responses. (A) Experimental design for peritoneal exudate macrophages (PEMs) polarized with lipopolysaccharide (LPS)/interferon‐γ (IFN‐γ) and cocultured with mice feces (with or without fluconazole treatment) in vitro. (B) The secretion of interleukin‐1β (IL‐1β) and tumor necrosis factor‐α (TNF‐α) from PEMs, cocultured with fecal suspension and treated with LPS/IFN‐γ (n = 6). (C) The secretion of IL‐1β and TNF‐α from PEMs, which cocultured with fecal metabolites and treated with LPS/IFN‐γ. The data of IL‐1β and TNF‐α were shown as M(IQR) while the data of IL‐1β was analyzed by Mann–Whitney U test (n = 6). (D) Confocal microscopy analysis of PEMs, cocultured with fecal suspension and treated with LPS/IFN‐γ, by immunostaining for NLRP3 (green), ASC (red), and Caspase‐1 (green) (n = 3; Scale bars, 2 μm). Data were shown as M(IQR). The mean fluorescence intensity (A.U.) of NLRP3 and ASC were analyzed by Mann–Whitney U test. (E) Protein abundance of NLRP3, ASC, Caspase‐1, p65, p‐p65, and IL‐1β in PEMs, cocultured with fecal suspension and treated with LPS/IFN‐γ (n = 4). (F) IL‐1β and TNF‐α secretion from PEMs, cocultured with fecal suspension and treated with LPS/IFN‐γ and MCC950 (20 μM) (n = 6). (G) PCA analysis of PEMs, cocultured with fecal suspension and treated with LPS/IFN‐γ (n = 4). (H, J) The KEGG analysis of differently expressed genes from G associating with the immune system (H), signal transduction (I), and metabolism pathway (J), Fold Change > 1; Padj < 0.05. (K) The IL‐1β and TNF‐α secretion from PEMs, which cocultured with E. coli (n = 5 and 6). Data were analyzed by unpaired t test and represented as mean ± SD unless indicated. *p < 0.05, **p < 0.01, ***p < 0.001, and ****p < 0.0001.
Figure 6
Figure 6
TRL4 deficiency attenuates lung inflammation. (A) Bacterial burdens of mouse lung with data shown as mean ± SEM (n = 8). (B) The levels of interferon‐γ (IFN‐γ), interleukin‐1β (IL‐1β), and tumor necrosis factor‐α (TNF‐α) in the serum. The data of TNF‐α and IL‐1β were analyzed by Mann–Whitney U test and shown as M(IQR) (n = 5 and 6). (C) The levels of IFN‐γ, IL‐1β, IL‐6, and TNF‐α in the lung (n = 8). (D) Bacterial burdens of mouse lung with data shown as mean ± SEM (n = 7 and 8). (E, F) The levels of IFN‐γ, IL‐1β, TNF‐α, and IL‐6 in the serum and lung (n = 7 and 8). (G) Antifungal drug‐induced dysbiosis of intestinal mycobiota induces intestinal Escherichia coli over‐expansion and migration into the blood and lung, where activates the CD45+F4/80+Ly6GLy6CCD11b+CD11c+ macrophages, resulting in aggravation of lung inflammation during infection, created with BioRender.com. Data were analyzed by unpaired t test and represented as mean ± SD unless indicated. *p < 0.05, **p < 0.01, and ***p < 0.001.

References

    1. Eckburg, Paul B. , Bik Elisabeth M., Bernstein Charles N., Purdom Elizabeth, Dethlefsen Les, Sargent Michael, Gill Steven R., Nelson Karen E., and Relman David A.. 2005. “Diversity of the Human Intestinal Microbial Flora.” Science 308: 1635–1638. 10.1126/science.1110591 - DOI - PMC - PubMed
    1. Ansaldo, Eduard , Farley Taylor K., and Belkaid Yasmine. 2021. “Control of Immunity by the Microbiota.” Annual Review of Immunology 39: 449–479. 10.1146/annurev-immunol-093019-112348 - DOI - PubMed
    1. Blander, J. Magarian , Longman Randy S., Iliev Iliyan D., Sonnenberg Gregory F., and Artis David. 2017. “Regulation of Inflammation by Microbiota Interactions with the Host.” Nature Immunology 18: 851–860. 10.1038/ni.3780 - DOI - PMC - PubMed
    1. Fan, Lijuan , Xia Yaoyao, Wang Youxia, Han Dandan, Liu Yanli, Li Jiahuan, Fu Jie, et al. 2023. “Gut Microbiota Bridges Dietary Nutrients and Host Immunity.” Science China Life Sciences 66: 2466–2514. 10.1007/s11427-023-2346-1 - DOI - PMC - PubMed
    1. Tang, Jia , Xu Lingqi, Zeng Yiwen, and Gong Fang. 2021. “Effect of Gut Microbiota on LPS‐induced Acute Lung Injury by Regulating the TLR4/NF‐kB Signaling Pathway.” International Immunopharmacology 91: 107272. 10.1016/j.intimp.2020.107272 - DOI - PubMed

LinkOut - more resources