. 2024 Oct 18:18:11779322241280431.
doi: 10.1177/11779322241280431. eCollection 2024.

detectCilia: An R Package for Automated Detection and Length Measurement of Primary Cilia

Affiliations

detectCilia: An R Package for Automated Detection and Length Measurement of Primary Cilia

Kai Budde-Sagert et al. Bioinform Biol Insights. .

Abstract

Background and objective: The primary cilium is a small protrusion found on most mammalian cells. It acts as a cellular antenna, being involved in various cell signaling pathways. The length of the primary cilium affects its function. To study the impact of physical or chemical stimuli on cilia, their lengths must be determined easily and reproducibly.

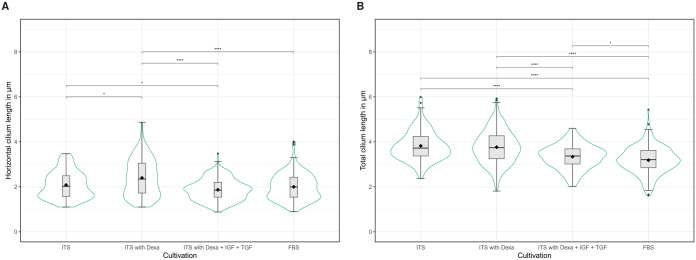
Methods: We have developed and evaluated an open-source R package called detectCilia to detect and measure primary cilia automatically. As a case study to demonstrate the capability of our tool, we compared the influence of 4 different cell culture media compositions on the lengths of primary cilia in human chondrocytes. These media compositions include (1) insulin-transferrin-selenium (ITS); (2) ITS and dexamethasone (Dexa); (3) ITS, Dexa, insulin-like growth factor 1 (IGF-1), and transforming growth factor beta 1 (TGF-β1); and (4) fetal bovine serum (FBS).

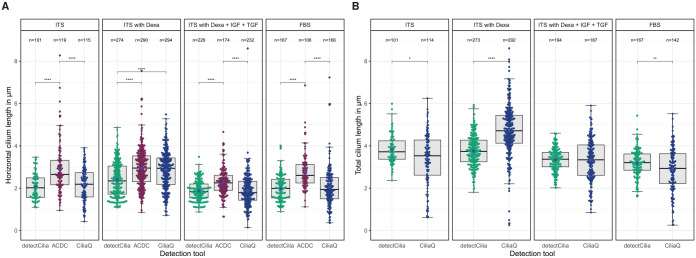
Results: The assessment of detectCilia included a comparison with 2 similar tools: ACDC (Automated Cilia Detection in Cells) and CiliaQ. Several differences and advantages of our package make it a valuable addition to these tools. In the case study, we have observed variations in the ciliary lengths associated with using different media compositions.

Conclusions: We conclude that detectCilia can automatically and reproducibly detect and measure primary cilia in confocal microscopy images with low false-positive rates without requiring extensive user interaction.

Keywords: Primary cilium; R package; automated image analysis; confocal microscopy; reproducibility.


Conflict of interest statement

The author(s) declared no potential conflicts of interest with respect to the research, authorship, and/or publication of this article.

Figures

Figure 1.
Figure 1.
Default workflow of detectCilia. 1. Image preparation: The original microscopy files are imported, and, if applicable, a maximum intensity z-stack projection is calculated. 2. Nuclei detection: The stained nuclei are segmented and counted using the mean area of a nucleus as an input parameter. 3. Cilia detection: Cilia are detected in the z-stack projection and every z-stack layer using the ratio of possible cilia pixels. Here, a primary cilium’s (expected) area is needed as an input parameter. 4. Cilia measurement: The information on all cilia (eg, lengths and heights) is collected, and the total lengths are calculated. The results are saved in a CSV file. (The images shown are sections of 190815_EV38_2_Collagen_ITSwithAsc+Dexa_63x_zstack_3.czi with enhanced brightness and contrast for better visualization.)
Figure 2.
Figure 2.
Determination of the ciliary length. Our R package detectCilia uses the maximum extension of the z-stack projection for calculating the horizontal length. The vertical length is calculated by counting the number of z-stack layers where parts of a cilium can be seen. This number is multiplied by the spacing of the layers. The total length is calculated using Pythagoras’ theorem.
Figure 3.
Figure 3.
Simulated cilia with a length of 10 pixels and a width and height of 3 pixels with added Gaussian blur were measured by all 3 tools. (A) and (B) show the results of the horizontal length measurements. In (A), the cilia with added Gaussian blur were detected and measured individually (1 cilium per image). In (B), the images with the blurred cilia were combined; therefore, one image containing all cilia (except for the cilium with an added blur of σ = 5 pixels) was used for detection and measurement. (The cilium number divided by 10 corresponds to the Gaussian blur standard deviation in pixels used for that particular cilium.) The results of CiliaQ are identical for both approaches. (C) Images of the z-stack projection of the simulated cilium with Gaussian blur standard deviation values 0, 1, 2, 3, 4, and 5 pixels (from left to right).
Figure 4.
Figure 4.
Results of automatic and manual detection and measurement of cilia in the 7 test images from the ITS with Dexa group. (A) Horizontal length (in pixels) measured in z-stack projection by all 3 tools and 3 raters. (The size of one pixel in x -direction and y -direction is 0.2196 µm). (B) Vertical length (in z-stack layers) determined by the distance from the lowest to the highest z-stack layer containing pixels belonging to a specific cilium. (The z-step interval is 0.2814 µm.) (C) Total length (in µm) of every cilium in every image. Note that CiliaQ used the z-stack projection images for horizontal length measurements and the original CZI files for the total lengths, resulting in slightly different numbers of detected cilia. All box-and-whisker plots are shown with median, first and third quartiles, outliers, as well as the mean values (black diamonds). cq indicates CiliaQ; dc, detectCilia; m1 to m3, 3 independent manual raters.
Figure 5.
Figure 5.
Length of primary cilia measured by detectCilia depending on the media compositions. (A) Horizontal lengths from z-stack projections, (B) total lengths. Box-and-whisker plots, mean values (black diamonds), and violin plots are shown. Dexa indicates dexamethasone; FBS, fetal bovine serum; IGF, insulin-like growth factor; ITS, insulin-transferrin-selenium; TGF; transforming growth factor. Significance levels: P<104,P<103,P<102,P<.05 .
Figure 6.
Figure 6.
Number of detected primary cilia and (A) horizontal lengths as measured by detectCilia, ACDC, and CiliaQ as well as (B) total lengths as measured by detectCilia and CiliaQ depending on the media compositions. Note that cilia detected by detectCilia touching a z border were removed here. Box-and-whisker plots, mean values (blue diamonds), and individual cilia lengths are shown. Dexa indicates dexamethasone; FBS, fetal bovine serum; IGF, insulin-like growth factor; ITS, insulin-transferrin-selenium; TGF, transforming growth factor. Significance levels: :p<104,:p<103,:p<102,:p<0.05 .

References

    1. Satir P, Christensen ST. Overview of structure and function of mammalian cilia. Annu Rev Physiol. 2007;69:377-400. doi:10.1146/annurev.physiol.69.040705.141236 - DOI - PubMed
    1. Satir P, Pedersen LB, Christensen ST. The primary cilium at a glance. J Cell Sci. 2010;123:499-503. doi:10.1242/jcs.050377 - DOI - PMC - PubMed
    1. Bloodgood RA. Chapter 1—from central to rudimentary to primary: the history of an underappreciated organelle whose time has come. The primary cilium. In: Sloboda RD, ed. Primary Cilia, Methods in Cell Biology, vol 94. Academic Press; 2009:2-52. doi:10.1016/S0091-679X(08)94001-2 - DOI - PubMed
    1. Higgins M, Obaidi I, McMorrow T. Primary cilia and their role in cancer (review). Oncol Lett. 2019;17:3041-3047. doi:10.3892/ol.2019.9942 - DOI - PMC - PubMed
    1. Satir P, Christensen ST. Structure and function of mammalian cilia. Histochem Cell Biol. 2008;129:687-693. doi:10.1007/s00418-008 - DOI - PMC - PubMed

LinkOut - more resources