. 2024 Oct 4:15:1466692.
doi: 10.3389/fimmu.2024.1466692. eCollection 2024.

Sex- and time-dependent role of insulin regulated aminopeptidase in lipopolysaccharide-induced inflammation

Affiliations

Sex- and time-dependent role of insulin regulated aminopeptidase in lipopolysaccharide-induced inflammation

Anika Vear et al. Front Immunol. .

Abstract

The enzyme, insulin regulated aminopeptidase (IRAP), is expressed in multiple immune cells such as macrophages, dendritic cells and T cells, where it plays a role in regulating the innate and adaptive immune response. There is a genetic association between IRAP and survival outcomes in patients with septic shock where a variant of its gene was found to be associated with increased 28-day mortality. This study investigated the role for IRAP in a lipopolysaccharide (LPS)-induced inflammatory response which is thought to model facets of the systemic inflammation observed in the early stages of human gram-negative sepsis. The frequencies and activation of splenic immune cell populations were investigated in the IRAP knockout (KO) mice compared to the wildtype controls over a period of 4-, 24-, or 48-hours following LPS stimulation. Dendritic cells isolated from the spleen of female IRAP KO mice, displayed significant increases in the activation markers CD40, CD86 and MHCII at 24 hours after LPS induction. A modest heightened pro-inflammatory response to LPS was observed with increased expression of activation marker CD40 in M1 macrophages from male IRAP knockout mice. Observations in vitro in bone marrow-derived macrophages (BMDM) revealed a heightened pro-inflammatory response to LPS with significant increases in the expression of CD40 in IRAP deficient cells compared with BMDM from WT mice. The heightened LPS-induced response was associated with increased pro-inflammatory cytokine secretion in these BMDM cells. A genotype difference was also detected in the BMDM from female mice displaying suppression of the LPS-induced increases in the activation markers CD40, CD86, CD80 and MHCII in IRAP deficient cells. Thus, this study suggests that IRAP plays specific time- and sex-dependent roles in the LPS-induced inflammatory response in dendritic cells and macrophages.

Keywords: IRAP; LPS; gram-negative sepsis; inflammation; insulin regulated aminopeptidase; lipopolysaccharide.


Conflict of interest statement

The authors declare that the research was conducted in the absence of any commercial or financial relationships that could be construed as a potential conflict of interest. The author(s) declared that they were an editorial board member of Frontiers, at the time of submission. This had no impact on the peer review process and the final decision.

Figures

Figure 1
Figure 1
LPS treatment results in time-dependent losses in body weight. Male & female wildtype (WT; filled circle) & IRAP knockout (KO; empty circle) mice (aged 10-15 weeks) were administered either vehicle (V; blue) or LPS (L; red) once for 4 hours (n=3) or 24 hours (n=3) or twice over 48 hours (n=8). (A) Body weight (BW), presented as % change from before treatment, decreased following LPS administration. (B) Spleen weight relative to the body weight (SW: BW) increased with LPS treatment. (C) Correlation analysis between change in BW and SW: BW after LPS treatment for 4 hours (r = 0.38, R2 = 0.14, p = 0.23), 24 hours (r = -0.62, R2 = 0.39, p = 0.03) and 48 hours (r = -0.74, R2 = 0.55, p<0.0001), analyzed via Pearson correlation. Data is presented as the mean ± SEM.
Figure 2
Figure 2
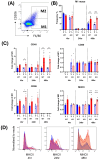
IRAP gene deletion may result in heightened responsiveness of M1 macrophages in the spleen of male mice 48 hours following LPS treatment. (A) Representative flow cytometry dot plot showing the gating for CD45+ F4/80+ CD206- M1 macrophages in the spleen, 48-hours following vehicle treatment. (B) The frequency (%) among live CD45+ cells of M1 macrophages in the spleen of male wildtype (WT; filled bars) and IRAP knockout (KO; empty bars) mice (aged 10-15 weeks) administered either vehicle (V; blue) or LPS (L; red) once for 4 hours (n=3) or 24 hours (n=3) or twice over 48 hours (n=6). (C) Quantification of the fold changes in mean fluorescence intensity (MFI) compared to the mean of vehicle controls of the activation markers CD40, CD80, CD86 and MHCII in M1 macrophages. Note that no positive MFI values were measured for CD80 at 4 hours. (D) Frequency curves of MHCII in macrophages from spleens of vehicle- (blue) and LPS-treated (red) WT (filled curves) and IRAP KO (empty curves) mice. Data from each timepoint was analyzed separately using a two-way ANOVA with Tukey’s post-hoc test, *p<0.05, **p<0.01, ***p<0.001. All data is presented as mean ± SEM.
Figure 3
Figure 3
IRAP gene deletion does not appear to influence the LPS-responsiveness of M1 macrophages in the spleen of female mice. (A) Representative flow cytometry dot plot showing the gating for CD45+ F4/80+ CD206- M1 macrophages in the spleen, 48-hours following vehicle treatment. (B) The frequency (%) among live CD45+ cells of M1 macrophages in the spleen of female wildtype (WT; filled bars) and IRAP knockout (KO; empty bars) mice (aged 10-15 weeks) administered either vehicle (V; blue) or LPS (L; red) once for 4 hours (n=3) or 24 hours (n=3) or twice over 48 hours (n=6). (C) Quantification of the fold changes in mean fluorescence intensity (MFI) compared to the mean of vehicle controls of the activation markers CD40, CD80, CD86 and MHCII in M1 macrophages. (D) Frequency curves of MHCII in macrophages from spleens of vehicle- (blue) and LPS-treated (red) WT (filled curves) and IRAP KO (empty curves) mice. Data from each timepoint was analyzed separately using a two-way ANOVA with Tukey’s post-hoc test, *p<0.05, **p<0.01, ***p<0.001, ****p<0.001. All data is presented as mean ± SEM.
Figure 4
Figure 4
IRAP gene deletion may influence the LPS responsiveness of M2 macrophages in the spleen of male mice. (A) Representative flow cytometry dot plot showing the gating for CD45+ F4/80+ CD206+ M2 macrophages in the spleen, 48-hours following vehicle treatment. (B) The frequency (%) among live CD45+ cells of M2 macrophages in the spleen of male wildtype (WT; filled bars) and IRAP knockout (KO; empty bars) mice (aged 10-15 weeks) administered either vehicle (V; blue) or LPS (L; red) once for 4 hours (n=3) or 24 hours (n=3) or twice over 48 hours (n=6). (C) Quantification of the fold changes in mean fluorescence intensity (MFI) compared to the mean of vehicle controls of the activation markers CD40, CD80, CD86 and MHCII in M2 macrophages. Data from each timepoint was analyzed separately using a two-way ANOVA with Tukey’s post-hoc test, *p<0.05, **p<0.01, ***p<0.001, ****p<0.0001 vehicle vs LPS, #p<0.05, ##p<0.01 WT vs KO. All data is presented as mean ± SEM.
Figure 5
Figure 5
IRAP gene deletion does not appear to influence the LPS responsiveness of M2 macrophages in the spleen of female mice. (A) Representative flow cytometry dot plot showing the gating for CD45+ F4/80+ CD206+ M2 macrophages in the spleen, 48-hours following vehicle treatment. (B) The frequency (%) among live CD45+ cells of M2 macrophages in the spleen of female wildtype (WT; filled bars) and IRAP knockout (KO; empty bars) mice (aged 10-15 weeks) administered either vehicle (V; blue) or LPS (L; red) once for 4 hours (n=3) or 24 hours (n=3) or twice over 48 hours (n=6). (C) Quantification of the fold changes in mean fluorescence intensity (MFI) compared to the mean of vehicle controls of the activation markers CD40, CD80, CD86 and MHCII in M2 macrophages. Data from each timepoint was analyzed separately using a two-way ANOVA with Tukey’s post-hoc test, *p<0.05, **p<0.01, ****p<0.0001 vehicle vs LPS, #p<0.05 WT vs KO. All data is presented as mean ± SEM.
Figure 6
Figure 6
IRAP gene deletion results in a heightened pro-inflammatory response in male BMDM. (A) Representative flow cytometry dot plots showing control (C) and LPS-treated (L) CD45+ F4/80+ CD206- M1 macrophages from male wildtype (WT) mice and (B) the frequencies (%) of the M1 macrophage population in WT (filled bars) and IRAP knockout (KO; empty bars) BMDM cultures. (C) Frequency curves of the activation markers CD40 and CD80 in C (blue) and L (red) WT (filled curve) and IRAP KO (empty curve) M1 macrophages. (D) Quantification of the fold changes in mean fluorescence intensity (MFI) compared to the mean of the controls of CD40, CD80, CD86 and MHCII in M1 macrophages. Data was analyzed using a two-way ANOVA with Tukey’s post-hoc test, **p<0.01 control vs LPS, ##p<0.01 WT vs KO, n=4-5. All data is presented as mean ± SEM.
Figure 7
Figure 7
IRAP gene deletion does not significantly alter macrophage activation in female BMDM. (A) Representative flow cytometry dot plots showing control (C) and LPS-treated (L) CD45+ F4/80+ CD206- M1 macrophages from female wildtype (WT) mice and (B) the frequencies (%) of the M1 macrophage population in WT (filled bars) and IRAP knockout (KO; empty bars) BMDM cultures. (C) Frequency curves of the activation markers CD40 and CD80 in C (blue) and L (red) WT (filled curve) and IRAP KO (empty curve) M1 macrophages. (D) Quantification of the fold changes in mean fluorescence intensity (MFI) compared to the mean of the controls of CD40, CD80, CD86 and MHCII in M1 macrophages. Data was analyzed using a two-way ANOVA with Tukey’s post-hoc test, ****p<0.0001 control vs LPS, ##p<0.01, ###p<0.001 WT vs KO, n=3. All data is presented as mean ± SEM.
Figure 8
Figure 8
IRAP-deficient BMDM have heightened LPS-induced increases in TNF-α and IL-1β expression. Representative immunofluorescent staining of (A) TNF-α or (B) IL-1β (green) in control (C) or LPS-treated (L) CD45+ (red) BMDM from male and female wildtype (WT) and IRAP knockout (KO) mice. (C) Protein concentrations (pg/ml) of TNF-α, IL-1β and IL-6 in the conditioned media of BMDM measured using a sandwich ELISA. Data was analyzed using three-way ANOVAs with Tukey’s post-hoc test, **p<0.01, ***p<0.001, n=5-6. Data is presented as mean ± SEM.
Figure 9
Figure 9
IRAP expression and distribution changes with LPS stimulation in BMDM. (A) Representative Western blot and (B) densitometric quantification of IRAP (~160 kDa) in cell lysates of untreated control (C; blue) or LPS-treated (L; red) BMDM derived from male and female, wildtype (WT) and IRAP knockout (KO) mice. Data is presented relative to protein concentration and the mean optical density (OD) of the male WT control and was analyzed using a three-way ANOVA with Tukey’s post-hoc test, *p<0.05, n=3 (3 samples per group on separate blots). (C) Representative immunofluorescent images and (D) semi-quantification of % colocalization of IRAP (green) and CD45 (red) in BMDM from WT mice. Data was analyzed using a two-way ANOVA with Tukey’s post-hoc test, n=3. All data is presented as mean ± SEM.
Figure 10
Figure 10
TLR4 is highly expressed at the cell surface in male IRAP-deficient macrophages. (A) Representative immunofluorescent images of TLR4 (green) in untreated control (C) and LPS-treated (L) CD45+ (red) BMDM derived from male and female wildtype (WT) and IRAP knockout (KO) mice. (B) Semi-quantification of TLR4 expression from immunofluorescent (IF) images of BMDM measured as % area positive staining relative to the cell count. (C) Semi-quantification of the TLR4 expressed at the cell surface of BMDM in IF images measured as % colocalization of TLR4 and CD45. (D) Raw mean fluorescence intensity (MFI) of cell surface TLR4 expression in CD45+ F4/80+ CD206- M1 macrophages in the spleens of mice treated for 4 hours with vehicle control (V) or LPS (L) measured via flow cytometry. All data was analyzed using three-way ANOVAs with Sidak’s post-hoc test, **p<0.01, n=3. All data is presented as mean ± SEM.

References

    1. Singer M, Deutschman CS, Seymour CW, Shankar-Hari M, Annane D, Bauer M, et al. . The third international consensus definitions for sepsis and septic shock (Sepsis-3). JAMA. (2016) 315:801–10. doi: 10.1001/jama.2016.0287 - DOI - PMC - PubMed
    1. Fleischmann C, Scherag A, Adhikari NK, Hartog CS, Tsaganos T, Schlattmann P, et al. . Assessment of global incidence and mortality of hospital-treated sepsis. Current estimates and limitations. Am J Respir Crit Care Med. (2016) 193:259–72. doi: 10.1164/rccm.201504-0781OC - DOI - PubMed
    1. Gyawali B, Ramakrishna K, Dhamoon AS. Sepsis: The evolution in definition, pathophysiology, and management. SAGE Open Med. (2019) 7:2050312119835043. doi: 10.1177/2050312119835043 - DOI - PMC - PubMed
    1. van der Poll T, Shankar-Hari M, Wiersinga WJ. The immunology of sepsis. Immunity. (2021) 54:2450–64. doi: 10.1016/j.immuni.2021.10.012 - DOI - PubMed
    1. Tracey KJ, Fong Y, Hesse DG, Manogue KR, Lee AT, Kuo GC, et al. . Anti-cachectin/TNF monoclonal antibodies prevent septic shock during lethal bacteraemia. Nature. (1987) 330:662–4. doi: 10.1038/330662a0 - DOI - PubMed

Substances

LinkOut - more resources