. 2024 Sep 30;14(16):6350-6369.
doi: 10.7150/thno.100374. eCollection 2024.

Tumor-derived extracellular vesicles convey solute transporters to induce bioenergetic dependence shift contributing to treatment resistance

Affiliations

Tumor-derived extracellular vesicles convey solute transporters to induce bioenergetic dependence shift contributing to treatment resistance

Jayshree Hirpara et al. Theranostics. .

Abstract

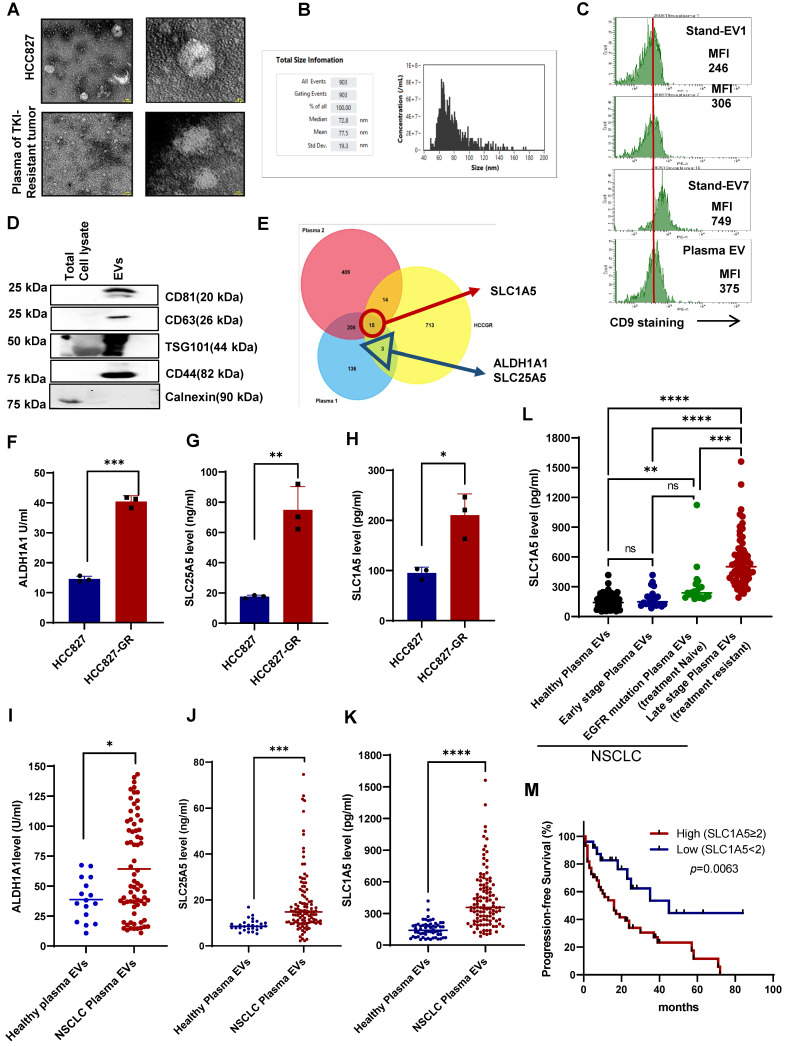
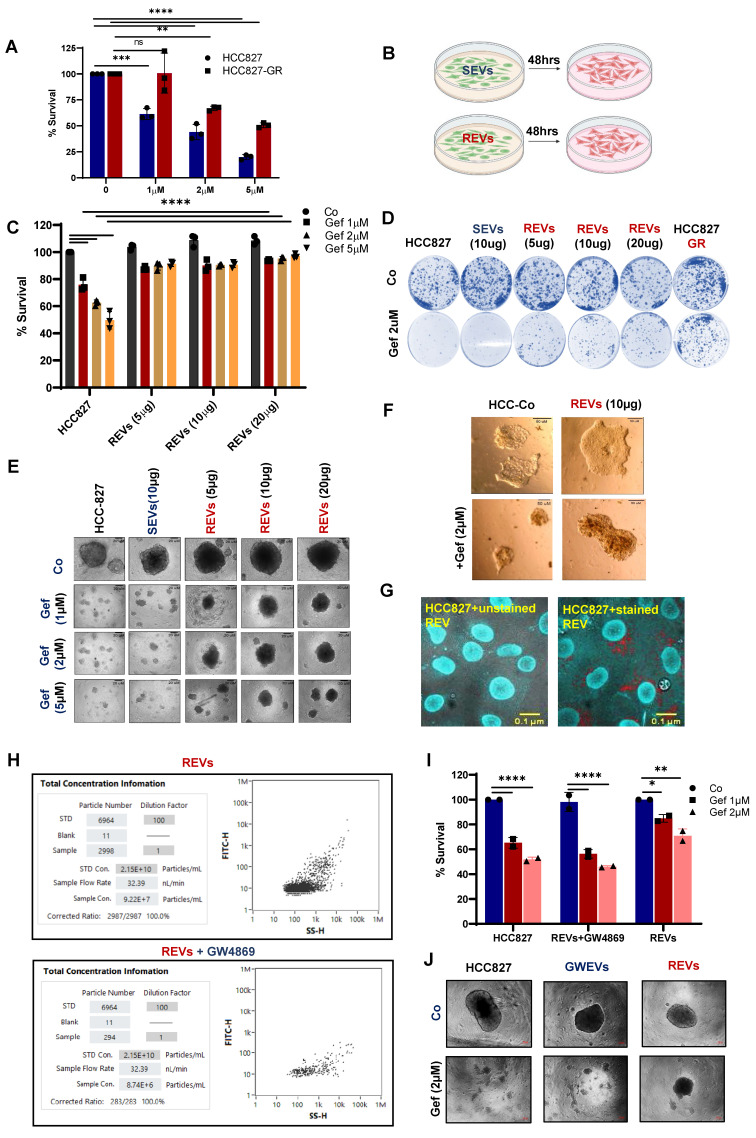
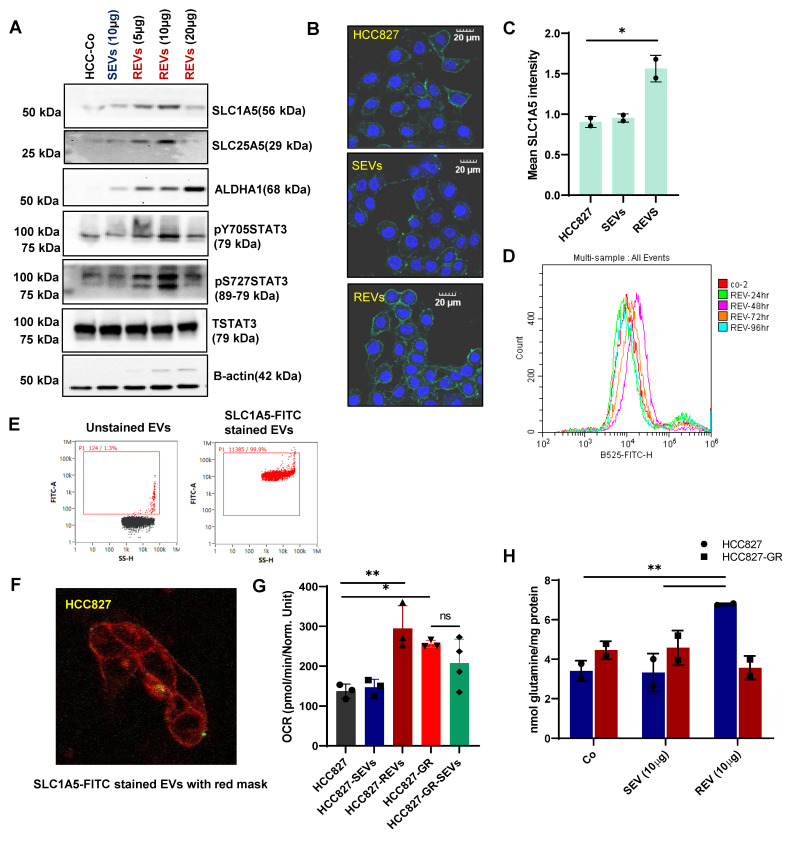
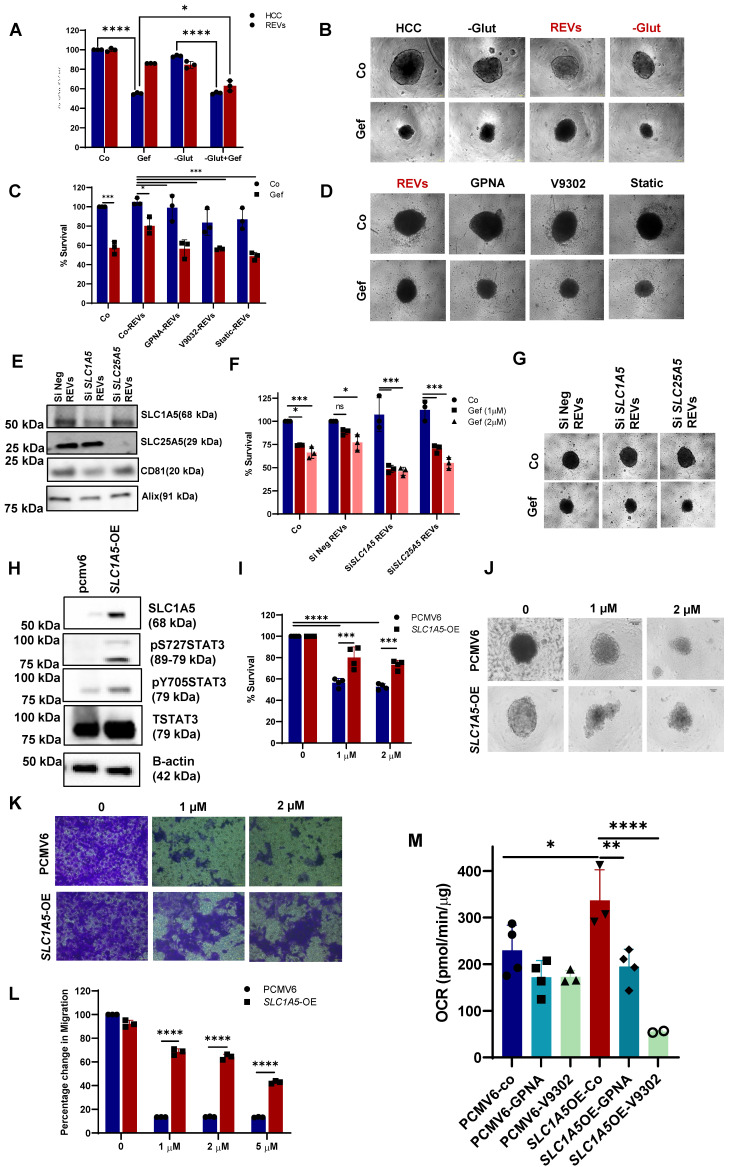
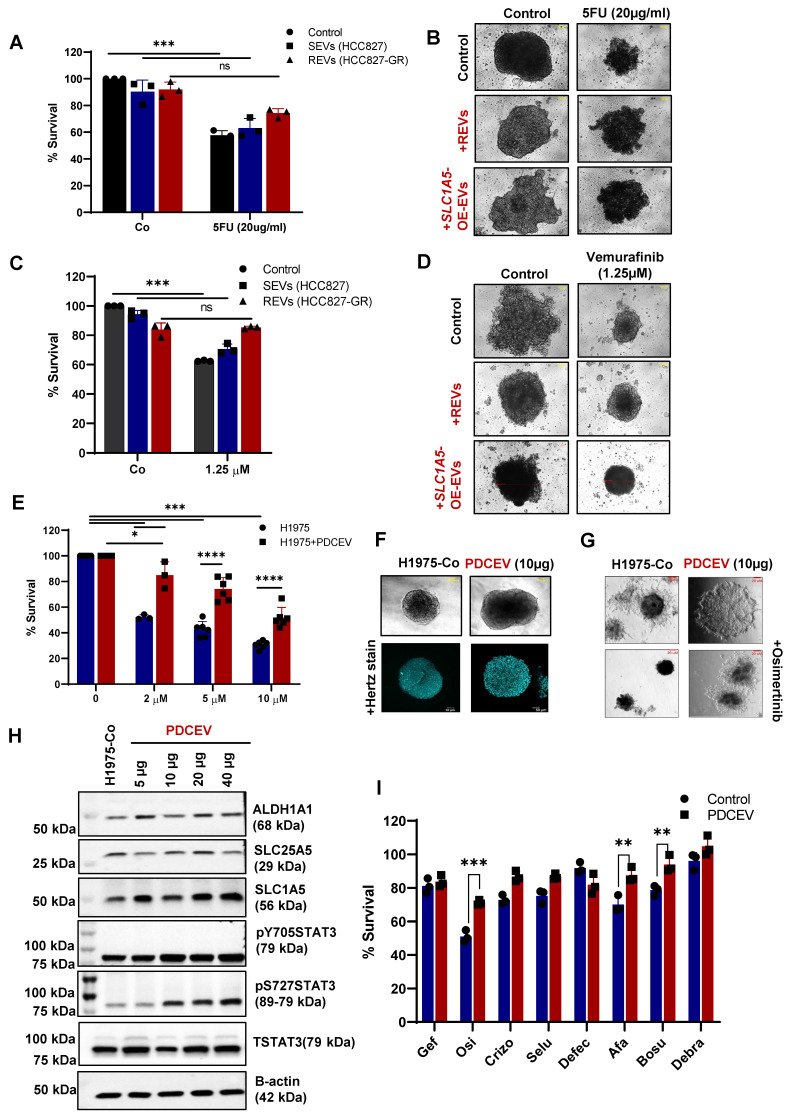
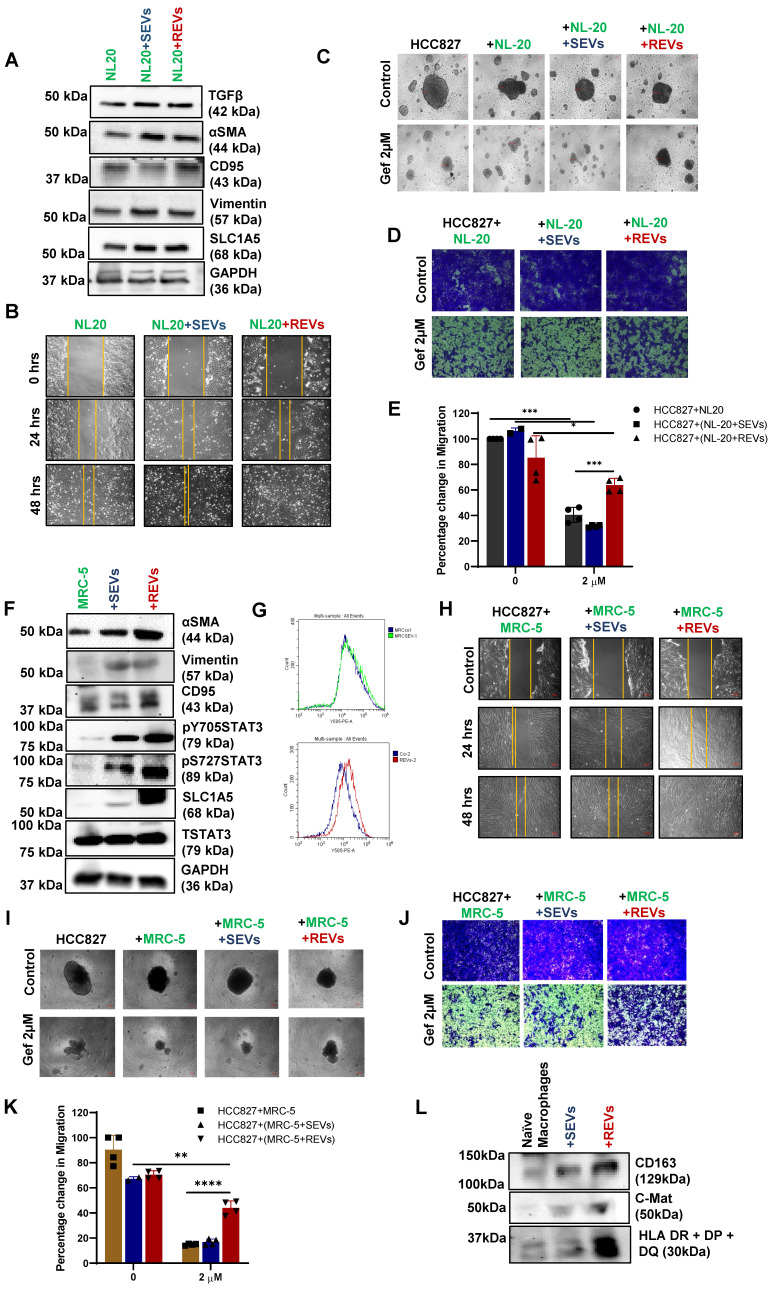
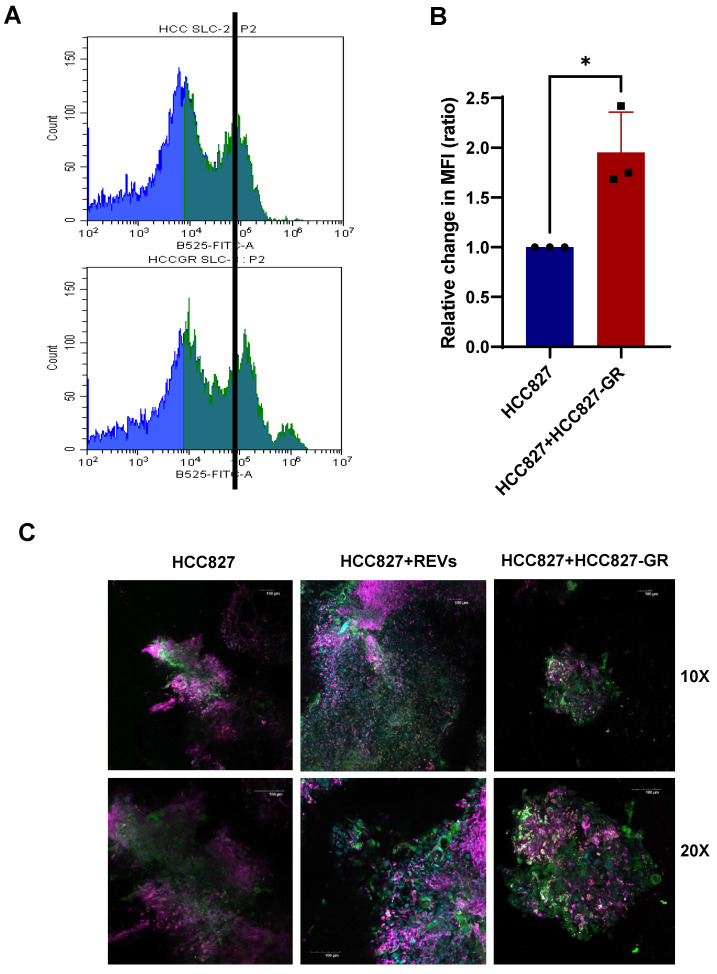
Rationale: Growing evidence points to the tumor microenvironment's role in developing drug resistance. A key element of this microenvironment is inter-cellular communication, which includes the release of membrane-encapsulated vesicles containing various cargo, known as extracellular vesicles (EVs). Understanding how EVs contribute to acquired resistance holds significant clinical implications. Methods: Differential centrifugation-based methods were used to isolate EVs from established cell lines and human plasma. TMT labeling proteomics analysis of EVs revealed an abundance of metabolic transporter proteins. Increased expression of SLC1A5 in EVs of patient-derived plasma and cell lines rendered resistant to tyrosine kinase inhibitors and its relationship with progression-free survival was assessed using Kaplan-Meier survival plot. Gene knockdown and overexpression of SLC1A5 were used to validate its effect on Tyrosine kinase inhibitor (TKI) resistance. Co-culture assays using inserts was used to evaluate the effect of resistant EVs on normal fibroblasts and epithelial cells. Next, mouse-derived tumor slices (MDTS) were cultured in vitro to assess the effect of resistant EVs. Results: We report here that TKI-sensitive cells are rendered resistant upon incubation with EVs derived from TKI-resistant cell lines. Metabolic transporters, in particular SLC1A5 and SLC25A5, are upregulated in EVs derived from TKI-resistant cells and plasma from patients harbouring TKI-resistant tumors and in TKI-resistant cell lines. Furthermore, we also provide evidence for the increased abundance of pSTAT3 and the stemness marker ALDH1A1 upon EV-induced resistance. Notably, resistant EVs trigger phenotypic and functional switching of lung-derived fibroblasts into tumor-associated fibroblasts, significantly increasing their migratory and invasive capacities. Conclusions: Our findings support the role of metabolic transporters within tumor-derived EVs in reshaping the tumor microenvironment to promote therapy resistance, which could have potential diagnostic, prognostic, and therapeutic implications.

Keywords: Extracellular Vesicles; SLC1A5; TKI-resistance; Tumor Microenvironment; metabolic reprogramming.


Conflict of interest statement

Competing Interests: The authors have declared that no competing interest exists.

Figures

Figure 1
Figure 1
Upregulation of metabolic pathway-related proteins in EVs derived from TKI-resistant cell lines and patient plasma. (A) Characterization of EVs isolated from the supernatant of HCC827 and plasma of a patient with TKI-resistant tumor by EM. Scale bar: 0.1 µM. (B) Size distribution of EVs isolated from cell culture supernatant analyzed by NanoFC. (C) Flow cytometry analysis of CD9 surface expression (MFI: Mean fluorescence intensity) on isolated EVs from plasma of a patient with TKI-resistant tumor. (D) Western blot showing expression of CD61, CD81, CD44, TSG101, and calnexin in whole cell lysates and isolated EVs. (E) Venn diagram showing the number of upregulated proteins in three different proteomics datasets from EVs of HCC827-GR/HCC827, plasma 1 (TKI-resistant NSCLC/healthy donor), and plasma 2 (pooled plasma of 5 different tumor/healthy donors). (F, G, and H) Protein expression of SLC1A5, SLC25A5, and ALDH1A1 in EVs isolated from supernatant of HCC827 and HCC827-GR cells using ELISA as described in Materials and Methods. (I, J, and K) Protein expression of SLC1A5, SLC25A5, and ALDH1A1 in the EVs isolated from the plasma of healthy donors (n = 16 for ALDH1A1 and n = 28 for SLC25A5 and n = 58 for SLC1A5) and plasma of TKI-resistant NSCLC patients (n = 111) by ELISA as described in Materials and Methods. (L) Protein expression of SLC1A5 in the EVs isolated from the plasma of healthy donors (n = 58), plasma of early-stage NSCLC (n = 20), plasma of EGFT mutant and treatment naïve NSCLC (n = 21), and late-stage and treatment-resistant NSCLC (N = 62) by ELISA as described in Materials and Methods. (M) Progression-free survival curve was generated using NSCLC patient's survival details with SLC1A5 level in fold difference (high SLC1A5 level ≥ 2, n = 44 and low SLC1A5 ≤ 2, n = 26 Log-rank Hazard Ratio: 2.632, 95% CI, 1.441-4.807, p = 0.0063). Unpaired T-test and two-way Anova were used in GraphPad Prism, version 9 for statistical significance (*p < 0.05, **p < 0.01, ***p < 0.001, ****p < 0.0001, ns: not significance).
Figure 2
Figure 2
EVs from TKI-resistant tumors induce resistance in TKI-sensitive cells (A) Cell viability of HCC827 and gefitinib-resistant HCC827-GR cells following 24 hours treatment with increasing concentrations of gefitinib and measured by crystal violet assay. (B) Schematic diagram made using Biorender software showing the experimental plan for exposure of TKI-sensitive cells to SEVs and REVs for 48 hours for use in further analyses. (C) HCC827 cells were exposed to SEVs or increasing concentrations of REVs for 48 hours followed by gefitinib treatment for 24 hours and cell viability was measured by crystal violet staining. (D) Effects on tumor long-term colony formation, (E) Spheroid formation, and (F) spheroid formation in matrigel were also assessed. 3000 cells (from the setup shown above) were re-seeded on 6-well plates or low attachment spheroid plates or small spheroids from the hanging drop method were seeded in matrigel and left for 7-10 days before staining with crystal violet or viewing under the microscope under 10X magnification, respectively. (Scale bar: 20 µM and 50 µM respectively). (G) Isolated EVs were stained with Acoerela for 1 h and the stained EVs were incubated with HCC827 cells for 6 hours, and visualized by confocal microscopy (Scale bar: 0.1 µM). (H) EVs concentration was checked using NanoFC after isolating from HCC827-GR cells treated with or without 10 µM GW4869 (GWEVs) for 48 hours. (I) HCC827 cells were exposed to GWEVs and REVs for 48 hours followed by treatment with gefitinib for 24 hours and cell viability was assessed by crystal violet staining. (J) Spheroid formation was assessed by re-seeding 3000 cells on low attachment spheroid plates and left for 7-10 days before viewing under the microscope using 10X magnification (Scale bar: 100 µM). Data are representative of at least 2-3 independent experiments and shown as mean ± SD of biological triplicates. Two-way ANOVA was employed for statistical significance (*p < 0.05, **p < 0.01, ***p < 0.001, ****p < 0.0001, ns: not significance).
Figure 3
Figure 3
REVs upregulate metabolic transporters. (A) Western blot showing increased SLC1A5, SLC25A5, ALDH1A1, STAT3pY705, and STAT3pS727 levels in total lysates of HCC827 cells exposed for 48 hours to SEVs or increasing concentrations of REVs. Total STAT3 and β-actin were used as loading controls. (B) Image viewed at 40X magnification by confocal microscopy showing increased surface expression of SLC1A5 in HCC827 cells after 48 hours exposure to REVs (Scale bar: 20 µM). (C) Samples from B (individual wells) were scanned using Tissue Fax and mean SLC1A5 intensity was derived and plotted using ImageJ and GraphPad prism, respectively. (D) Flow cytometry data showing surface expression of SLC1A5-FITC on HCC827 cells following incubation with 10 µg of REVs for the indicated duration. For flow analysis, at least 10,000 cells were analyzed by flow cytometry as described in Materials and Methods. (E) REVs were stained with SLC1A5-FITC and staining was analysed using NanoFC. (F) SLC1A5-FITC stained REVs were added to HCC827 cells and live imaging was done using a confocal microscope from 4 to 36 hours for every 20 minutes. A cell mask (red) was used to stain the cell membrane. (G) Increase in OCR in HCC827 cells upon exposure to REVs, measured using seahorse and plotted using GraphPad Prism software. (H) Increased intracellular glutamine levels in HCC827 cells after 48 hours exposure to REVs. Glutamine was measured as described in materials and methods and plotted using GraphPad prism software. Data are representative of at least 2-3 independent experiments and shown as mean ± SD of biological triplicates. Two-way ANOVA was employed for statistical significance (*p < 0.05, **p < 0.01).
Figure 4
Figure 4
REV-induced TKI resistance involves crosstalk between the glutamine pathway and STAT3 activation. (A) HCC827 cells were pre-exposed with REVs for 48 hours before 24 hours of treatment with gefitinib (2µM) in the presence or absence of glutamine. Cell viability was measured using CCK-8 assay. (B) Effect on spheroid formation was assessed in the samples from A; 3000 cells were re-seeded on low attachment spheroid plates and left for 7-10 days before viewing under the microscope using 10X magnification (Scale bar: 100 µM). (C) REVs pre-exposed HCC827 cells were pre-treated with glutamine transport inhibitors, GPNA (10 µM), V9302(10 µM), and STAT3 inhibitor, STATIC (1 µM), for 1 h before exposure to gefitinib (2 µM) for 24 hours. Cell viability was measured using CCK-8 assay. (D) Effect on spheroid formation was assessed in the samples from C; 3000 cells were re-seeded on low attachment spheroid plates and left for 7-10 days before viewing under the microscope using 10X magnification (Scale bar: 100 µM). (E) Western blot showing expression of SLC1A5, and SLC25A5 in lysates of EVs isolated from HCC827-GR cells transiently transfected (48 hours) with SiSLC1A5 and SiSLC25A5. CD81 and Alix were used as EV markers. (F) HCC827 cells were pre-exposed with REVs isolated from the SiSLC1A5 and SiSLC25A5 transfected cells for 48 hours before treatment with gefitinib for 24 hours. Cell viability was measured by crystal violet staining. (G) Effect on spheroid formation was assessed in the samples from F; 3000 cells were re-seeded on low attachment spheroid plates and left for 7-10 days before viewing under the microscope using 10X magnification (Scale bar: 100 µM). (H) HCC827 cells were stably transfected with pcmv6 vector or SLC1A5-GFP plasmid. Western blot showing over-expression of SLC1A5 and increased STAT3pY705 and STAT3pS727 levels. Total STAT3 and β-actin were used as loading controls. (I) Cell viability of HCC827 cells transfected with pcmv6 and SLC1A5-OE following treatment with gefitinib for 24 hours. Cell viability was measured using CCK-8 assay. (J) Effect on spheroid formation was assessed in the samples from I; 3000 cells were re-seeded on low attachment spheroid plates and left for 7-10 days before viewing under the microscope using 10X magnification (Scale bar: 100 µM). (K) Pcmv6 transfected or SLC1A5 overexpressing cells were treated with gefitinib for 24 hours and 75,000 cells were re-seeded into ThinCert® cell culture inserts for 48 hours, stained with crystal violet, and viewed under a microscope (Scale bar: 100 µm) and (L) quantified by dissolving with 33% (v:v) acetic acid and measuring absorbance at 590 nm, as described in Materials and Methods. Migration rates are plotted in percentages with respect to control cells. (M) Increased OCR in HCC827-SLC1A5-OE cells was inhibited upon exposure to glutamine transport inhibitors, GPNA and V9302, measured using seahorse and plotted using GraphPad Prism software. Data are representative of at least 3 independent experiments and shown as mean ± SD of biological triplicates. Two-way ANOVA was employed for statistical significance (*p<0.05, **p < 0.01, ***p < 0.0001, ****p < 0.0001, ns: not significant).
Figure 5
Figure 5
REVs induce resistance in different tumor models. (A) HCT116 cells were pre-exposed with SEVs, REVs, and SLC1A5-OE-EVs for 48 hours before treatment with 5 FU for 24 hours. Cell viability was measured using CCK-8 assay. (B) Effect on spheroid formation was assessed in the samples from A; 3000 cells were re-seeded on low attachment spheroid plates and left for 7-10 days before viewing under the microscope using 10X magnification (Scale bar:10 µm). (C) A375 cells were pre-exposed to SEVs, REVs, and SLC1A5-OE-EVs for 48 hours before treatment with Vemurafinib for 24 hours. Cell viability was measured using CCK-8 assay. (D) Effect on spheroid formation was assessed in the samples from C; 3000 cells were re-seeded on low attachment spheroid plates and left for 7-10 days before viewing under the microscope using 10X magnification (Scale bar:10 µm). (E) H1975 cells were pre-exposed to 10 µg EVs isolated from patient-derived cell lines (PDCEVs) for 48 hours before treatment with Osimertinib for 24 hours. Cell viability was measured using CCK-8 assay. (F, G) Spheroid formation in matrigel was assessed in the samples from E using the hanging drop technique (seeded in Matrigel) and left for 7-10 days before viewing under the microscope using 10X magnification or analyzed by confocal microscopy, respectively (Scale bar: 50 µM or 20 µM, respectively). (H) Western blot showing increased SLC1A5, SLC25A5, ALDH1A1, STAT3pY705, and STAT3pS727 levels in total lysates of H1975 cells exposed for 48 hours with increasing concentration of PDCEVs. Total STAT3 and B-actin were used as loading controls. (I) H1975 cells were pre-exposed with PDCEVs for 48 hours before treatment with 2 µM Gefitinib, Osimertinib, Crizotinib, Selumetinib, Afatinib, Bosutinib, and Debrafenib for 24 hours. Cell viability was measured using CCK-8 assay. Data are representative of at least 3 independent experiments and shown as mean ± SD of biological triplicates. Two-way ANOVA was employed for statistical significance (**p < 0.01, ***p < 0.001, ns: not significant).
Figure 6
Figure 6
REVs regulate tumor microenvironment. (A) Western blot showing increased SLC1A5, TGFβ, αSMA, CD95, and Vimentin levels in total lysates of NL-20 cells exposed for 48 hours with SEVs and REVs. GAPDH was used as a loading control. (B) The scratch assay shows an increase in the migratory capacity of NL-20 cells exposed to SEVs and REVs for 48 hours (Scale bar: 10 cm). (C) Effect on spheroid formation was assessed in the co-culture (NL-20, NL-20+SEVs, and NL-20+REVs with HCC827) cells after treatment with gefitinib for 24 hours; 3000 cells were re-seeded on low attachment spheroid plates and left for 7-10 days before viewing under the microscope using 10X magnification (Scale bar: 10 mM). (D) From the same setup, 75,000 cells were re-seeded in ThinCert® cell culture inserts for 48 hours, stained with crystal violet, and viewed under a microscope (Scale bar: 100 µm) and (E) quantified by dissolving with 33% (v:v) acetic acid and read at an absorbance of 590 nm as described in Materials and Methods. Migration rates are plotted in percentages with respect to control cells. (F) Western blot showing increased SLC1A5, αSMA, CD95, Vimentin, STAT3pY705, and STAT3pS727 levels in total lysates MRC-5 cells exposed for 48 hours with SEVs and REVs. Total STAT3 and GAPDH was used as loading controls. (G) Increase expression of FAP in MRC-5 cells exposed to REVs and analyzed using Flow cytometry. For flow analysis, at least 10,000 cells were analyzed as described in Materials and Methods. (H) Scratch assay shows an increase in the migratory capacity of NL-20 cells after 48 hours of exposure to SEVs and REVs. (I) Effect on spheroid formation was assessed in the co-culture (NL-20, NL-20+SEVs, and NL-20+REVs with HCC827) cells after treatment with gefitinib for 24 hours; 3000 cells were re-seeded on low attachment spheroid plates and left for 7-10 days before viewing under the microscope using 10X magnification (Scale bar: 10 mM). (J) From the same setup, 75,000 cells were reseeded in ThinCert® cell culture inserts for 48 hours stained with crystal violet and viewed under a microscope (Scale bar: 50 µm) and (K) quantified by dissolving with 33% (v:v) acetic acid and measuring absorbance at 590 nm as described in Materials and Methods. Migration rates are plotted in percentages with respect to control cells. Data are representative of at least 3 independent experiments and shown as mean ± SD of biological triplicates. Two-way ANOVA was employed for statistical significance (*p < 0.05, **p < 0.01, ***p < 0.001, ****p < 0.0001). (L) Western blot showing increased CD163, C-Mat, and HLA DR+DP+DQ level in naïve macrophages (M0) after being exposed to SEVs and REVs for 48 hours.
Figure 7
Figure 7
REVs regulate tumor microenvironment in vivo. (A, B) Flow cytometry data showing increased expression of SLC1A5 on HCC827 xenograft slices 48 hours after co-culture with HCC827-GR slices. For flow analysis, at least 10,000 cells were analyzed by flow cytometry as described in Materials and Methods (MFI: Median fluorescence intensity). Data are representative of at least 3 independent experiments and shown as mean ± SD of biological triplicates. An unpaired T-test was employed for statistical significance (*p < 0.05). (C) Surface expression of SLC1A5, CD163, and FAP was assessed following co-culture of HCC827 xenograft slices with HCC827-GR xenograft slices for 48 hours. Image viewed at 10X and 20X magnification by confocal microscopy (Scale bar: 100 µM).

References

    1. Yu HA, Arcila ME, Rekhtman N. et al. Analysis of tumor specimens at the time of acquired resistance to EGFR-TKI therapy in 155 patients with EGFR-mutant lung cancers. Clin Cancer Res. 2013 Apr 15;19(8):2240–7. - PMC - PubMed
    1. Ward PS, Thompson CB. Metabolic reprogramming: a cancer hallmark even warburg did not anticipate. Cancer Cell. 2012 Mar 20;21(3):297–308. - PMC - PubMed
    1. Hirpara J, Eu JQ, Tan JKM. et al. Metabolic reprogramming of oncogene-addicted cancer cells to OXPHOS as a mechanism of drug resistance. Redox Biol. 2019 Jul;25:101076. - PMC - PubMed
    1. Becker A, Thakur BK, Weiss JM. et al. Extracellular Vesicles in Cancer: Cell-to-Cell Mediators of Metastasis. Cancer Cell. 2016 Dec 12;30(6):836–848. - PMC - PubMed
    1. Kalluri R. The biology and function of exosomes in cancer. J Clin Invest. 2016 Apr 1;126(4):1208–15. - PMC - PubMed

Publication types

Substances

LinkOut - more resources