. 2024 Sep 30;14(16):6319-6336.
doi: 10.7150/thno.97149. eCollection 2024.

PET imaging of microglia in Alzheimer's disease using copper-64 labeled TREM2 antibodies

Affiliations

PET imaging of microglia in Alzheimer's disease using copper-64 labeled TREM2 antibodies

Monireh Shojaei et al. Theranostics. .

Abstract

Triggering receptor expressed on myeloid cells 2 (TREM2) plays an essential role in microglia activation and is being investigated as a potential therapeutic target for modulation of microglia in several neurological diseases. In this study, we present the development and preclinical evaluation of 64Cu-labeled antibody-based PET radiotracers as tools for non-invasive assessment of TREM2 expression. Furthermore, we tested the potential of an antibody transport vehicle (ATV) that binds human transferrin receptor to facilitate transcytosis of TREM2 antibody-based radiotracers to the CNS and improve target engagement. Methods: A TREM2 antibody with an engineered transport vehicle (ATV:4D9) and without (4D9) were covalently modified with pNCS-benzyl-NODAGA and labeled with copper-64. Potency, stability, and specificity were assessed in vitro followed by in vivo PET imaging at the early 2 h, intermediate 20 h, and late imaging time points 40 h post-injection using a human transferrin receptor (hTfR) expressing model for amyloidogenesis (5xFAD;TfRmu/hu) or wild-type mice (WT;TfRmu/hu), and hTfR negative controls. Organs of interest were isolated to determine biodistribution by ex vivo autoradiography. Cell sorting after in vivo tracer injection was used to demonstrate cellular specificity for microglia and to validate TREM2 PET results in an independent mouse model for amyloidogenesis (AppSAA;TfRmu/hu). For translation to human imaging, a human TREM2 antibody (14D3) was radiolabeled and used for in vitro autoradiography on human brain sections. Results: The 64Cu-labeled antibodies were obtained in high radiochemical purity (RCP), radiochemical yield (RCY), and specific activity. Antibody modification did not impact TREM2 binding. ATV:4D9 binding proved to be specific, and the tracer stability was maintained over 48 h. The uptake of [64Cu]Cu-NODAGA-ATV:4D9 in the brains of hTfR expressing mice was up to 4.6-fold higher than [64Cu]Cu-NODAGA-4D9 in mice without hTfR. TREM2 PET revealed elevated uptake in the cortex of 5xFAD mice compared to wild-type, which was validated by autoradiography. PET-to-biodistribution correlation revealed that elevated radiotracer uptake in brains of 5xFAD;TfRmu/hu mice was driven by microglia-rich cortical and hippocampal brain regions. Radiolabeled ATV:4D9 was selectively enriched in microglia and cellular uptake explained PET signal enhancement in AppSAA;TfRmu/hu mice. Human autoradiography showed elevated TREM2 tracer binding in the cortex of patients with Alzheimer's disease. Conclusion: [64Cu]Cu-NODAGA-ATV:4D9 has potential for non-invasive assessment of TREM2 as a surrogate marker for microglia activation in vivo. ATV engineering for hTfR binding and transcytosis overcomes the blood-brain barrier restriction for antibody-based PET radiotracers. TREM2 PET might be a versatile tool for many applications beyond Alzheimer's disease, such as glioma and chronic inflammatory diseases.

Keywords: ATV:4D9; PET; TREM2; copper-64; microglia.


Conflict of interest statement

Competing Interests: G.C.P., D.X., and K.M.M. are full-time employees and shareholders of Denali Therapeutics. The other authors have declared that no competing interest exists.

Figures

Figure 1
Figure 1
In vitro autoradiography experiments. (A) Sagittal sections show autoradiography results from 5xFAD;TfRmu/hu brain, upon blocking with 1000-fold excess cold ATV:4D9 antibody, and WT;TfRmu/hu brain. Arrows indicate increased uptake of [64Cu]Cu‑NODAGA-ATV:4D9 in the frontal cortex. (B) The brain sections of 5xFAD;TfRmu/hu (4 mice, 12 sections) revealed higher cortex-to-cerebellum ratio compared to WT;TfRmu/hu (3 mice, 11 sections) mice. Unpaired t-test, p < 0.0001 (****), boxplot min to max. (C) Quantification of pSYK levels by AlphaLISA (normalized to protein concentration) in lysates from HEK293 Flp-In cells that stably overexpress mouse TREM2 and mouse DAP12. Cells were stimulated with 4D9, NODAGA-4D9, ATV:4D9, NODAGA-ATV:4D9, and an isotype control. The experiment was performed once including n = 3 technical replicates. Unpaired t-test, (n = 3, mean ± SD).
Figure 2
Figure 2
Biodistribution experiments. (A) Schematic representation of the biodistribution workflow. (B) Decay-corrected brain uptake of [64Cu]Cu‑NODAGA-ATV:4D9 in 5xFAD;TfRmu/hu and WT;TfRmu/hu, as well as [64Cu]Cu‑NODAGA-4D9 in 5xFAD and WT mice, was determined after intracardial perfusion at 2 h, 20 h, and 40 h p.i. One-way ANOVA/Tukey's multiple comparison test, p ≤ 0.05 (*), p ≤ 0.01 (**), p ≤ 0.001 (***), and p ≤ 0.0001 (****), mean ± SD. Non-decay-corrected data are presented in Figure S5. (C) Whole-body biodistribution at 40 h p.i.
Figure 3
Figure 3
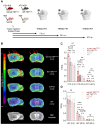
TREM2 PET imaging in 5xFAD and wild-type mice. (A) Schematic representation of the PET/CT workflow. (B) Group average PET images of 5xFAD;TfRmu/hu, 5xFAD, WT;TfRmu/hu and WT mouse brains at 20 h p.i. overlaid on an MRI template. Red arrows indicate highest uptake in the frontal cortex and the hippocampus of 5xFAD;TfRmu/hu animals. (C, D) Quantitative tracer uptake (%ID/g) in predefined VOIs of the frontal cortex (CTX) and the hippocampus (HIP). Striped bars illustrate the fraction of hTfR-related binding determined by biodistribution using 64Cu-labeled ATV:ISO (Figure S4). One-way ANOVA/Tukey's multiple comparison test, p ≤ 0.05 (*), p ≤ 0.01 (**), p ≤ 0.001 (***), and p ≤ 0.0001 (****), mean ± SD.
Figure 4
Figure 4
PET-to-biodistribution associations. (A) Images from voxel-wise regression analysis of biodistribution brain uptake with PET images using statistical parametric mapping (SPM). Color scale shows TREM2 PET voxels with highest correlation to biodistribution in red using all four genotypes. (B) TREM2 PET signals in data-driven cortical cluster VOIs derived from the regression analysis in correlation with brain uptake from biodistribution at 2 h, 20 h and 40 h p.i. (linear regression, α = 0.05, 95% CI), (C) Group comparison of TREM2 PET results in data-driven cortical cluster VOIs across genotypes. One-way ANOVA/Tukey's multiple comparison test, p ≤ 0.01 (**), p ≤ 0.001 (***), and p ≤ 0.0001 (****), mean ± SD.
Figure 5
Figure 5
Ex vivo autoradiography confirmation of regional TREM2 PET signals. (A) Ex vivo autoradiography of 5xFAD;TfRmu/hu, WT;TfRmu/hu, 5xFAD and WT brain sections at 2 h and 20 h p.i. (B,C) Higher cortex-to-cerebellum ratios were observed in 5xFAD;TfRmu/hu mice compared to WT;TfRmu/hu mice at the 2 h p.i. time point (5xFAD;TfRmu/hu: 2 mice, 22 sections; WT;TfRmu/hu: 2 mice, 15 sections; unpaired t-test, p < 0.0001 (****), boxplot min to max) and the 20 h p.i. time point (5xFAD;TfRmu/hu: 2 mice, 19 sections; WT;TfRmu/hu: 2 mice, 19 sections; unpaired t-test, p < 0.0001 (****), boxplot min to max).
Figure 6
Figure 6
scRadiotracing demonstrates specificity of [64Cu]Cu-NODAGA-ATV:4D9 to microglia. (A) Experimental workflow, including TREM2 PET at 20 h p.i., brain dissociation and cell sorting as well as flow cytometry and gamma emission recording to calculate radioactivity per cell (microglia = turquoise, astrocyte = pink, neuron = yellow, oligodendrocyte = gray). (B) TREM2 PET results are shown as axial (frontal cortex, hippocampus) and sagittal (forebrain, hindbrain) regional difference maps (n = 4 AppSAA;TfRmu/hu mice compared to n = 5 WT;TfRmu/hu of Fig.3) projected upon an MRI template. (C, D) Flow cytometry indicates high purity of CD11b-positive cells in microglia-enriched fractions and absence of CD11b-positive cells in the microglia-depleted fractions of n = 4 individual AppSAA;TfRmu/hu mice. Data are shown as mean fluorescence intensity. (E) Relative cellular abundance of microglial cells in AppSAA;TfRmu/hu (n = 4) mice compared to WT (n = 12) mice. Unpaired t-test, p = 0.0002 (***), mean ± SD. (F) TREM2 radiotracer uptake of microglia-enriched vs microglia-depleted (i.e. mixed fraction of neurons, astrocytes, oligodendrocytes) fractions in AppSAA;TfRmu/hu mice, confirming high specificity to microglia. Unpaired t-test, p < 0.0001 (****), mean ± SD. (G) Estimation of the PET signal percentage which is explained by microglial uptake as a product of microglial abundance and microglial tracer uptake per cell. Based on (E) and 7.4 × 10⁶ microglia in WT brains taken from literature, we calculated 24.7 × 10⁶ microglia in AppSAA;TfRmu/hu brains.
Figure 7
Figure 7
[64Cu]Cu‑NODAGA-14D3 ARG signal represents TREM2 IHC signal in Alzheimer's disease patients. (A) Representative TREM2 immunohistochemistry (IHC) and in vitro autoradiography (ARG) of frontal brain sections derived from a patient with Alzheimer's disease (AD) revealed cortical binding of [64Cu]Cu‑NODAGA-14D3. TREM2 IHC and tracer binding in ARG co-localized. Autoradiography of a blocked brain slice demonstrated a negligible signal. (B) Cortex-to-white matter ratios were consistent in IHC and ARG and significantly higher than in blocked ARG (One-way ANOVA/Tukey's multiple comparison test, p ≤ 0.001 (***), boxplot min to max). (C) ARG-blocking resulted in a cortical signal reduction (unpaired t-test, p < 0.0001 (****), boxplot min to max).

References

    1. Amor S, Peferoen LA, Vogel DY, Breur M, van der Valk P, Baker D. et al. Inflammation in neurodegenerative diseases - an update. Immunology. 2014;142:151–66. - PMC - PubMed
    1. Przedborski S, Vila M, Jackson-Lewis V. Neurodegeneration: what is it and where are we? J Clin Invest. 2003;111:3–10. - PMC - PubMed
    1. Jucker M, Walker LC. Propagation and spread of pathogenic protein assemblies in neurodegenerative diseases. Nat Neurosci. 2018;21:1341–9. - PMC - PubMed
    1. Prusiner SB. Biology and genetics of prions causing neurodegeneration. Annu Rev Genet. 2013;47:601–23. - PMC - PubMed
    1. Heneka MT, Carson MJ, El Khoury J, Landreth GE, Brosseron F, Feinstein DL. et al. Neuroinflammation in Alzheimer's disease. Lancet Neurol. 2015;14:388–405. - PMC - PubMed

Publication types

MeSH terms