. 2024 Dec;11(47):e2404085.
doi: 10.1002/advs.202404085. Epub 2024 Oct 21.

Advancing Anticancer Drug Discovery: Leveraging Metabolomics and Machine Learning for Mode of Action Prediction by Pattern Recognition

Affiliations

Advancing Anticancer Drug Discovery: Leveraging Metabolomics and Machine Learning for Mode of Action Prediction by Pattern Recognition

Mohamad Saoud et al. Adv Sci (Weinh). 2024 Dec.

Abstract

A bottleneck in the development of new anti-cancer drugs is the recognition of their mode of action (MoA). Metabolomics combined with machine learning allowed to predict MoAs of novel anti-proliferative drug candidates, focusing on human prostate cancer cells (PC-3). As proof of concept, 38 drugs are studied with known effects on 16 key processes of cancer metabolism, profiling low molecular weight intermediates of the central carbon and cellular energy metabolism (CCEM) by LC-MS/MS. These metabolic patterns unveiled distinct MoAs, enabling accurate MoA predictions for novel agents by machine learning. The transferability of MoA predictions based on PC-3 cell treatments is validated with two other cancer cell models, i.e., breast cancer and Ewing's sarcoma, and show that correct MoA predictions for alternative cancer cells are possible, but still at some expense of prediction quality. Furthermore, metabolic profiles of treated cells yield insights into intracellular processes, exemplified for drugs inducing different types of mitochondrial dysfunction. Specifically, it is predicted that pentacyclic triterpenes inhibit oxidative phosphorylation and affect phospholipid biosynthesis, as confirmed by respiration parameters, lipidomics, and molecular docking. Using biochemical insights from individual drug treatments, this approach offers new opportunities, including the optimization of combinatorial drug applications.

Keywords: cancer; drug discovery; machine learning; metabolomics; mode of action.


Conflict of interest statement

The authors declare no conflict of interest.

Figures

Figure 1
Figure 1
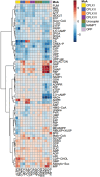
Hierarchical cluster analysis of metabolic patterns induced by 38 reference compounds inhibiting different molecular targets modulating the metabolism of prostate cancer cells (PC‐3). Aggregated leaves of hexuplicate experimental data are presented. Metabolic patterns of AKT inhibitors were so similar that individual replicates of the inhibitors PR and OR co‐clustered with each other. For this reason, we defined a mixed group “PR/OR”. A complete cluster analysis of all individual training samples is presented in Figure S2 (Supporting Information). Compounds: BETA – betulinic acid, MASA – maslinic acid, BOWA – boswellic acid, EMOD – emodin, 2DNP – 2,4‐dinitrophenol, CCCP – carbonyl cyanide chlorophenylhydrazone, HEXA – hexachlorophene, BITN – bithionol, CYAN – potassium cyanide, AZID – sodium azide, MALO – malonic acid, 3‐NP – 3‐nitropropionic acid, AMYC – antimycin A, ATOV – atovaquone, METF – metformin, ROTN – rotenone, GNE – GNE‐617, GMX – GMX1778, FK866 – FK866, 6‐AN – 6‐aminonicotinamide, WRTN – wortmannin, RAPA – rapamycin, ALPL – alpelisib, PTXL – paclitaxel, VINC – vincristin, MITO – mitoxantrone, CMPT – camptothecin, DOXO – doxorubicin, IRIN – irinotecan, PRFN (PR) – perifosine, ORID (OR) – oridonin, ETOP – etoposid, EGCG – epigallocatechin gallate, APIG – apigenin, GPDi – glucose‐6‐phosphate dehydrogenase inhibitor, LOVA – lovastatin, ATOR – atorvastatin, FLUV – fluvastatin. MoA: AKT – protein kinase B (AKT), Antimicrotubule, CPLX I – complex I, CPLX II – complex II, CPLX III – complex III, CPLX IV – complex IV, FAB – fatty acid biosynthesis, GDH – glutamate dehydrogenase, HMG‐CoAr – HMG‐CoA reductase, mTOR – PI3K/mTOR signaling, NAMPT – nicotinamide phosphoribosyltransferase, OPP – oxidative pentose phosphate pathway, PLB – phospholipid biosynthesis, TopoI – topoisomerase I, TopoII – topoisomerase II, Uncoupler – uncoupling of oxidative phosphorylation.
Figure 2
Figure 2
Relative abundance of selected CCEM intermediates after OXPHOS inhibition of the complexes I‐IV, application of uncouplers, inhibition of nicotinamide phosphoribosyltransferase (NAMPT), and the oxidative pentose phosphate pathway. Data depict average log2‐fold changes of cell number‐normalized peak areas obtained after 48 h drug treatment (n = 6) relative to vehicle control (n = 6). Legends of MoA and compound labels are given in Figure 1 and Tables S1 and S2 (Supporting Information).
Figure 3
Figure 3
Relative abundance of selected intermediates from the pentose phosphate pathway, TCA cycle and pyrimidine biosynthesis in response to CPLX I‐IV inhibition. The heatmap displays the log₂ fold changes of these metabolites compared to untreated controls across treatments with inhibitors of CPLX I, II, III, and IV, respectively (from left to right). The mitochondrial coenzyme Q junction links pyrimidine nucleotide biosynthesis to the mitochondrial ETC. In order to fuel ATP formation, OXPHOS generates a proton gradient across the inner mitochondrial membrane through the electron transfer chain (ETC), which involves four protein complexes (CPLX I‐CPLX IV). Both CPLX I and CPLX II transfer electrons to ubiquinone (coenzyme Q, CoQ) in the inner mitochondrial membrane resulting in ubiquinol (UQH2) reconstitution. By contrast, CPLX III is responsible for the reoxidation of ubiquinol to ubiquinone, which is important not only for the function of CPLX I and CPLX II. CPLX IV then transfers the electrons to molecular oxygen. Metabolite abbreviations are given in Table S2 ((Supporting Information)). This graph was created with BioRender.com.
Figure 4
Figure 4
Performance evaluation and MoA prediction by machine learning approaches. A) Mean accuracy of k‐nearest neighbor classifier (kNN), Lasso‐based approach (Lasso), and Random Forest classifier (Random Forest) in leave‐one‐out cross‐validation over the drugs in the training set. B,C) Mean accuracy per MoA, where entries on the main diagonal correspond to correct classification and off‐diagonal elements indicate alternative MoA (row), B‐Lasso, C‐Random Forest. D,E) Normalized prediction scores for the MoAs of four cytotoxic compounds obtained by D‐Lasso‐, and E‐Random Forest classifier. An alternative visualization of the prediction results is provided in Figure S12 (Supporting Information), which shows the fraction of replicates assigned to a specific MoA according to the largest prediction score. MoA abbreviations are listed in Figure 1, GLYA – glycyrrhetinic acid, AAHR – asiatic acid homopiperazinyl rhodamine B conjugate, BRST – Breastin (patented Nerium oleander cold water extract), QQrB – cucurbitacin B. The R source code to generate Figure 4A–C is provided in Data S1 (Supporting Information).

References

    1. Alarcon‐Barrera J. C., Kostidis S., Ondo‐Mendez A., Giera M., Drug Discovery Today 2022, 27, 1763. - PubMed
    1. Zampieri M., Szappanos B., Buchieri M. V., Trauner A., Piazza I., Picotti P., Gagneux S., Borrell S., Gicquel B., Lelievre J., Papp B., Sauer U., Sci. Transl. Med. 2018, 10, eaal3973. - PMC - PubMed
    1. Campos A. I., Zampieri M., Mol. Cell 2019, 74, 1291. - PMC - PubMed
    1. Vincent I. M., Ehmann D. E., Mills S. D., Perros M., Barrett M. P., Antimicrob Agents Ch. 2016, 60, 2281. - PMC - PubMed
    1. Ortega‐Tenezaca B., Gonzalez‐Diaz H., Nanoscale 2021, 13, 1318. - PubMed

Substances

LinkOut - more resources