. 2024 Nov 28;16(46):7908-7914.
doi: 10.1039/d4ay01511h.

Droplet-based fluorescence anisotropy insulin immunoassay

Affiliations

Droplet-based fluorescence anisotropy insulin immunoassay

Damilola I Adeoye et al. Anal Methods. .

Abstract

Over the last several decades, multiple microfluidic platforms have been used for measurement of hormone secretion from islets of Langerhans. Most have used continuous flow systems where mixing of hormones with assay reagents is governed by diffusion, leading to long mixing times, especially for biomolecules like peptides and proteins which have large diffusion coefficients. Consequently, dispersion of rapidly changing signals can occur, reducing temporal resolution. Droplet microfluidic systems can be used to capture reagents into individual reactors, limiting dispersion and improving temporal resolution. In this study, we integrated a fluorescence anisotropy (FA) immunoassay (IA) for insulin into a droplet microfluidic system. Insulin IA reagents were mixed online with insulin and captured quickly into droplets prior to passing through a 200 mm incubation channel. Double etching of the glass device was used to increase the depth of the incubation channel compared to the IA channels to maintain proper flow of reagents. The droplet system produced highly precise FA results with relative standard deviations < 2% at all insulin concentrations tested, whereas the absolute fluorescence intensity precisions ranged between 5 and 6%. A limit of detection of 3 nM for insulin was obtained, similar to those found in conventional flow systems. The advantage of the system was in the increased temporal resolution using the droplet system where a 9.8 ± 2.6 s response time was obtained, faster than previously reported continuous flow systems. The improved temporal resolution aligns with continued efforts to resolve rapid signaling events in pancreatic islet biology.


Conflict of interest statement

The authors declare that they have no conflicts of interest.

Figures

Fig. 1
Fig. 1. Microfluidic droplet generation system. The microfluidic design used in the experiments is shown. The glass device had five inlets, inlets 1 and 2 were used to deliver buffer, insulin, or Cy5 depending on the experiment. A constant concentration of Ab and Ins* were delivered to the device via their respective inlets. The last inlet was used for oil that encapsulated these aqueous reagents into droplets and transported to the incubation channel where mixing and binding occurred, prior to detection shown by the X. The inset shows the T-junction and a portion of the mixing channel (boxed in red) showing droplet formation.
Fig. 2
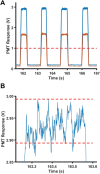
Fig. 2. Droplet analysis. Representative data using 25 nM Ab, 25 nM Ins*, and 50 nM insulin segmented into droplets. The parallel intensity is measured in PMT1 (blue curve) and the perpendicular intensity is measured in PMT2 (orange curve). (A) A 5 s segment of data is shown with the 1 V threshold for data analysis highlighted by the dashed red line. (B) A zoomed-in view of a single droplet within 0.1 V of the maximum signal. The data within this window were averaged and used to calculate an average anisotropy for this droplet. Each droplet was analyzed in a similar manner producing one anisotropy value for each droplet.
Fig. 3
Fig. 3. Incubation distance. The change in anisotropy between 0 and 500 nM insulin with 25 nM Ins* and 25 nM Ab is plotted as a function of distance in the incubation channel. The points are the average of 300 s of data and the error bars correspond to the propagation of error from the difference in the two measurements. The Δr at 160 and 190 mm are significantly different than the Δr at 20 mm, while the 160 and 190 mm are not significantly different.
Fig. 4
Fig. 4. Temporal resolution. Buffer was initially delivered followed by a pulse of 1 μM Cy5. Time to reach 10 and 90% of the final PMT responses are indicated by the black dotted lines and the response time was calculated as the difference in time between these points. The aqueous flow rate was 0.6 μL min−1 and the oil carrier phase was 1.2 μL min−1.
Fig. 5
Fig. 5. Insulin immunoassay calibration curve. Representative calibration curve of FA as a function of insulin concentration in droplets. The final concentration of both Ab and Ins* was 25 nM. The points are the averages of the calculated anisotropy over a 300 s measurement. Error bars are ±1 SD and the blue line is a four-parameter logistic curve fit to the data.

References

    1. Saeedi P. Petersohn I. Salpea P. Malanda B. Karuranga S. Unwin N. Colagiuri S. Guariguata L. Motala A. A. Ogurtsova K. Shaw J. E. Bright D. Williams R. Committee on behalf of the IDA Global and Regional Diabetes Prevalence Estimates for 2019 and Projections for 2030 and 2045: Results from the International Diabetes Federation Diabetes Atlas, 9th Edition. Diabetes Res. Clin. Pract. 2019;157:107843. doi: 10.1016/j.diabres.2019.107843. - DOI - PubMed
    1. Regeenes R. Rocheleau J. V. Twenty years of islet-on-a-chip: microfluidic tools for dissecting islet metabolism and function. Lab Chip. 2024;24:1327–1350. doi: 10.1039/D3LC00696D. - DOI - PubMed
    1. Duncombe T. A. Tentori A. M. Herr A. E. Microfluidics: reframing biological enquiry. Nat. Rev. Mol. Cell Biol. 2015;16:554–567. doi: 10.1038/nrm4041. - DOI - PMC - PubMed
    1. Roper M. G. Cellular Analysis Using Microfluidics. Anal. Chem. 2016;88:381–394. doi: 10.1021/acs.analchem.5b04532. - DOI - PubMed
    1. Shackman J. G. Reid K. R. Dugan C. E. Kennedy R. T. Dynamic monitoring of glucagon secretion from living cells on a microfluidic chip. Anal. Bioanal. Chem. 2012;402:2797–2803. doi: 10.1007/s00216-012-5755-7. - DOI - PMC - PubMed

MeSH terms