. 2024 Dec 1;213(11):1620-1634.
doi: 10.4049/jimmunol.2400467.

Homeostatic Macrophages Prevent Preterm Birth and Improve Neonatal Outcomes by Mitigating In Utero Sterile Inflammation in Mice

Affiliations

Homeostatic Macrophages Prevent Preterm Birth and Improve Neonatal Outcomes by Mitigating In Utero Sterile Inflammation in Mice

Valeria Garcia-Flores et al. J Immunol. .

Abstract

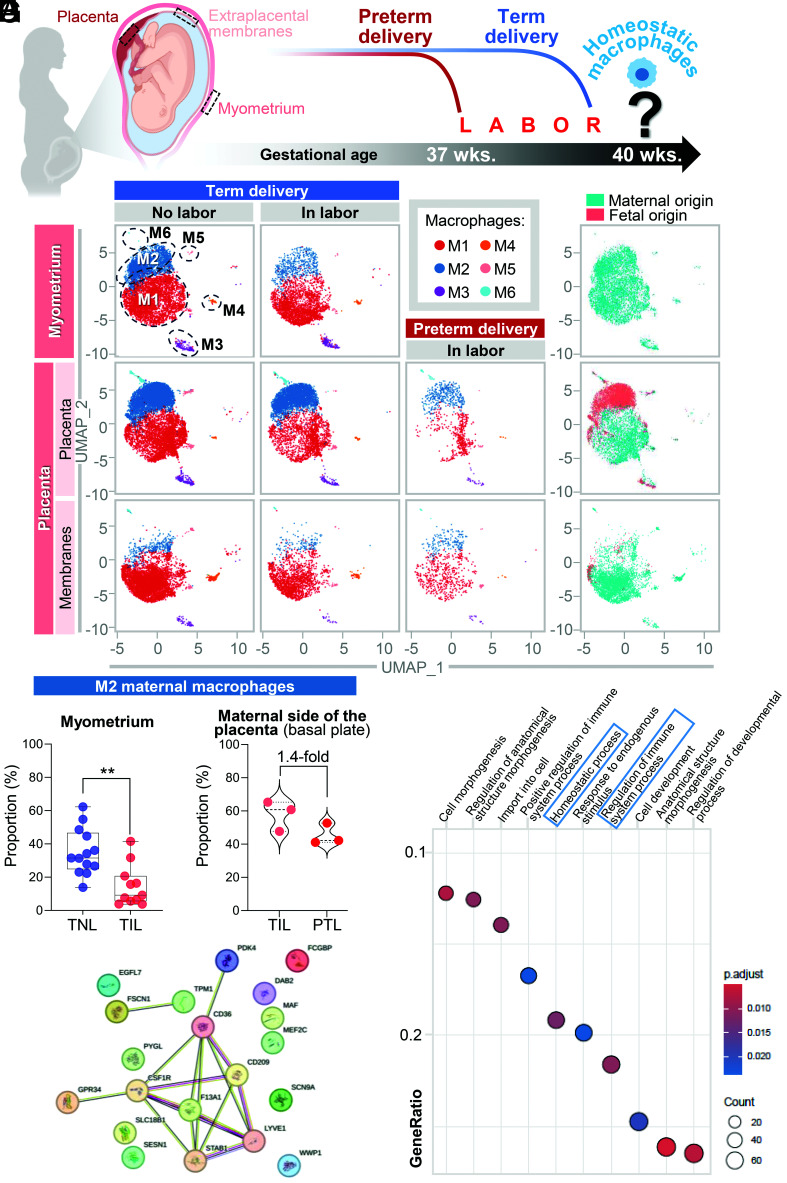
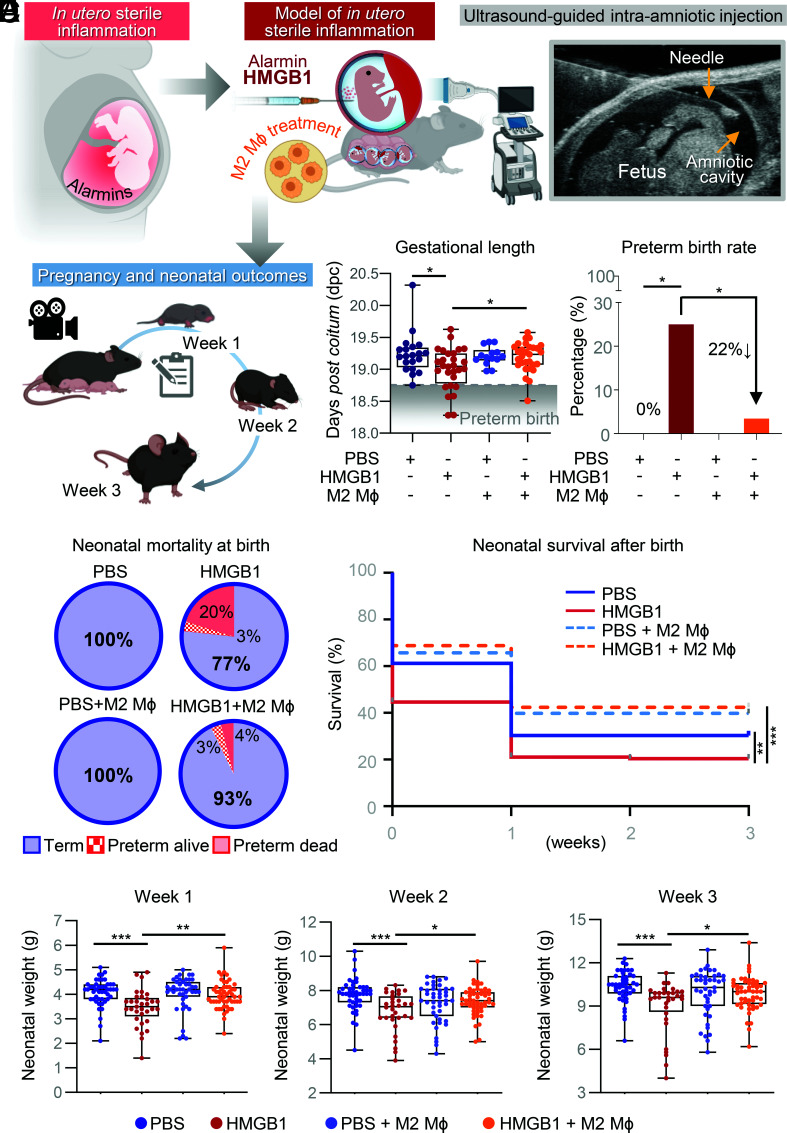
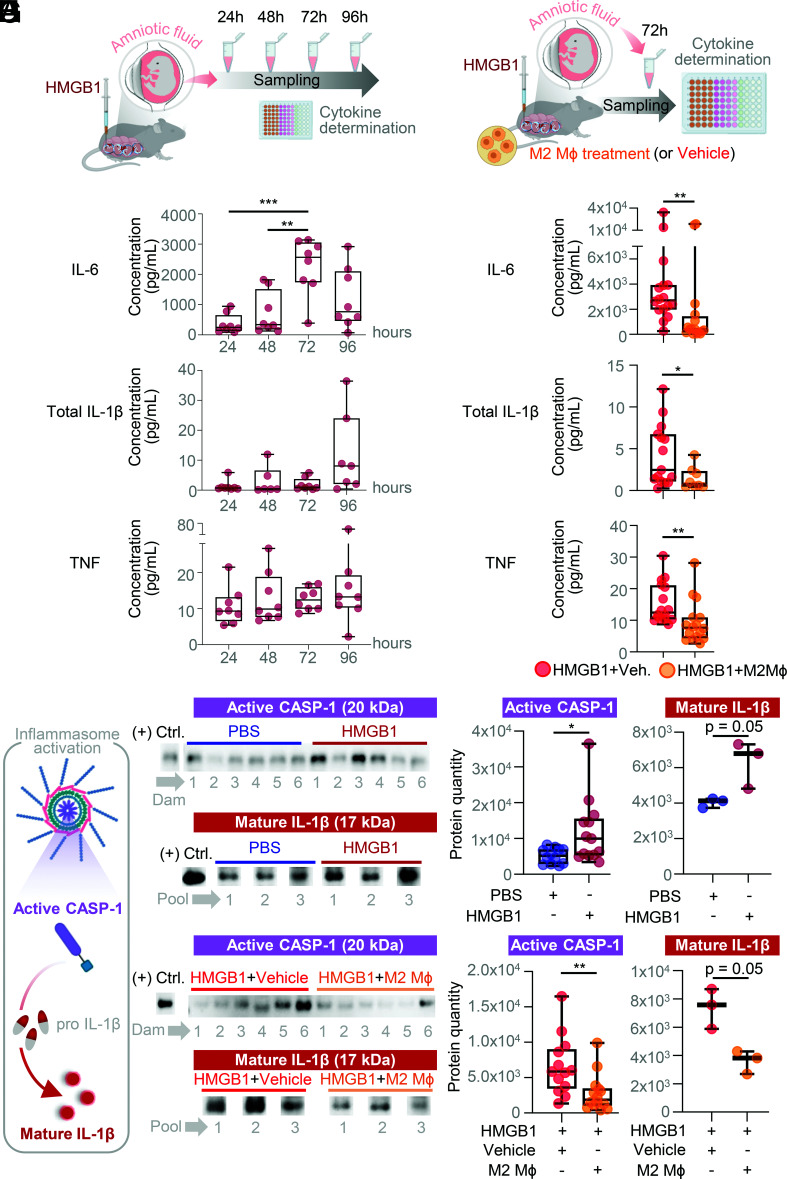
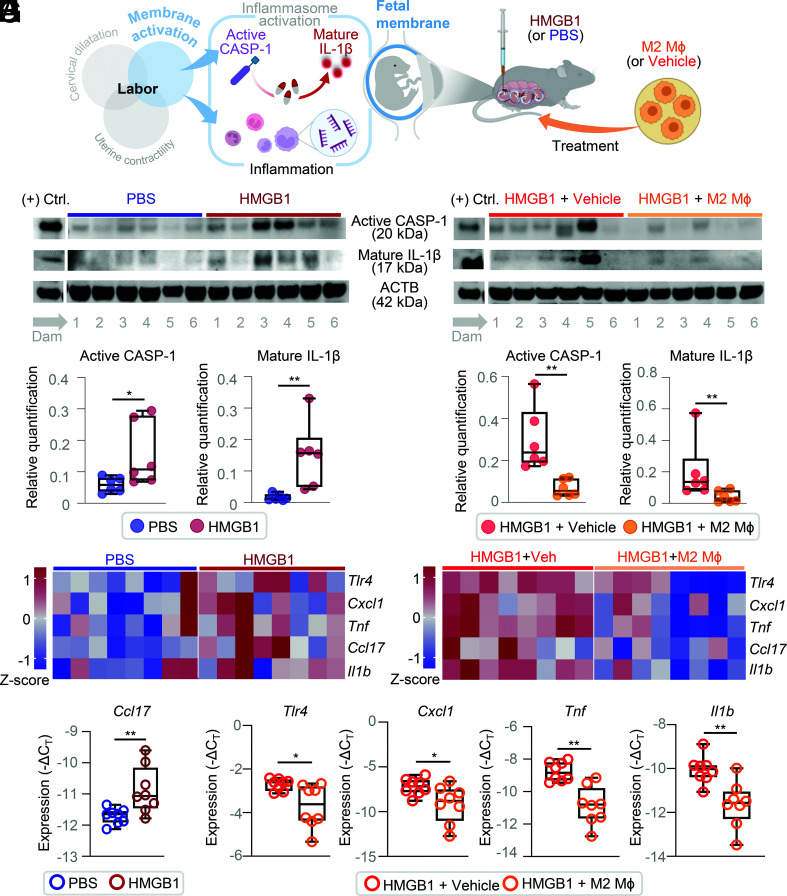
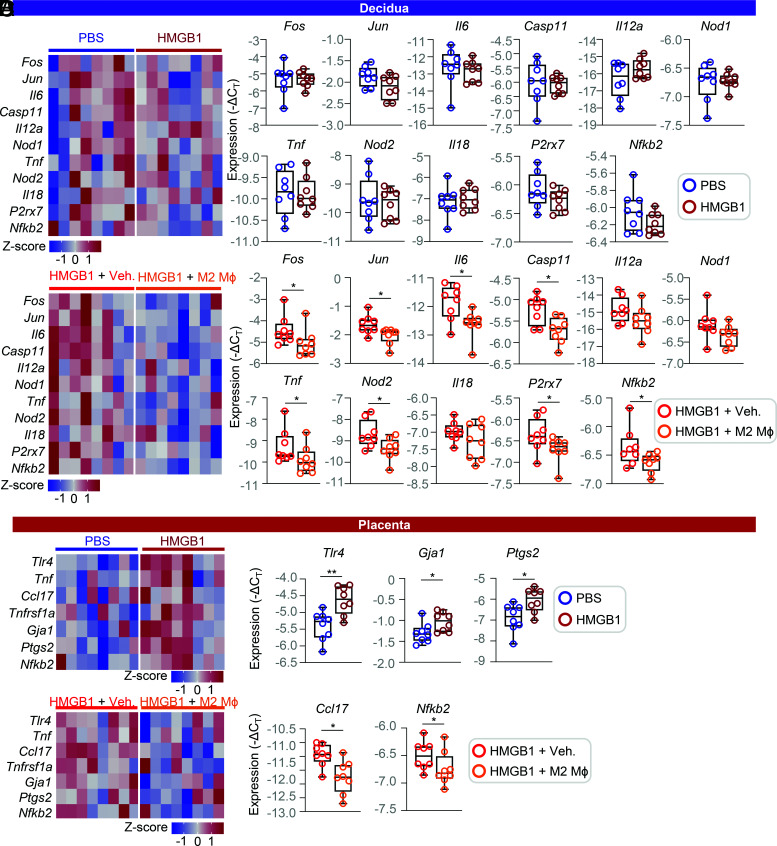
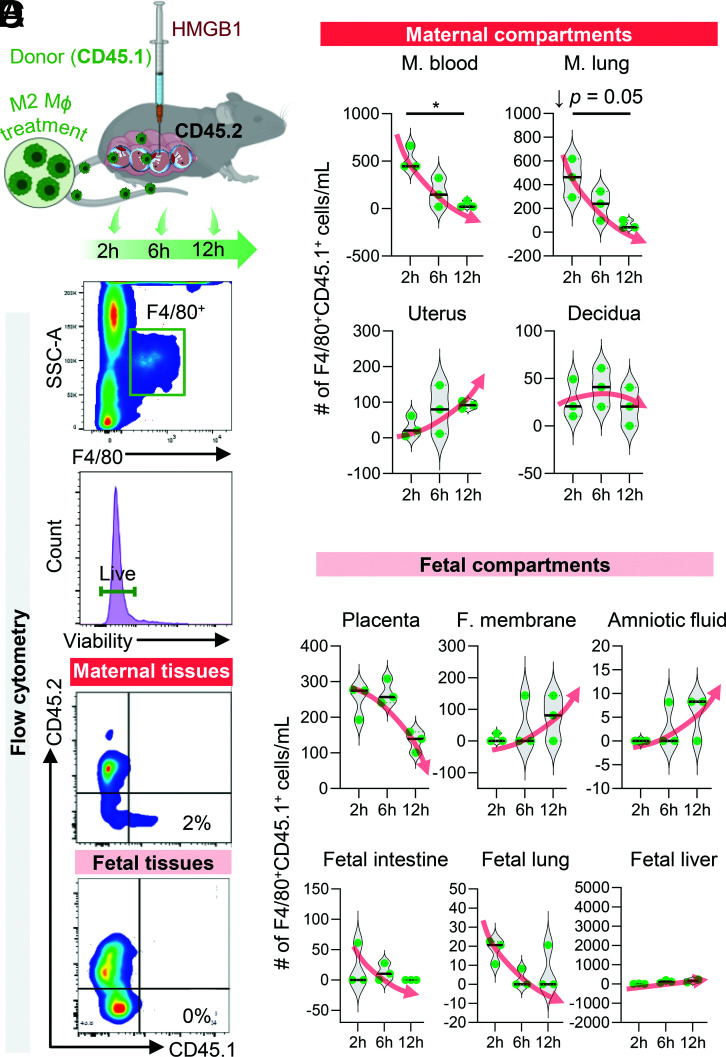
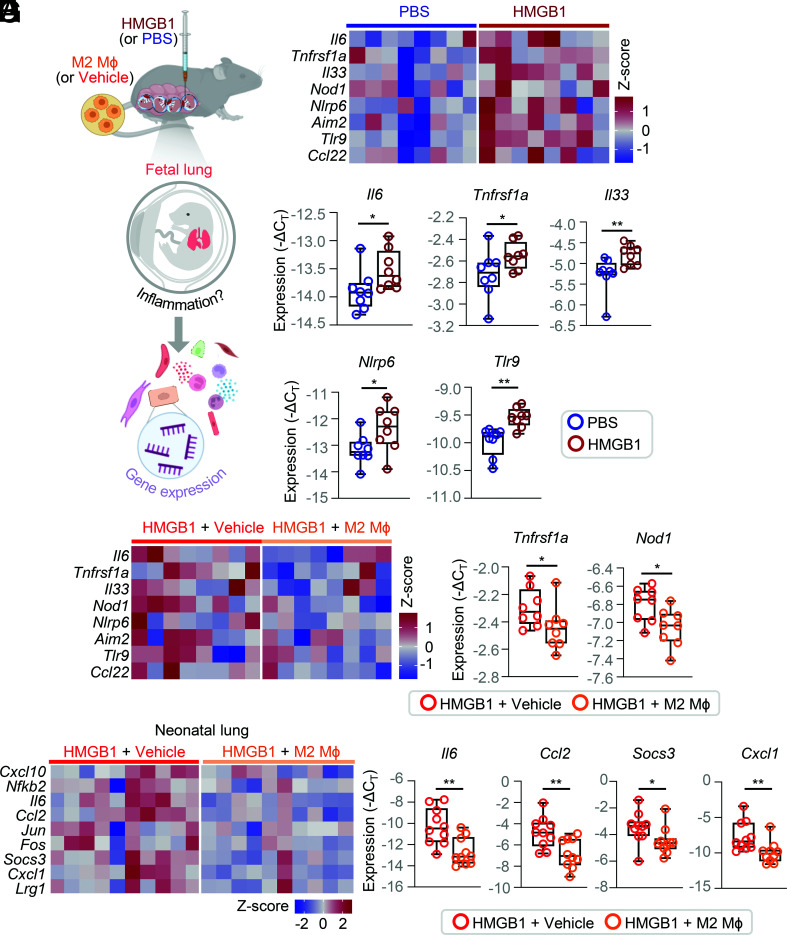
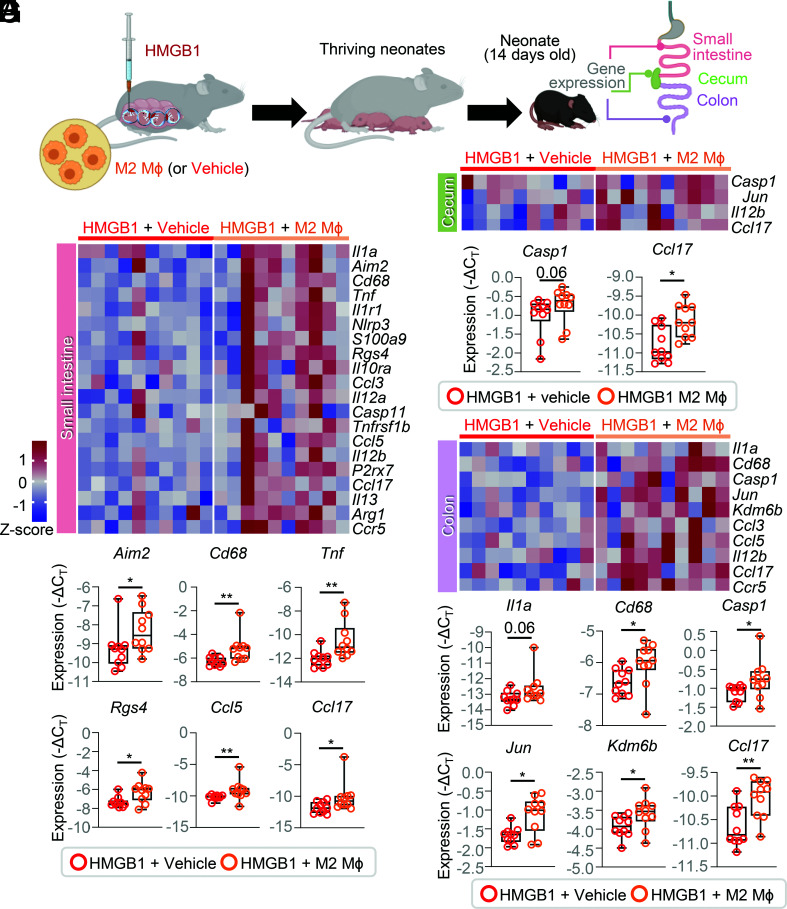
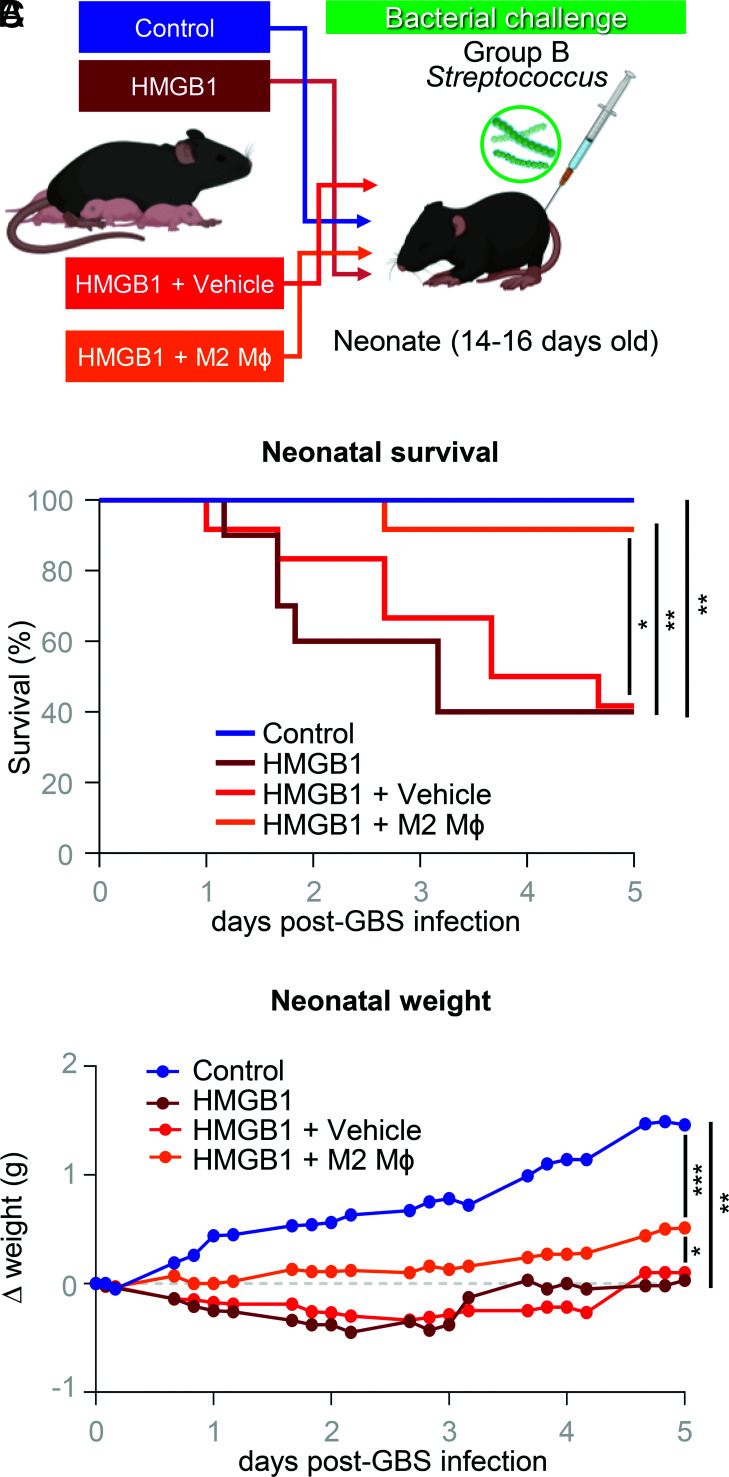
Preterm birth (PTB), often preceded by preterm labor, is a major cause of neonatal morbidity and mortality worldwide. Most PTB cases involve intra-amniotic inflammation without detectable microorganisms, termed in utero sterile inflammation, for which there is no established treatment. In this study, we propose homeostatic macrophages to prevent PTB and adverse neonatal outcomes caused by in utero sterile inflammation. Single-cell atlases of the maternal-fetal interface revealed that homeostatic maternal macrophages are reduced with human labor. M2 macrophage treatment prevented PTB and reduced adverse neonatal outcomes in mice with in utero sterile inflammation. Specifically, M2 macrophages halted premature labor by suppressing inflammatory responses in the amniotic cavity, including inflammasome activation, and mitigated placental and offspring lung inflammation. Moreover, M2 macrophages boosted gut inflammation in neonates and improved their ability to fight systemic bacterial infections. Our findings show that M2 macrophages are a promising strategy to mitigate PTB and improve neonatal outcomes resulting from in utero sterile inflammation.


Conflict of interest statement

The authors have no financial conflicts of interest.

Figures

FIGURE 1.
FIGURE 1.
Single-cell atlases of the human maternal–fetal interface reveal that maternal homeostatic macrophages are reduced with labor. (A) Representative diagram showing the placenta, extraplacental membranes, and myometrium, along with our working hypothesis that a reduction in homeostatic macrophages may accompany the processes of labor. (B) Uniform Manifold Approximation and Projection (UMAP) plots showing six distinct macrophage clusters (M1–M6) in (top row) the myometrium from women who delivered at term with (n = 11) or without (n = 13) labor, (middle row) the placenta (placental villi and basal plate) from women who delivered at term with (n = 27) or without (n = 21) labor or preterm after preterm labor (n = 3), and (bottom row) extraplacental membranes from women who delivered at term with (n = 27) or without (n = 21) labor or preterm after preterm labor (n = 3). (C) UMAP plots showing maternal (blue) or fetal (red) origin of all macrophage clusters in the (top to bottom) myometrium, placenta, and extraplacental membranes. (D) Plot showing the proportions of maternal M2 macrophages in the myometrium from women with term non-labor (TNL) or those with term labor (TIL). Data are shown as box-and-whisker plots where midlines indicate medians, boxes indicate interquartile ranges, and whiskers indicate minimum/maximum. The p values were determined using Mann-Whitney U tests. **p < 0.01. (E) Plot showing the proportions of maternal M2 macrophages in the basal plate from women with term in labor (TIL) or preterm labor (PTL). Data are shown as violin plots where midlines indicate medians, dotted lines indicate interquartile ranges, and endpoints represent the minimum/maximum. (F) STRING analysis showing the top 20 marker genes from the M2 cluster. (G) Overrepresentation analysis showing enriched Gene Ontology processes in the M2 cluster. Dot size corresponds to gene count and color scaling represents false discovery rate–adjusted p values (q < 0.05) as determined by a Fisher exact test.
FIGURE 2.
FIGURE 2.
M2 macrophages prevent preterm birth and neonatal mortality induced by in utero sterile inflammation. (A) To induce in utero sterile inflammation, the alarmin HMGB1 was intra-amniotically administered to C57BL/6 dams under ultrasound guidance on 14.5 d postcoitum (dpc). Bone marrow–derived cells were collected from C57BL/6 mice, differentiated, and polarized to an M2 phenotype (M2 macrophages [Mϕ]) in vitro. M2 Mϕ were administered i.v. to C57BL/6 dams on 13.5 and 14.5 dpc. Dams were monitored until delivery, and neonatal survival and weight were recorded until 3 wk of age. (B) Gestational length shown as box plots where midlines indicate medians and whiskers indicate minimum/maximum range. The p values were determined using the Kruskal–Wallis test followed by a two-stage linear step-up procedure of the Benjamini, Krieger, and Yekutieli post hoc test. (C) Rates of preterm birth among dams injected with PBS (n = 20), HMGB1 (n = 28), PBS + M2 Mϕ (n = 14), and HMGB1 + M2 Mϕ (n = 29) are shown as bar plots. The p values were determined using a two-sided Fisher exact test. (D) Pie charts representing the survival at birth of preterm neonates. PBS (n = 20 litters), HMGB1 (n = 20 litters), PBS + M2 Mϕ (n = 14 litters), and HMGB1 + M2 Mϕ (n = 16 litters). (E) Kaplan–Meier survival curves from neonates at weeks 1, 2, and 3 of life. PBS (n = 20 litters), HMGB1 (n = 20 litters), PBS + M2 Mϕ (n = 14 litters), and HMGB1 + M2 Mϕ (n = 16 litters). The p values were determined using the Gehan–Breslow–Wilcoxon test. (F) Individual weights (g) of neonates across the first 3 wk of life are shown as box plots where midlines indicate medians and whiskers indicate minimum/maximum range. PBS (n = 11 litters), HMGB1 (n = 11 litters), PBS + M2 Mϕ (n = 11 litters), and HMGB1 + M2 Mϕ (n = 14 litters). The p values were determined using the Kruskal–Wallis test followed by a Dunn post hoc test. *p < 0.05, **p < 0.01, ***p < 0.001.
FIGURE 3.
FIGURE 3.
M2 macrophages dampen HMGB1-induced in utero sterile inflammation, including inflammasome activation, in the amniotic cavity. (A) Dams were intra-amniotically injected with HMGB1 on 14.5 d postcoitum (dpc). Amniotic fluid was collected at 24, 48, 72, or 96 h after HMGB1 injection for cytokine determination. (B) Concentrations of IL-6, total IL-1β, and TNF in the amniotic fluid of HMGB1-injected dams at 24, 48, 72, and 96 h postinjection are shown as box plots (n = 6–8 dams per time point). The p values were determined using the Kruskal–Wallis test followed by a two-stage linear step-up procedure of the Benjamini, Krieger, and Yekutieli post hoc test. (C) M2 macrophages (Mϕ) or vehicle (PBS) were i.v. administered on 13.5 and 14.5 dpc to dams followed by ultrasound-guided intra-amniotic injection of HMGB1 on 14.5 dpc. Amniotic fluid was collected at 72 h after HMGB1 injection for cytokine determination. (D) Concentrations of IL-6, total IL-1β, and TNF in the amniotic fluid of the HMGB1 + vehicle dams (n = 16 dams) or HMGB1 + M2 Mϕ dams (n = 16 dams) at 72 h postinjection are shown as box plots. The p values were determined using the two-tailed Mann–Whitney U test. (E) To determine inflammasome activation, amniotic fluid of dams that received PBS, HMGB1, HMGB1 + vehicle, or HMGB1 + M2 Mϕ was collected at 72 h after HMGB1 injection for immunoblotting. (F) Immunoblotting of active caspase-1 (CASP-1) expression and mature IL-1β expression in the amniotic fluid of dams injected with PBS or HMGB1. Representative CASP-1 immunoblot image shows six samples per group, and representative mature IL-1β immunoblot image shows three pooled samples (pooled amniotic fluids from three dams) per group. (G) Protein quantification of active CASP-1 in the amniotic fluid of dams injected with PBS (n = 12) or HMGB1 (n = 13) and protein quantification of mature IL-1β in the pooled amniotic fluid of dams injected with PBS (n = 3) or HMGB1 (n = 3). (H) Immunoblotting of active CASP-1 expression and mature IL-1β expression in the amniotic fluid of HMGB1 + vehicle or HMGB1 + M2 Mϕ dams. Representative CASP-1 immunoblot image shows six samples per group, and representative mature IL-1β immunoblot image shows three pooled samples (pooled amniotic fluids from three dams) per group. (I) Protein quantification of active CASP-1 in the amniotic fluid of dams injected with HMGB1 + vehicle (n = 12) or HMGB1 + M2 Mϕ (n = 14). Protein quantification of mature IL-1β in the pooled amniotic fluid of dams injected with HMGB1 + vehicle (n = 3) or HMGB1 + M2 Mϕ (n = 3). For (G) and (I), data are shown as box plots where midlines indicate medians, boxes denote interquartile ranges, and whiskers indicate the minimum/maximum range. The p values were determined using the one-tailed Mann–Whitney U test. *p < 0.05, **p < 0.01, ***p < 0.001.
FIGURE 4.
FIGURE 4.
M2 macrophages inhibit inflammasome activation and regulate gene expression in the fetal membranes. (A) Dams received intra-amniotic injection of PBS (control) or HMGB1 on 14.5 d postcoitum (dpc). M2 macrophages (Mϕ) or vehicle (PBS) were i.v. administered to dams on 13.5 and 14.5 dpc followed by intra-amniotic injection of HMGB1 on 14.5 dpc. Tissue collection was performed at 72 h postinjection to collect the fetal membranes for immunoblotting and to determine gene expression. (B) Immunoblotting of active caspase (CASP)-1, mature IL-1β, and β-actin (ACTB) in the fetal membranes of PBS- or HMGB1-injected dams. Representative immunoblot images depict six samples per group in each gel. (C) Protein quantification of active CASP-1 and mature IL-1β (both normalized by ACTB) in the fetal membranes of PBS- or HMGB1-injected dams (n = 6 per group). (D) Immunoblotting of active CASP-1, mature IL-1β, and ACTB in the fetal membranes from HMGB1 + vehicle or HMGB1 + M2 Mϕ dams. Representative immunoblot images depict six samples per group in each gel. (E) Relative quantification of active CASP-1 and mature IL-1β (both normalized by ACTB) in the fetal membranes of HMGB1 + vehicle or HMGB1 + M2 Mϕ dams (n = 6 per group). (F) Representative heatmaps displaying the expression of key inflammatory genes in the fetal membranes of PBS-injected (n = 8) or HMGB1-injected (n = 8) dams. (G) Expression of Ccl17 in the fetal membranes of PBS- or HMGB1-injected dams. (H) Representative heatmaps displaying the expression of key inflammatory genes in the fetal membranes of HMGB1 + vehicle (n = 8) or HMGB1 + M2 Mϕ (n = 8) dams. (I) Expression of Tlr4, Cxcl1, Tnf, and Il1b in the fetal membranes of HMGB1 + vehicle or HMGB1 + M2 Mϕ dams. For (C), (E), (G), and (I), data are shown as box plots where midlines indicate medians, boxes denote interquartile ranges, and whiskers indicate the minimum/maximum range. The p values were determined using the two-tailed Mann–Whitney U test. *p < 0.05, **p < 0.01.
FIGURE 5.
FIGURE 5.
M2 macrophages dampen inflammatory gene expression in the decidua and placenta. (A and B) Representative heatmaps displaying the expression of key inflammatory genes in the decidua of (A) PBS- or HMGB1-injected dams and (B) HMGB1 + vehicle or HMGB1 + M2 macrophage (Mϕ) dams (n = 8 per group). Expression of Fos, Jun, Il6, Casp11, Il12a, Nod1, Tnf, Nod2, Il18, P2rx7, and Nfkb2 is shown. (C and D) Representative heatmaps displaying the expression of key labor-associated genes in the placentas of (C) PBS- or HMGB1-injected dams and (D) HMGB1 + vehicle or HMGB1 + M2 Mϕ dams (n = 8 per group). Expression of Tlr4, Gja1, and Ptgs2 in the placenta of PBS- or HMGB1-injected dams and of Ccl17 and Nfkb2 in the placenta of HMGB1 + vehicle or HMGB1 + M2 Mϕ dams is shown. Data are shown as box plots where midlines indicate medians, boxes denote interquartile ranges, and whiskers indicate the minimum/maximum range.The p values were determined using the two-tailed Mann–Whitney U test. *p < 0.05, **p < 0.01.
FIGURE 6.
FIGURE 6.
Adoptively transferred M2 macrophages accumulate at the maternal–fetal interface but do not reach fetal organs. (A) Bone marrow–derived cells were collected from donor CD45.1+ mice, differentiated, and polarized to M2 macrophages (Mϕ) in vitro. Donor M2 Mϕ were i.v. administered on 13.5 and 14.5 d postcoitum (dpc) to recipient CD45.2+ dams followed by intra-amniotic injection of HMGB1 on 14.5 dpc. Maternal and fetal tissues were collected at 2, 6, or 12 h after HMGB1 injection (n = 2–3 dams per time point) to track donor M2 Mϕ infiltration. (B) Representative flow cytometry gating strategy to detect viable CD45.1+CD45.2 donor Mϕ in maternal and fetal tissues. (C) Quantification of CD45.1+CD45.2 donor Mϕ in the maternal blood (M. blood), maternal lung (M. lung), uterus, and decidua from recipient dams at 2, 6, and 12 h after HMGB1 injection. (D) Quantification of CD45.1+CD45.2 donor Mϕ in the placenta, fetal membranes (F. membranes), amniotic fluid, fetal intestine, fetal lung, and fetal liver from recipient dams at 2, 6, and 12 h after HMGB1 injection. Data are presented as violin plots where the midline represents the median, dotted lines represent the interquartile range, and whiskers represent the minimum/maximum range. Statistical analysis was performed by using the Kruskal–Wallis test followed by a Dunn post hoc test. *p < 0.05.
FIGURE 7.
FIGURE 7.
M2 macrophages ameliorate fetal and neonatal lung inflammation induced by in utero sterile inflammation. (A) Dams received intra-amniotic injection of PBS (control) or HMGB1 on 14.5 d postcoitum (dpc). M2 macrophages (Mϕ) or vehicle (PBS) were i.v. administered to dams on 13.5 and 14.5 dpc followed by intra-amniotic injection of HMGB1 on 14.5 dpc. Tissue collection was performed at 72 h postinjection to collect the fetal lung for gene expression. (B) Representative heatmaps displaying the expression of inflammatory genes in the fetal lung of PBS-injected (n = 8) or HMGB1-injected (n = 8) dams. (C) Expression of Il6, Tnfrsf1a, Il33, Nlrp6, and Tlr9 in the fetal lung of PBS- or HMGB1-injected dams. (D) Representative heatmaps displaying the expression of inflammatory genes in the fetal lung of HMGB1 + vehicle (n = 8) or HMGB1 + M2 Mϕ (n = 8) dams. (E) Expression of Tnfrsf1a and Nod1 in the fetal lung of HMGB1 + vehicle or HMGB1 + M2 Mϕ dams. (F) The lung was collected at 14–16 d of life from neonates born mostly at term to HMGB1 + vehicle or HMGB1 + M2 Mϕ dams to evaluate gene expression as shown in the representative heatmap. (G) Expression of Il6, Ccl2, Socs3, and Cxcl1 in the neonatal lung (n = 10 per group). For (C), (E), and (G), data are shown as box plots where midlines indicate medians, boxes denote interquartile ranges, and whiskers indicate the minimum/maximum range. The p values were determined using the two-tailed Mann–Whitney U test. *p < 0.05, **p < 0.01.
FIGURE 8.
FIGURE 8.
M2 macrophages regulate neonatal gut inflammation resulting from in utero sterile inflammation. (A) M2 macrophages (Mϕ) or PBS (vehicle) were i.v. administered to dams on 13.5 and 14.5 d postcoitum (dpc) followed by intra-amniotic injection of HMGB1 on 14.5 dpc. After delivery, neonates (born mostly at term) were monitored until 14–16 d of age, after which the small intestine, cecum, and colon were collected to determine gene expression. Representative heatmaps display gene expression in the (B) neonatal small intestine, (D) cecum, and (F) colon of neonates born to HMGB1 + vehicle (n = 10 neonates) or HMGB1 + M2 Mϕ (n = 10 neonates) dams. The expression of specific genes in the (C) neonatal small intestine (Aim2, Cd68, Tnf, Rgs4, Ccl5, Ccl17), (E) cecum (Casp1 and Ccl17), and (G) colon (Il1a, Cd68, Casp1, Jun, Kdm6b, Ccl17) are shown as box plots. The p values were determined using the two-tailed Mann–Whitney U test. Data are shown as box plots where midlines indicate medians, boxes denote interquartile ranges, and whiskers indicate the minimum/maximum range. *p < 0.05, **p < 0.01.
FIGURE 9.
FIGURE 9.
M2 macrophages enhance neonatal ability to combat systemic infection. (A) M2 macrophages (Mϕ) or PBS (vehicle) were i.v. administered to dams on 13.5 and 14.5 d postcoitum (dpc) followed by intra-amniotic injection of HMGB1 on 14.5 dpc. Pregnant dams without any treatment or injected with HMGB1 alone were also included. After delivery, surviving neonates (mostly delivered at term) were monitored until 14–16 d of age, after which they received i.p. injection of group B Streptococcus (GBS) and were observed for 5 d. (B) The survival rates of GBS-infected neonates born to untreated (n = 10 neonates), HMGB1 injected (n = 10 neonates), HMGB1 + vehicle (n = 12 neonates), or HMGB1 + M2 Mϕ (n = 12 neonates) dams over the 5 d postchallenge are displayed as Kaplan–Meier survival curves. The p values were determined using the Gehan–Breslow–Wilcoxon test. (C) Mean weights of GBS-infected neonates over the 5 d postchallenge. The p values for comparing the mean weight at the end of day 5 (final data point in plot) were determined using the two-tailed Mann–Whitney U test. *p < 0.05, **p < 0.01, ***p < 0.001.

Similar articles

Cited by

References

    1. Liu, L., Oza S., Hogan D., Perin J., Rudan I., Lawn J. E., Cousens S., Mathers C., Black R. E.. 2015. Global, regional, and national causes of child mortality in 2000–13, with projections to inform post-2015 priorities: an updated systematic analysis. Lancet 385: 430–440. - PubMed
    1. Guo, X., Li X., Qi T., Pan Z., Zhu X., Wang H., Dong Y., Yue H., Sun B.. 2021. A birth population-based survey of preterm morbidity and mortality by gestational age. BMC Pregnancy Childbirth 21: 291. - PMC - PubMed
    1. Romero, R., Dey S. K., Fisher S. J.. 2014. Preterm labor: one syndrome, many causes. Science 345: 760–765. - PMC - PubMed
    1. Goldenberg, R. L., Culhane J. F., Iams J. D., Romero R.. 2008. Epidemiology and causes of preterm birth. Lancet 371: 75–84. - PMC - PubMed
    1. Bastek, J. A., Gomez L. M., Elovitz M. A.. 2011. The role of inflammation and infection in preterm birth. Clin. Perinatol. 38: 385–406. - PubMed

LinkOut - more resources