. 2024 Oct;132(10):107007.
doi: 10.1289/EHP13956. Epub 2024 Oct 21.

Trends in NHANES Biomonitored Exposures in California and the United States following Enactment of California's Proposition 65

Affiliations

Trends in NHANES Biomonitored Exposures in California and the United States following Enactment of California's Proposition 65

Kristin E Knox et al. Environ Health Perspect. 2024 Oct.

Abstract

Background: The prevalence of toxic chemicals in US commerce has prompted some states to adopt laws to reduce exposure. One with broad reach is California's Proposition 65 (Prop 65), which established a list of chemicals that cause cancer, developmental harm, or reproductive toxicity. The law is intended to discourage businesses from using these chemicals and to minimize consumer exposure. However, a key question remains unanswered: Has Prop 65 reduced population-level exposure to the listed chemicals?

Objective: We used national biomonitoring data from the Centers for Disease Control and Prevention (CDC) to evaluate the impact of Prop 65 on population-level exposures.

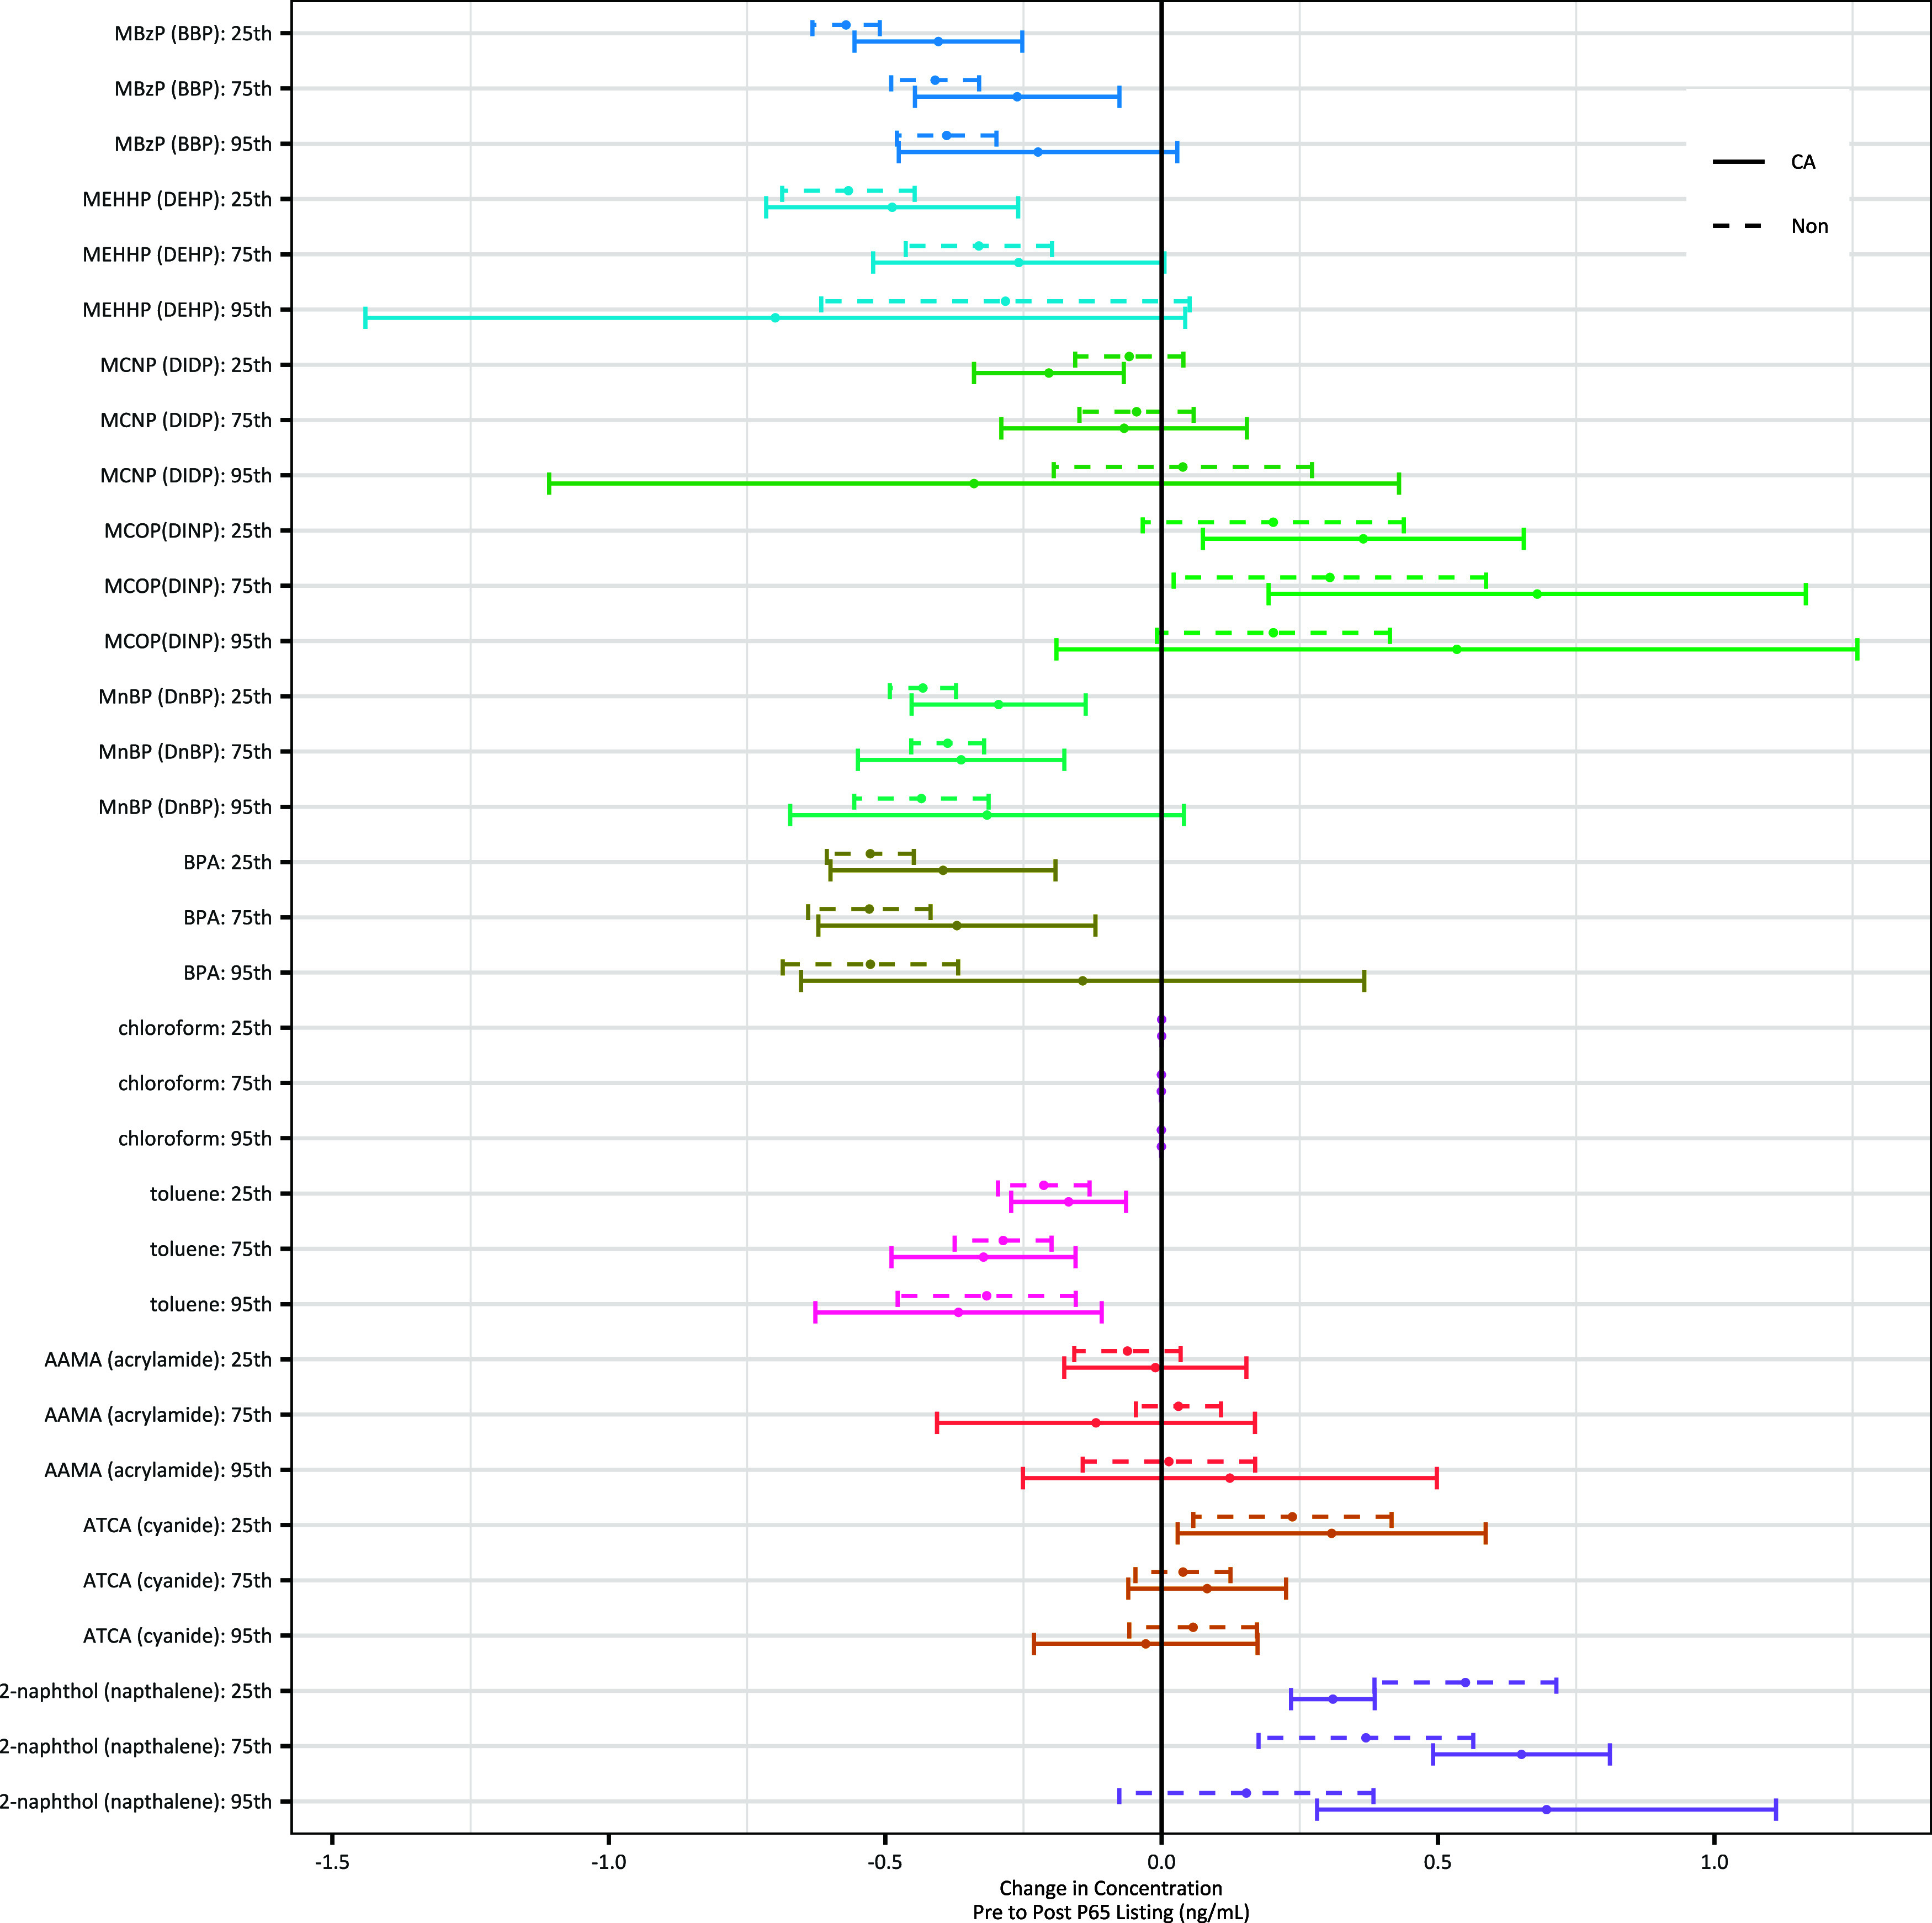
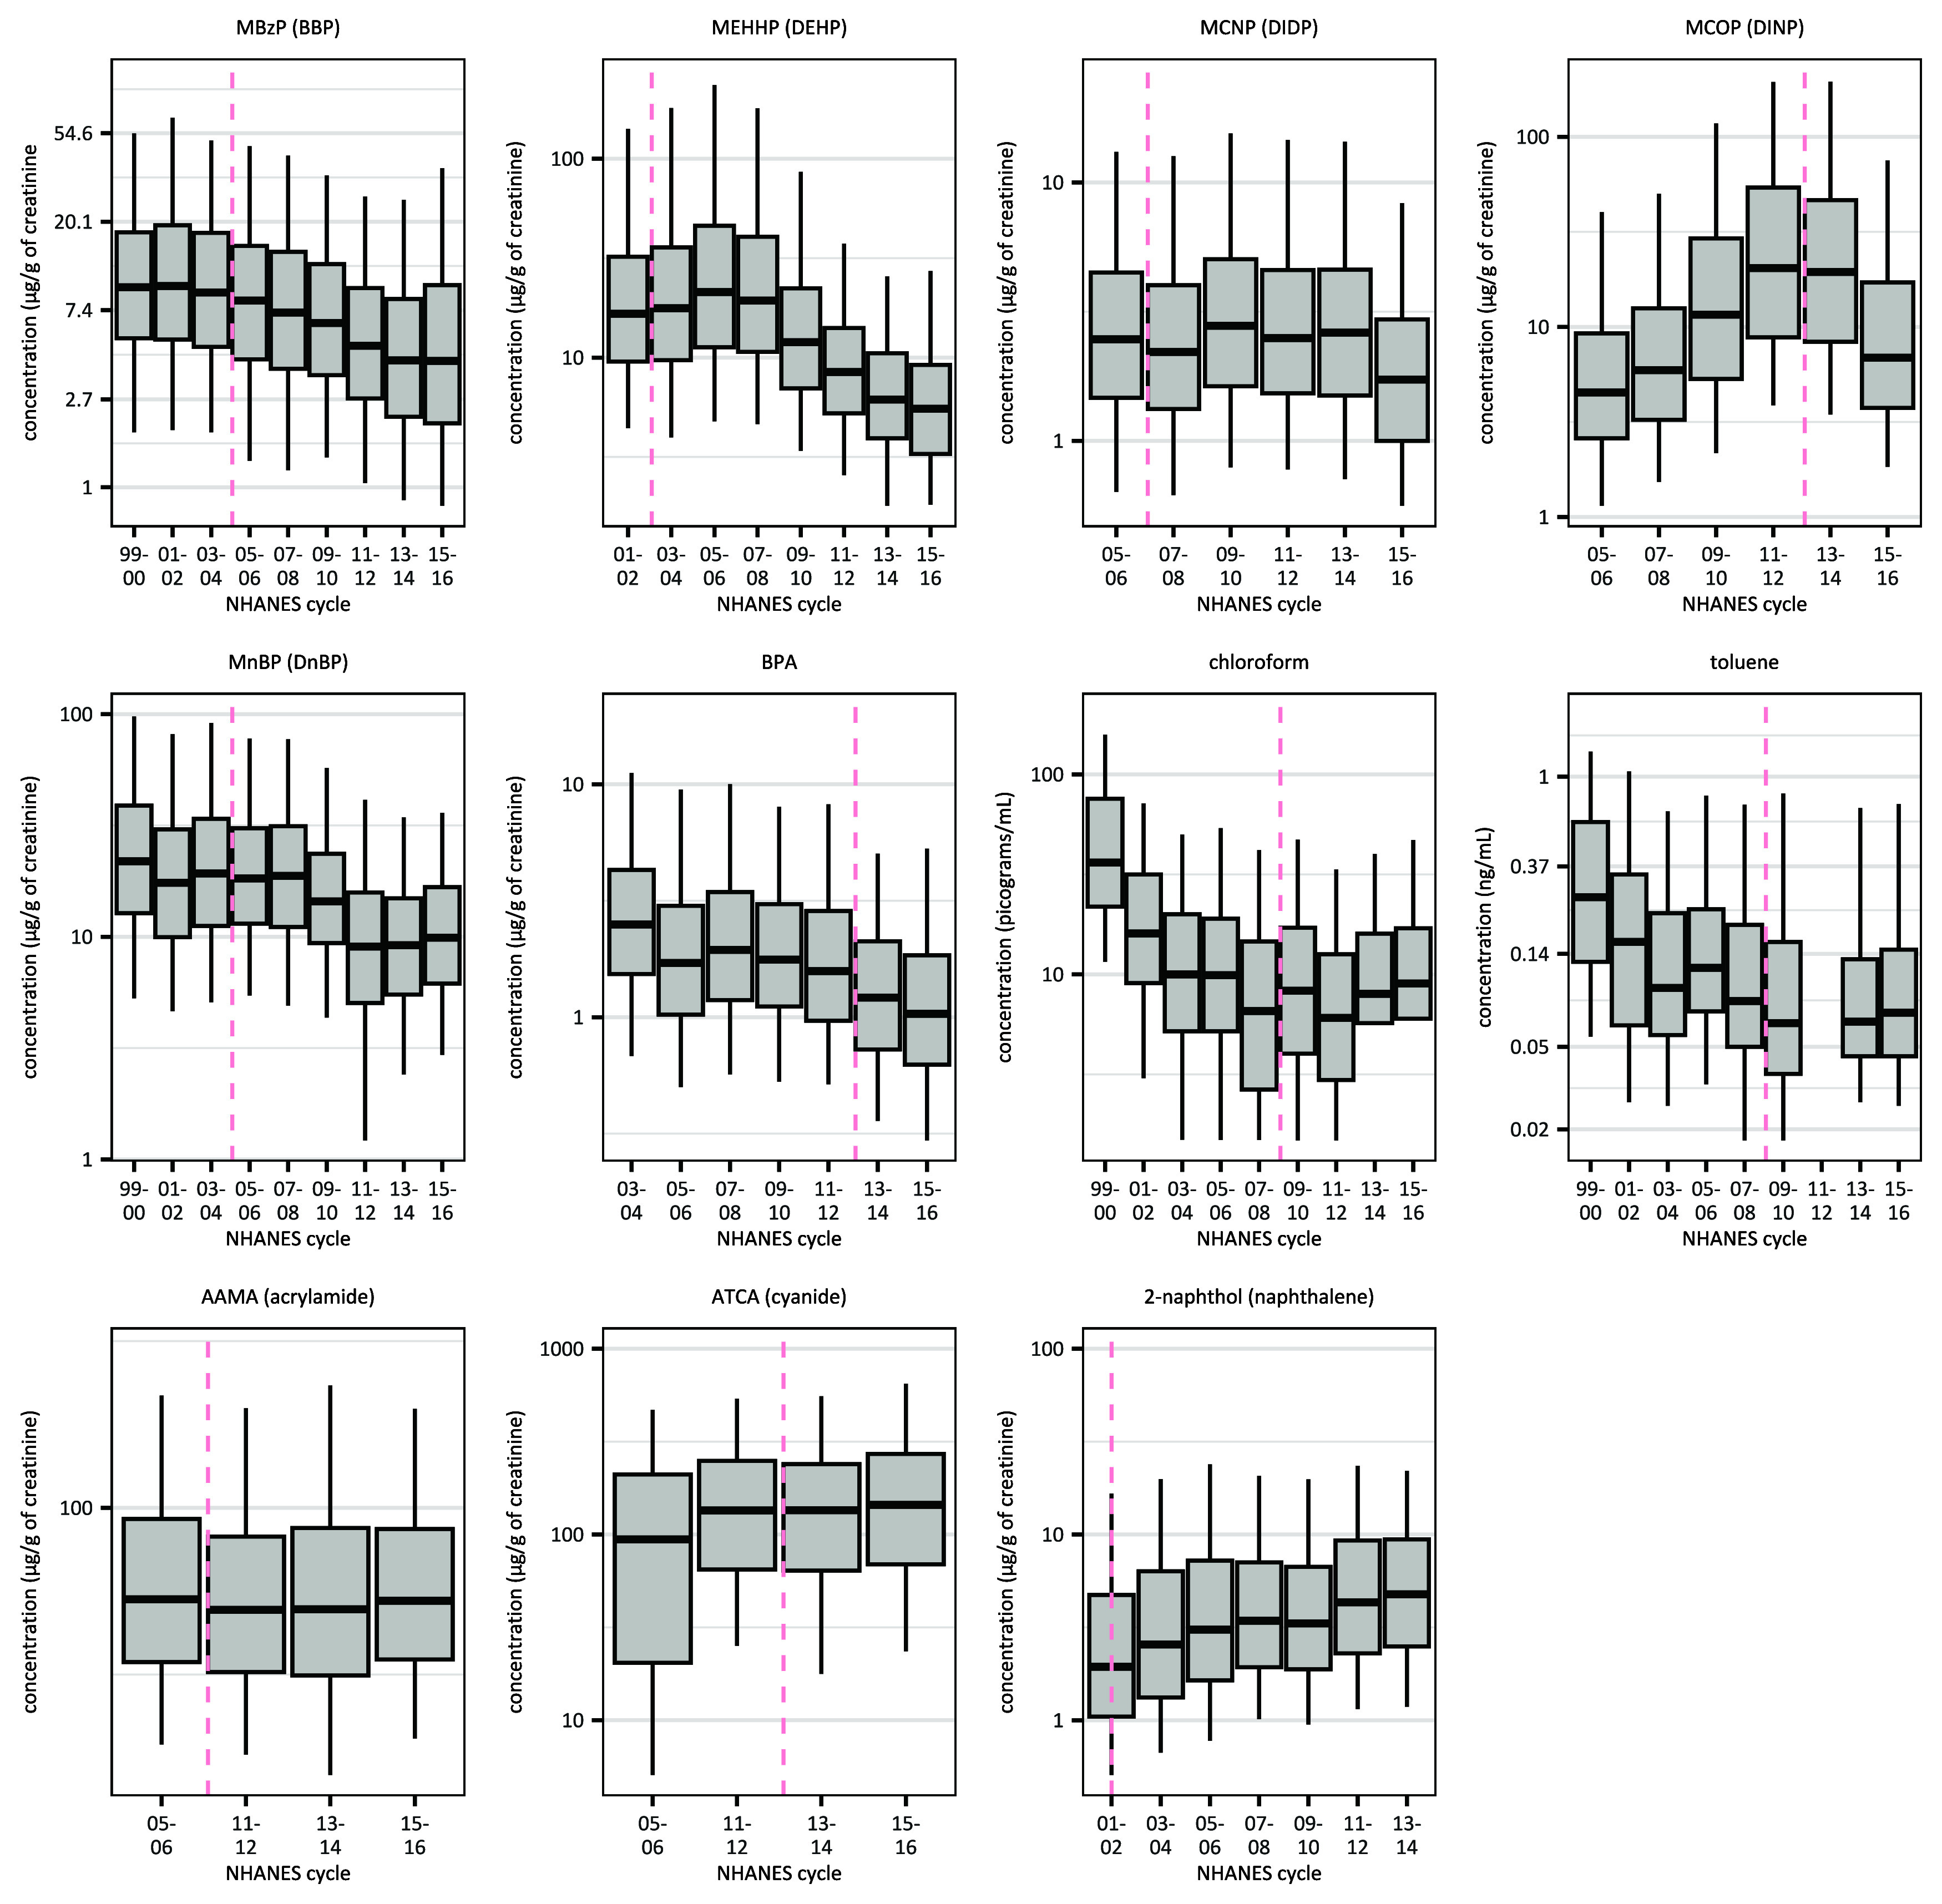
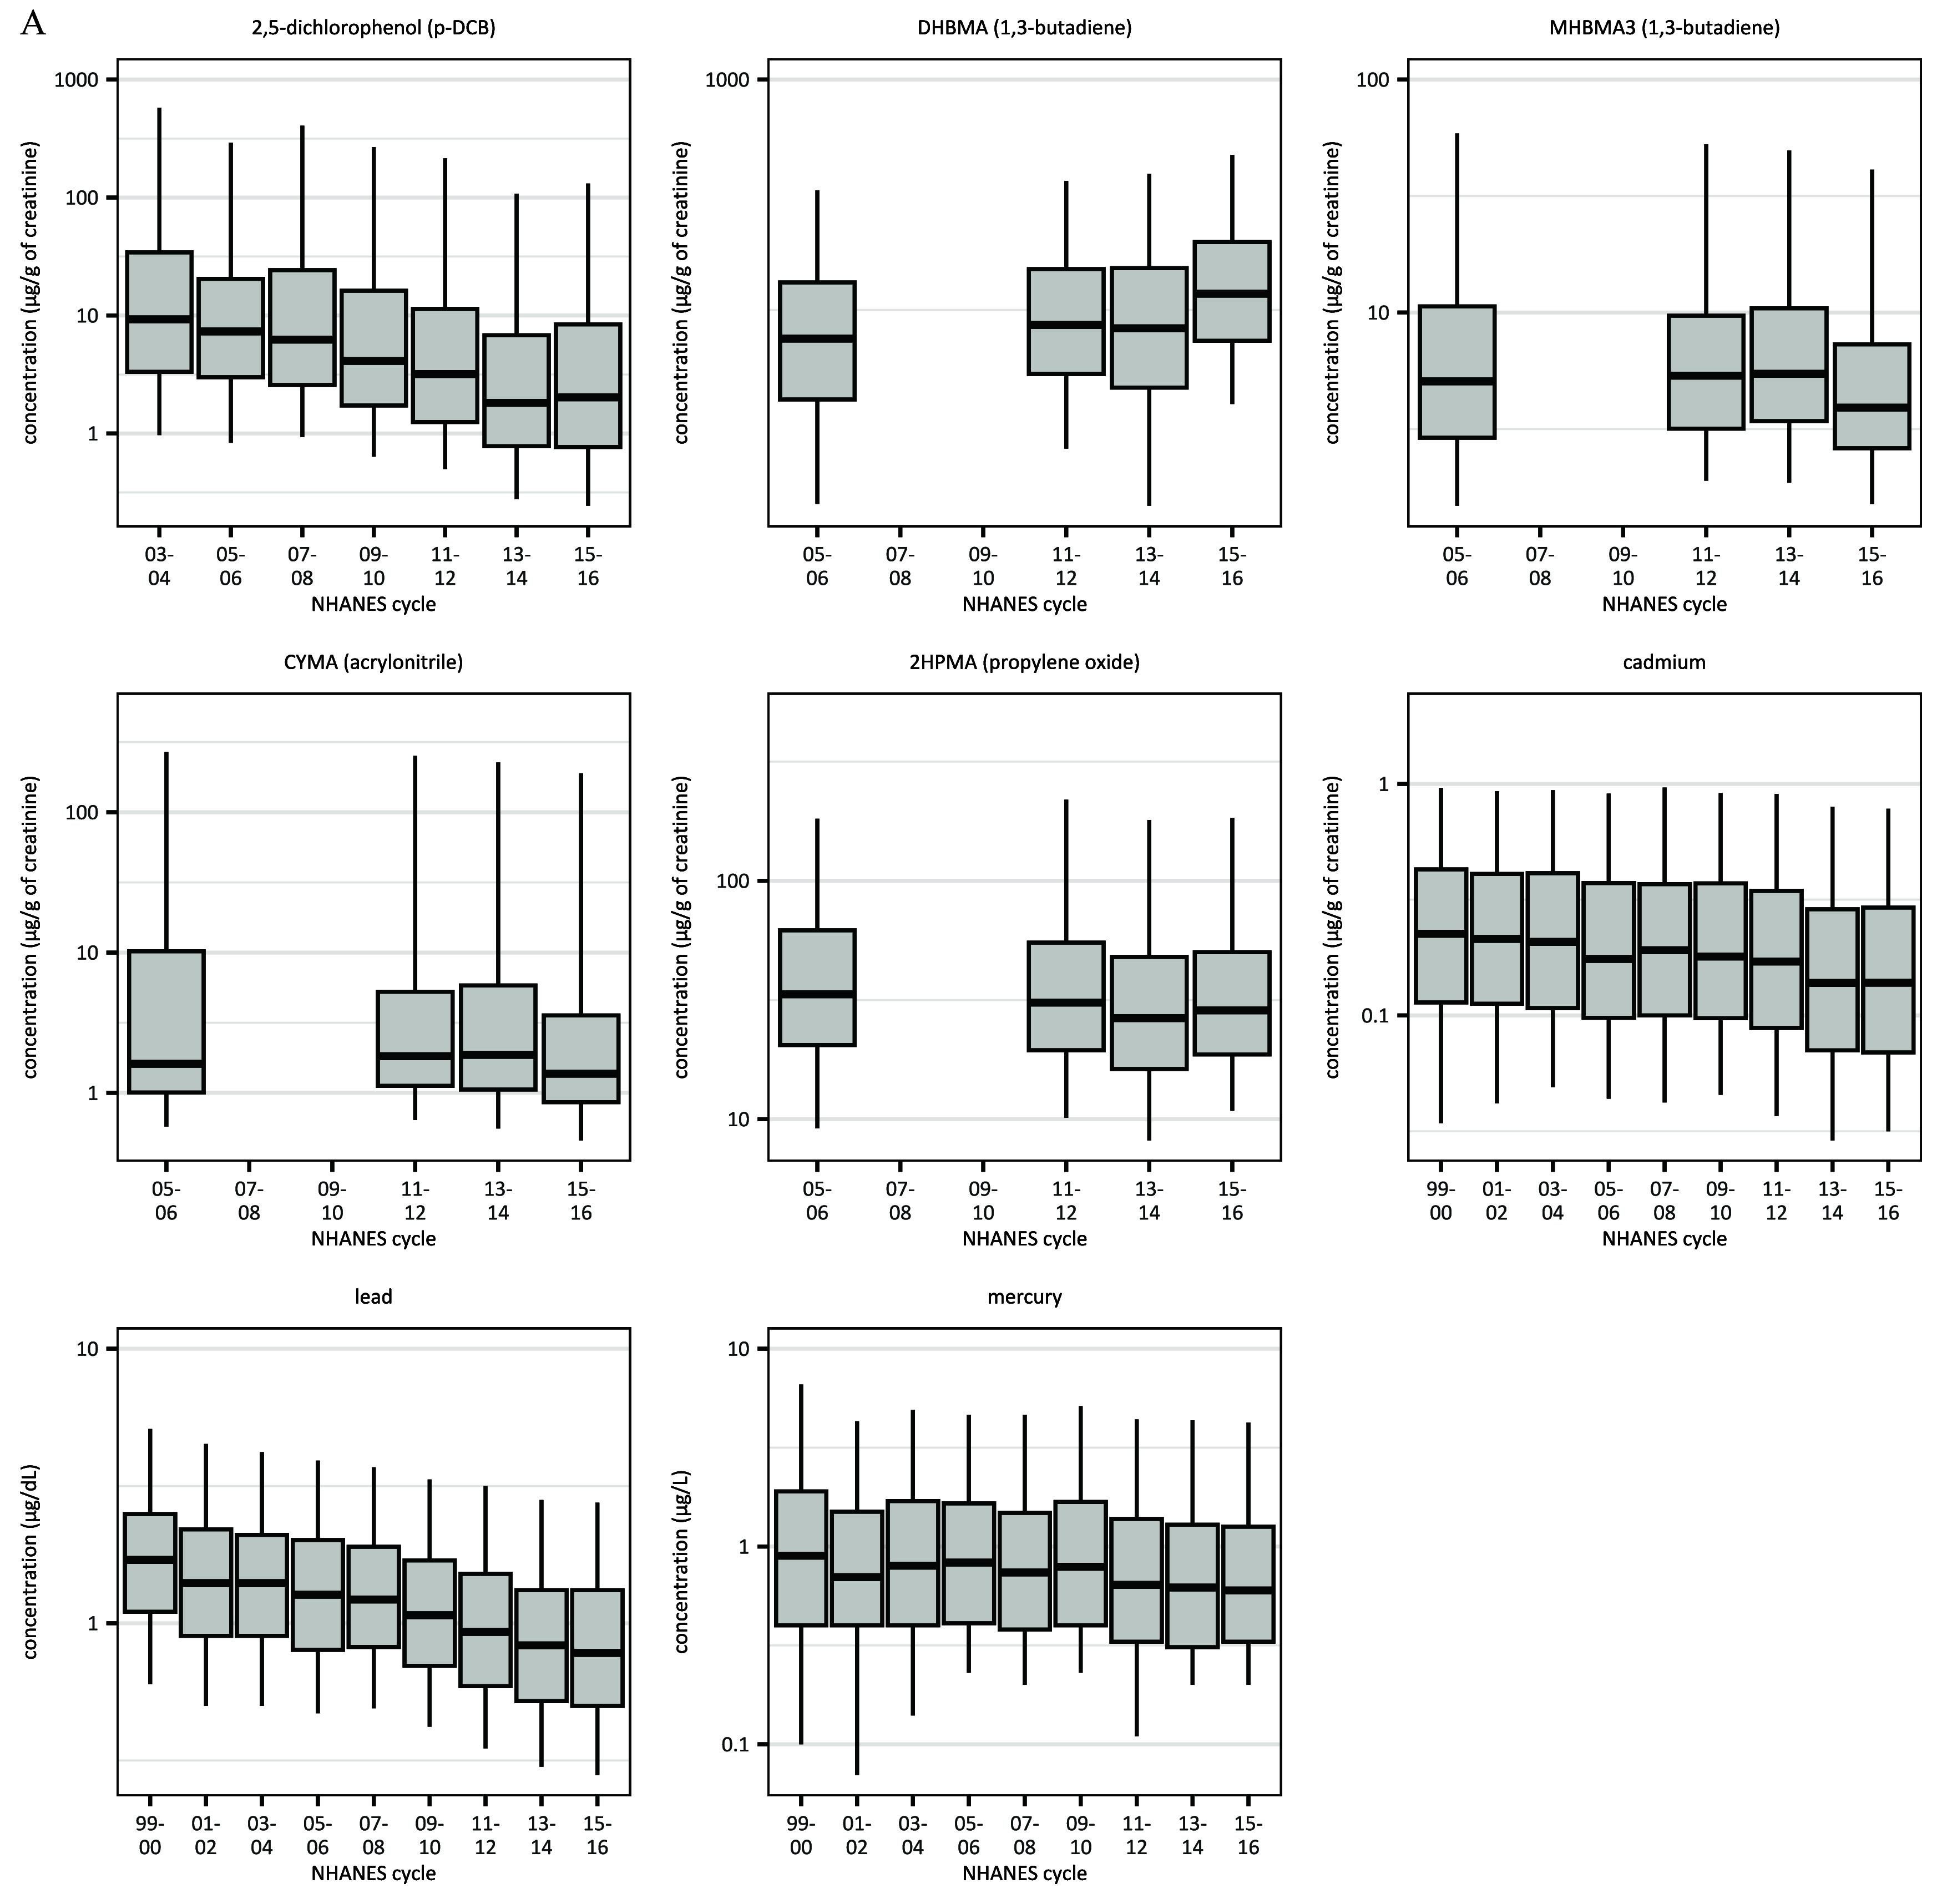
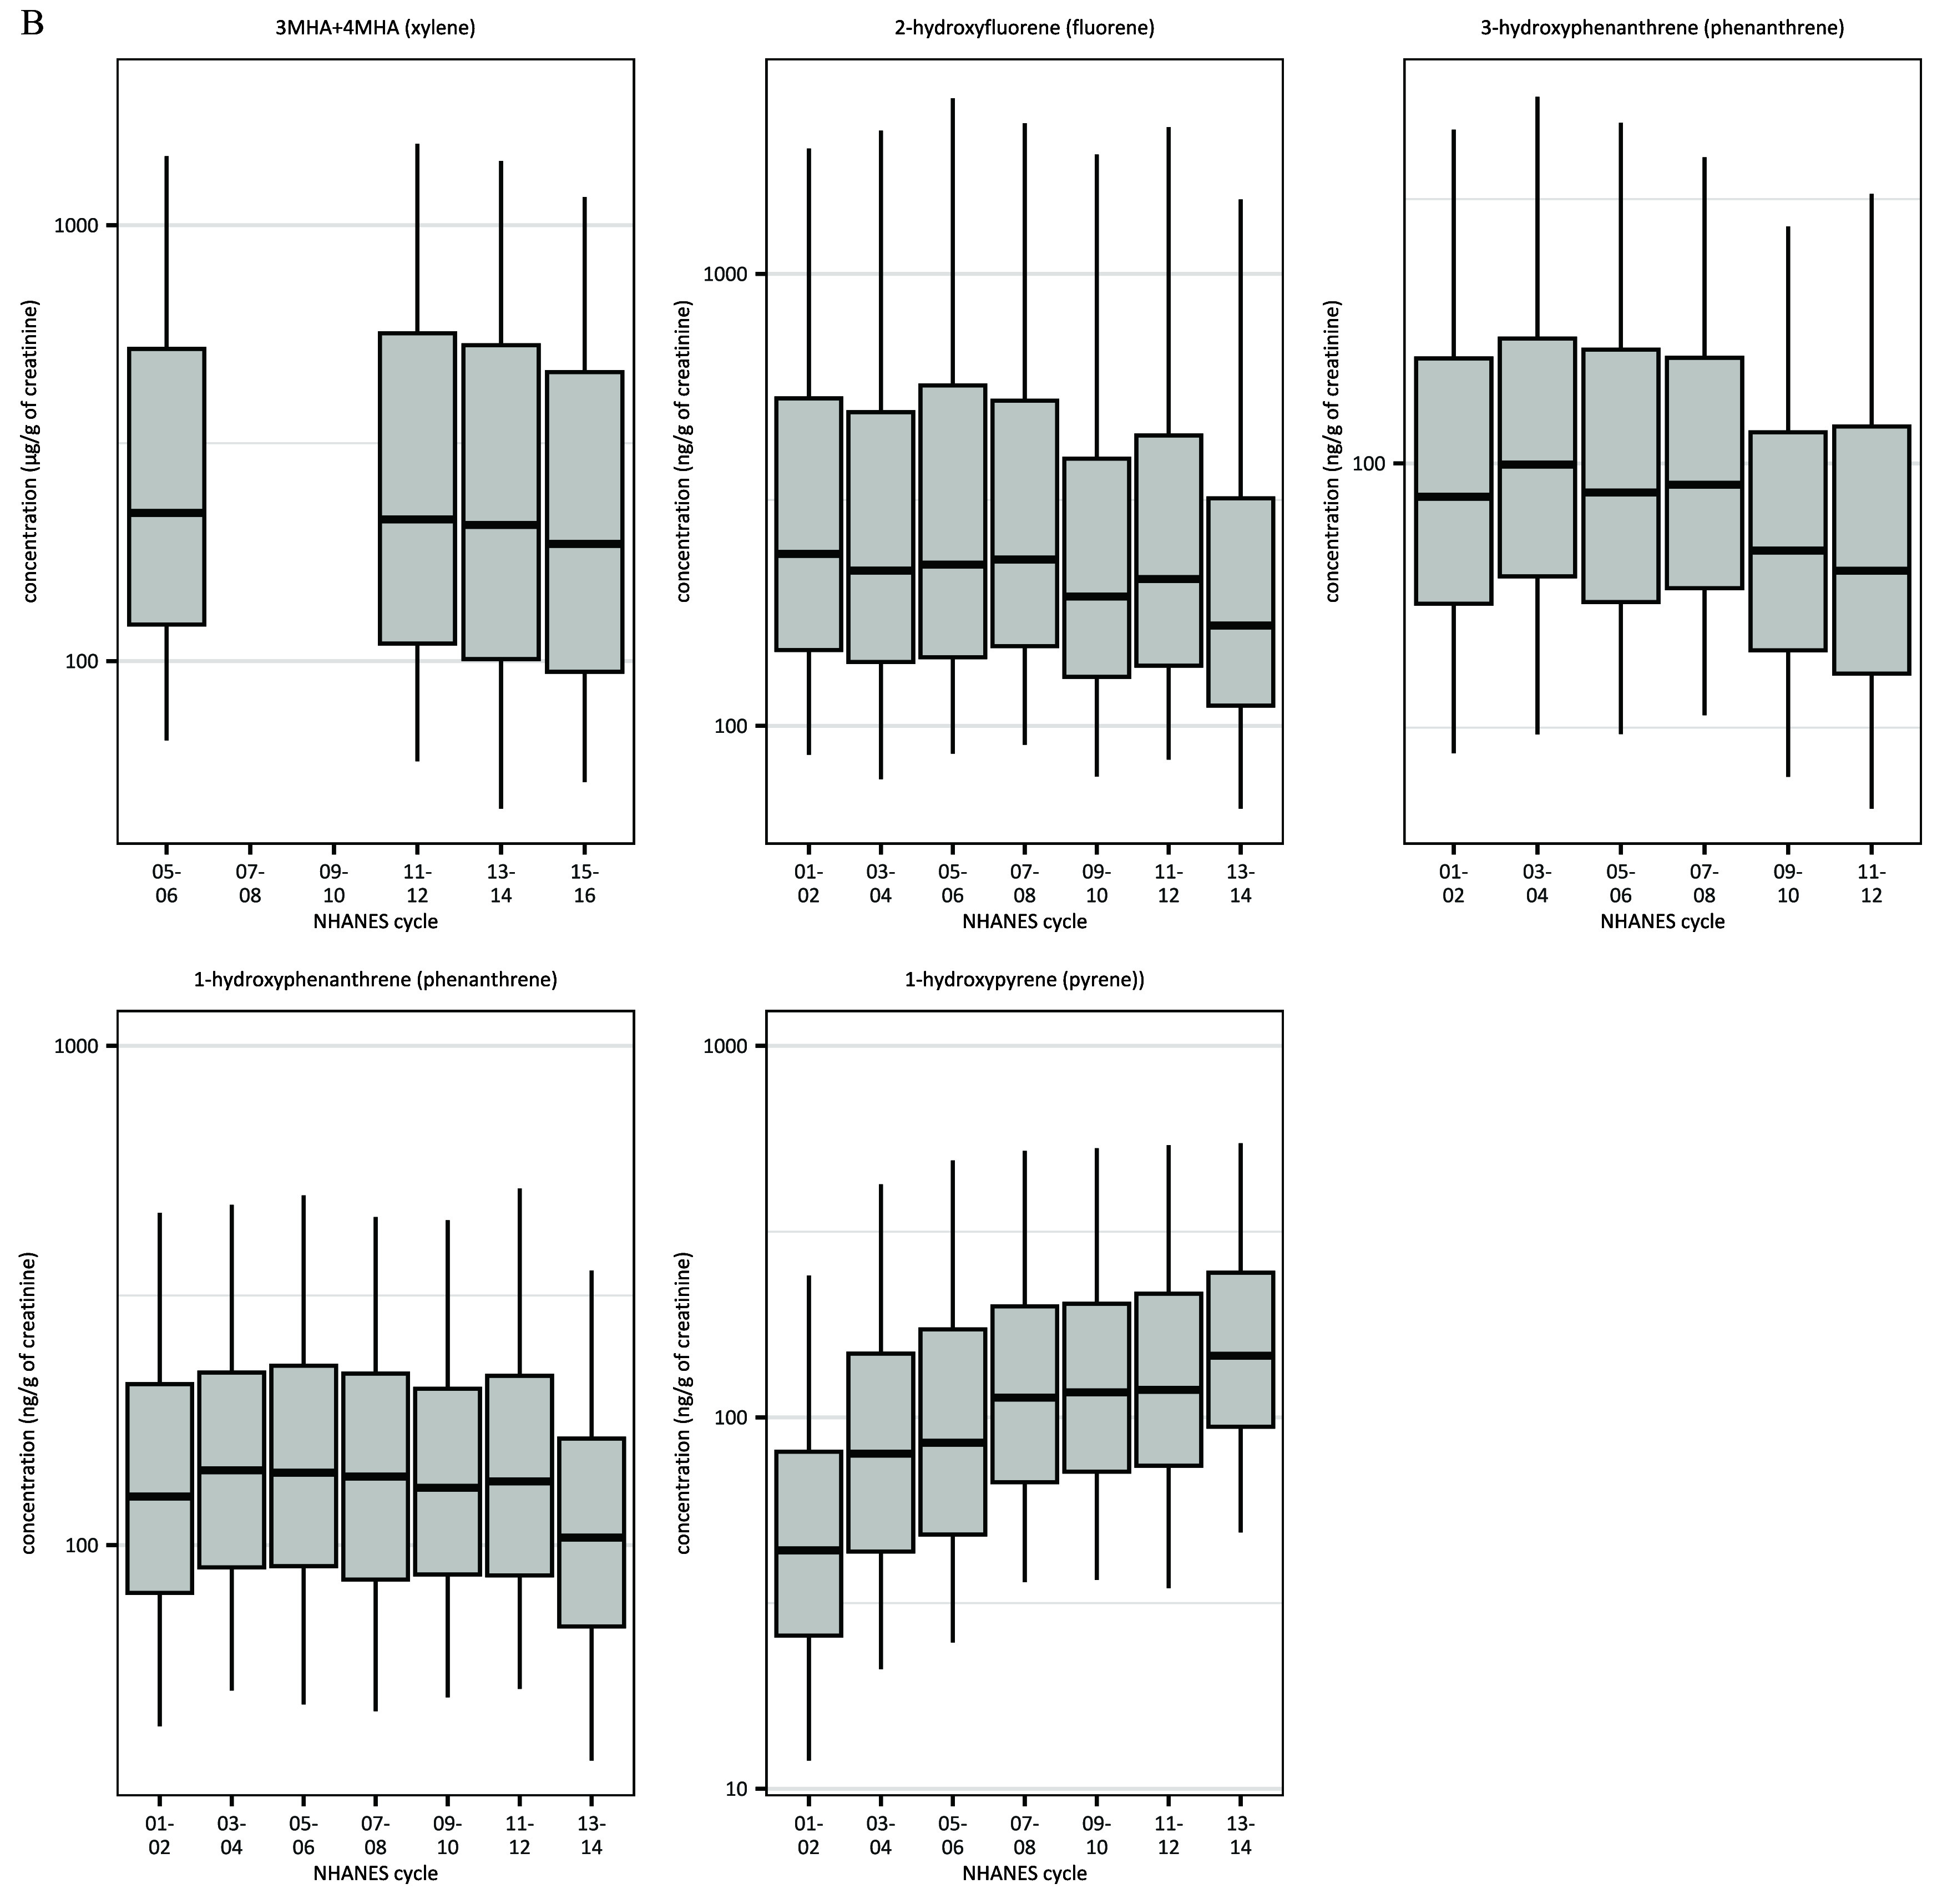
Methods: We evaluated changes in blood and urine concentrations of 37 chemicals (including phthalates, phenols, VOCs, metals, PAHs, and PFAS), among US National Health and Nutrition Examination Survey (NHANES) participants in relation to the time of chemicals' Prop 65 listing. Of these, 11 were listed prior to, 11 during, and 4 after the biomonitoring period. The remaining 11 were not listed but were closely related to a Prop 65-listed chemical. Where biomonitoring data were available from before and after the date of Prop 65 listing, we estimated the change in concentrations over time for Californians compared with non-Californians, using a difference-in-differences model. We used quantile regression to estimate changes in exposure over time, as well as differences between Californians and non-Californians at the 25th, 75th, and 95th percentiles.

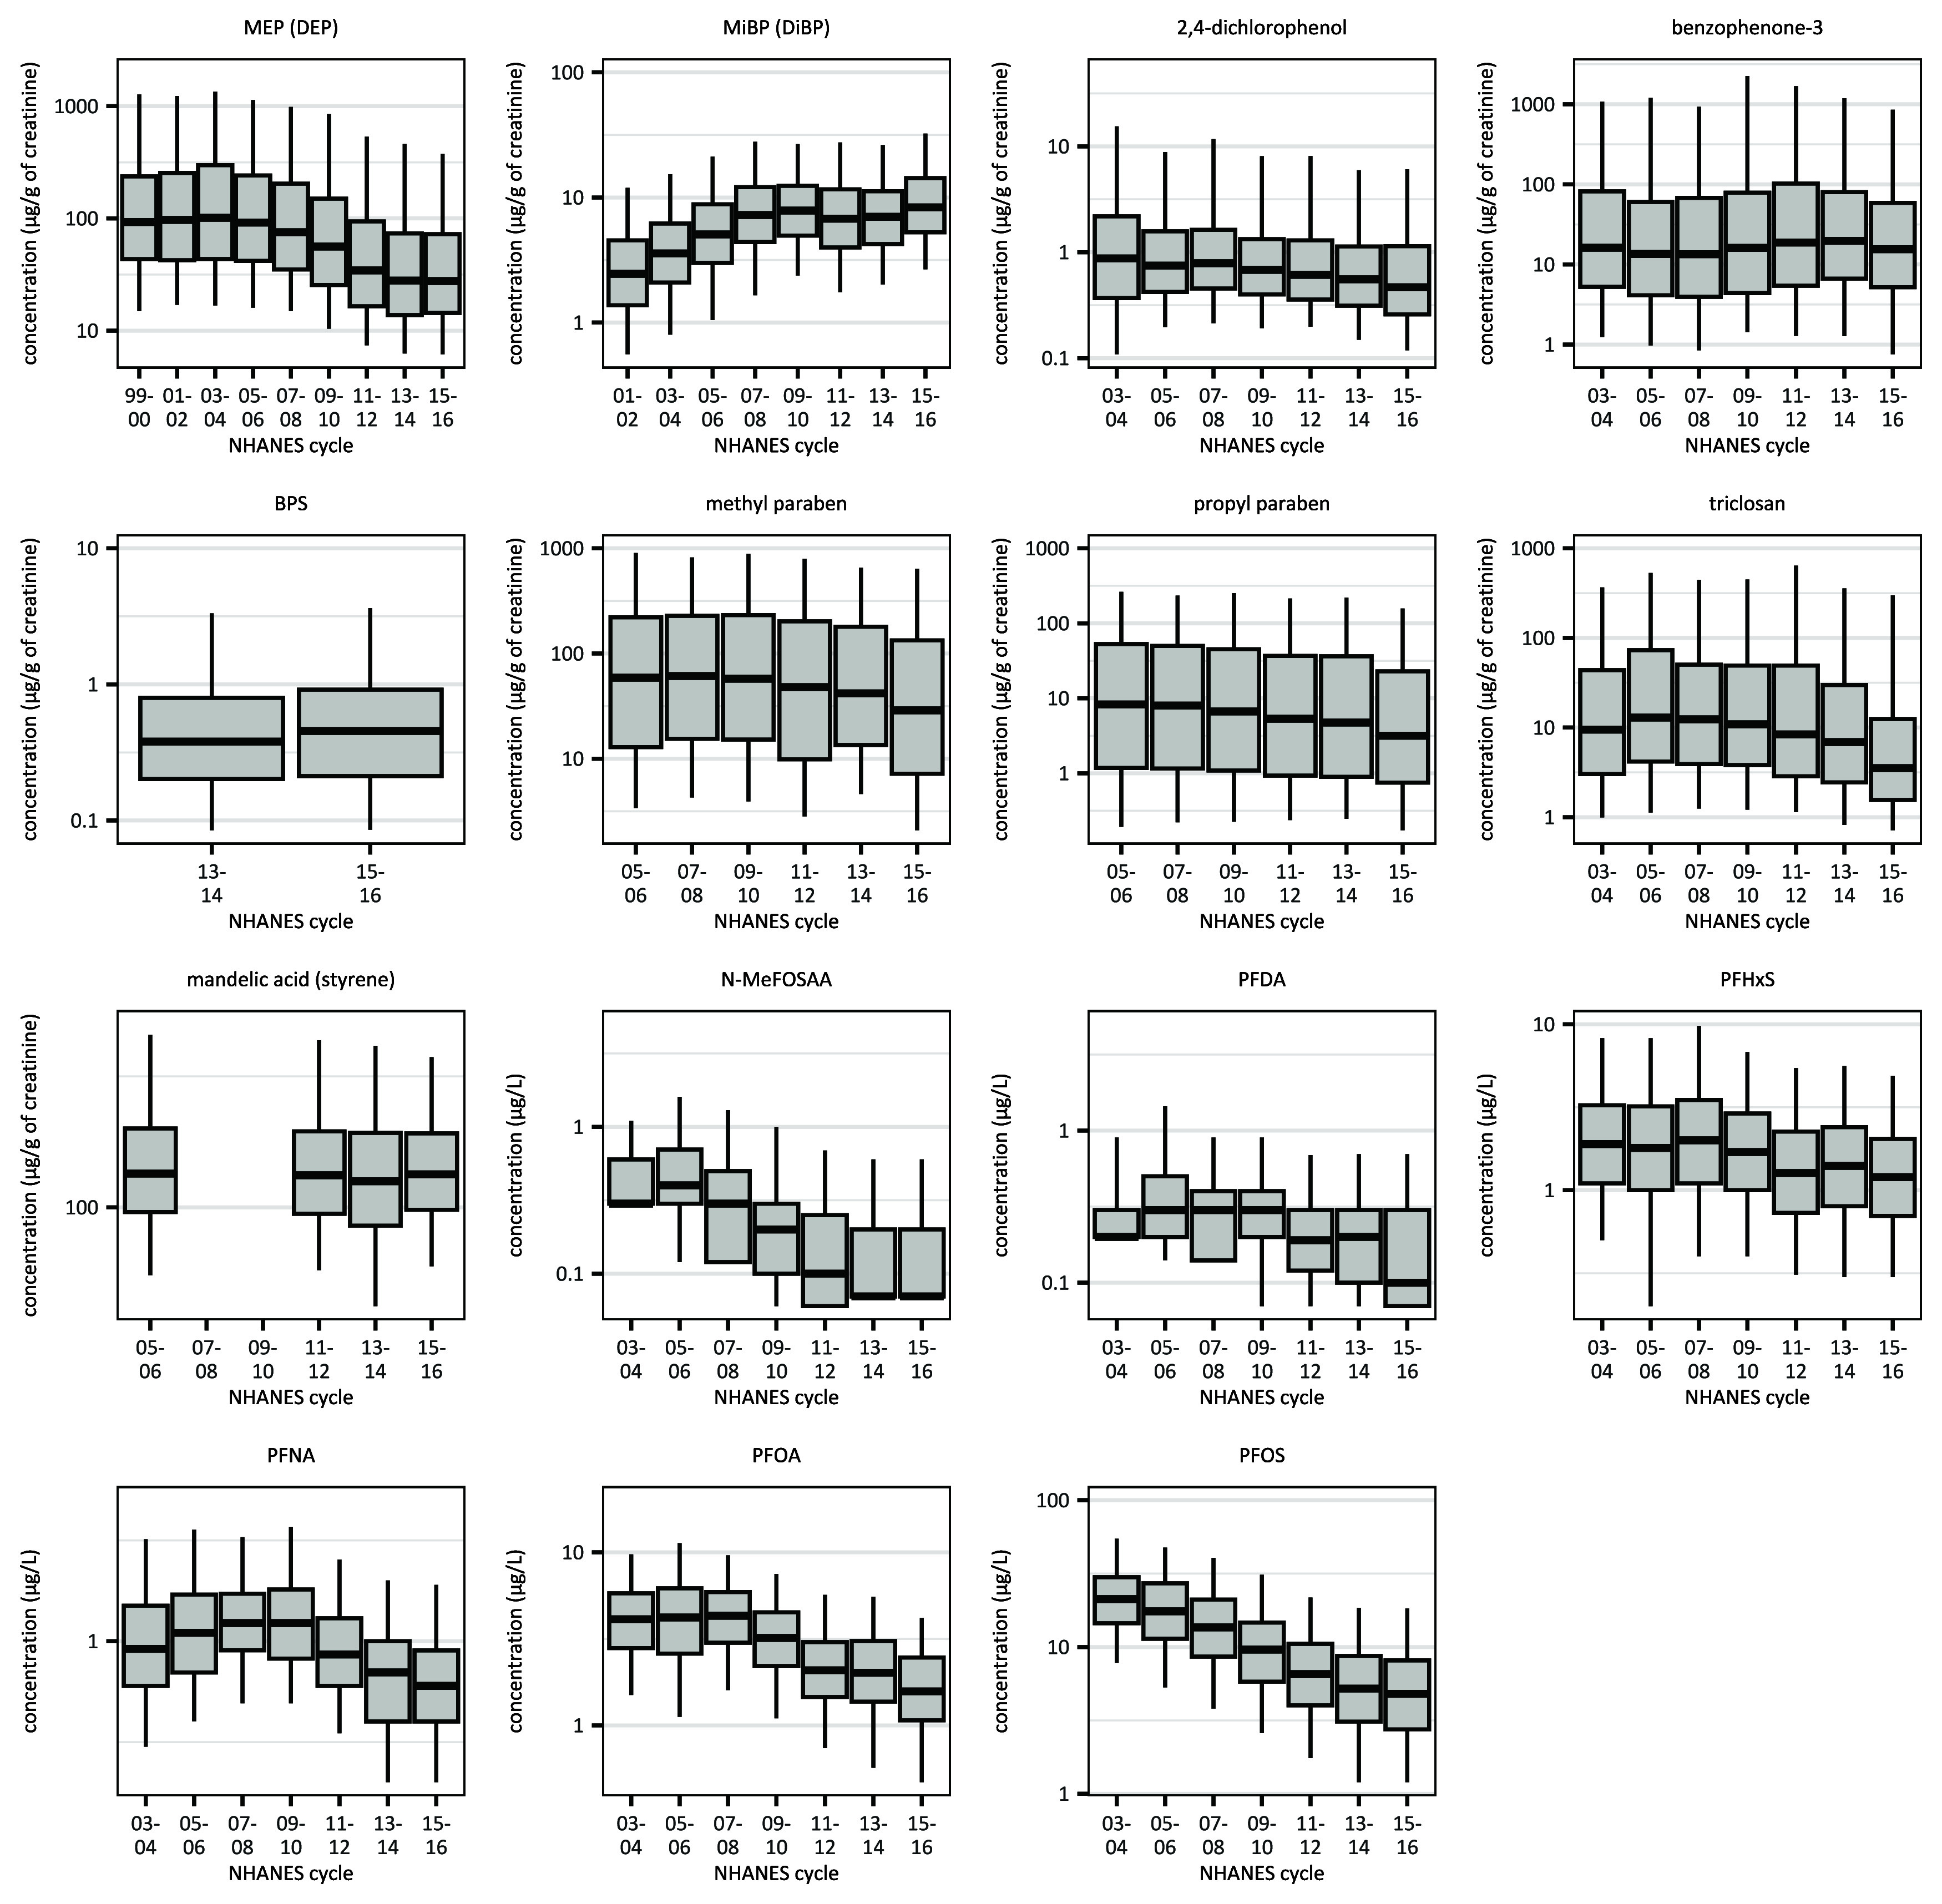
Results: We found that concentrations of biomonitored chemicals generally declined nationwide over time irrespective of their inclusion on the Prop 65 list. Median bisphenol A (BPA) concentrations decreased 15% after BPA's listing on Prop 65, whereas concentrations of the nonlisted but closely related bisphenol S (BPS) increased 20% over this same period, suggesting chemical substitution. Californians generally had lower levels of biomonitored chemicals than the rest of the US population.

Discussion: Our findings suggest that increased scientific and regulatory attention, as well as public awareness of the harms of Prop 65-listed chemicals, prompted changes in product formulations that reduced exposure to those chemicals nationwide. Trends in bisphenols and several phthalates suggest that manufacturers replaced some listed chemicals with closely related but unlisted chemicals, increasing exposure to the substitutes. Our findings have implications for the design of policies to reduce toxic exposures, biomonitoring programs to inform policy interventions, and future research into the regulatory and market forces that affect chemical exposure. https://doi.org/10.1289/EHP13956.


Figures

Figure 1 is a forest plot, plotting 2-Naphthol (naphthalene): ninety-fifth, 2-Naphthol (naphthalene): seventy-fifth, 2-Naphthol (naphthalene): twenty-fifth, 2-Aminothiazoline-4-carboxylic acid (cyanide): ninety-fifth, 2-Aminothiazoline-4-carboxylic acid (cyanide): seventy-fifth, 2-Aminothiazoline-4-carboxylic acid (cyanide): twenty-fifth, n-acetyl-S-(2-carbamoylethyl)-L-cysteine (acrylamide): ninety-fifth, n-acetyl-S-(2-carbamoylethyl)-L-cysteine (acrylamide): seventy-fifth, n-acetyl-S-(2-carbamoylethyl)-L-cysteine (acrylamide): twenty-fifth, Toluene: ninety-fifth, Toluene: seventy-fifth, Toluene: twenty-fifth, Chloroform: ninety-fifth, Chloroform: seventy-fifth, Chloroform: twenty-fifth, Bisphenol A: ninety-fifth, Bisphenol A: seventy-fifth, and Bisphenol A: twenty-fifth, Mono-n-butyl phthalate (di-n-butyl phthalate): ninety-fifth, Mono-n-butyl phthalate (di-n-butyl phthalate): seventy-fifth, Mono-n-butyl phthalate (di-n-butyl phthalate): twenty-fifth, Mono(carboxyooctyl) phthalate (diisononyl phthalate): ninety-fifth, Mono(carboxyooctyl) phthalate (diisononyl phthalate): seventy-fifth, Mono(carboxyooctyl) phthalate (diisononyl phthalate): twenty-fifth, Mono(carboxynonyl) phthalate (diisodecyl phthalate): ninety-fifth, Mono(carboxynonyl) phthalate (diisodecyl phthalate): seventy-fifth, Mono(carboxynonyl) phthalate (diisodecyl phthalate): twenty-fifth, Mono(2-ethyl-5-hydroxyhexyl) phthalate (di(2-ethylhexyl) phthalate): ninety-fifth, Mono(2-ethyl-5-hydroxyhexyl) phthalate (di(2-ethylhexyl) phthalate): seventy-fifth, Mono(2-ethyl-5-hydroxyhexyl) phthalate (di(2-ethylhexyl) phthalate): twenty-fifth, Monobenzyl phthalate (benzylbutyl phthalate): ninety-fifth, Monobenzyl phthalate (benzylbutyl phthalate): seventy-fifth, and Monobenzyl phthalate (benzylbutyl phthalate): twenty-fifth (y-axis) across change in concentration pre to post P 65 listing (nanograms per milliliter), ranging from negative 1.5 to 1.0 in increments of 0.5 (x-axis) for Californians and non-Californians.
Figure 1.
Estimated change (range shows 95% confidence interval) in natural-logged chemical concentrations from pre- to post-Prop 65–listing, for Californians and non-Californians, for the 25th, 75th, and 95th percentiles of the distribution, based on quantile regression models, controlling for demographics, creatinine for chemicals measured in urine, and cotinine for chemicals associated with smoking. Chemicals are those listed on Prop 65 during the biomonitoring period. Underlying data for the figure is contained in Excel Table S2, “Figure 1 Supporting Data” tab. Note: AAMA, n-acetyl-S-(2-carbamoylethyl)-l-cysteine; ATCA, 2-aminothiazoline-4-carboxylic acid; BBP, benzylbutyl phthalate; BPA, bisphenol A; CA, Californian; DEHP, di(2ethylhexyl) phthalate; DIDP, diisodecyl phthalate; DINP, diisononyl phthalate; DnBP, di-n-butyl phthalate; MBzP, monobenzyl phthalate; MCNP, mono(carboxynonyl) phthalate; MCOP, mono(carboxyoctyl) phthalate; MEHHP, mono-(2-ethyl-5-hydroxyhexyl) phthalate; MnBP, mono-n-butyl phthalate; Non, non-Californian; Prop 65, Proposition 65.
Figure 2 is a set of eleven box and whiskers plot titled Monobenzyl phthalate (benzylbutyl phthalate), Mono-(2-ethyl-5-hydroxyhexyl) phthalate (di-(2-ethylhexyl) phthalate), Mono(carboxynonly) phthalate (diisodecyl phthalate), Mono-n-butyl phthalate (di-n-butyl phthalate), Bisphenol A, Chloroform, Toluene, n-acetyl-S-(2-carbamoylethyl)-L-cysteine (acrylamide), Aminothiazoline-4-carboxylic acid (cyanide), and 2-Naphthol (naphthalene), plotting concentration (micrograms per gram of creatinine), ranging from 1 to 2.7 in increments of 1.7, 2.7 to 7.4 in increments of 4.7, 7.4 to 20.1 in increments of 12.7, 20.1 to 54.6 in increments of 34.5; concentration (micrograms per gram of creatinine), ranging from 10 to 100 in increments of 90; concentration (micrograms per gram of creatinine), ranging from 1 to 10 in increments of 9; concentration (micrograms per gram of creatinine), ranging from 1 to 10 in increments of 9 and 10 to 100 in increments of 90; concentration (micrograms per gram of creatinine), ranging from 1 to 10 in increments of 9 and 10 to 100 in increments of 90; concentration (micrograms per gram of creatinine), ranging from 1 to 10 in increments of 9; concentration (picograms per milliliter), ranging from 10 to 100 in increments of 90; concentration (nanograms per milliliter), ranging from 0.02 to 0.05 in increments of 0.03, 0.05 to 0.14 in increments of 0.09, 0.14 to 0.37 in increments of 0.23, 0.37 to 1 in increments of 0.63; concentration (micrograms per gram of creatinine), ranging from 0 to 100 in increments of 100; concentration (micrograms per gram of creatinine), ranging from 10 to 100 in increments of 90 and 100 to 1,000 in increments of 900; and concentration (micrograms per gram of creatinine), ranging from 1 to 10 in increments of 9 and 10 to 100 in increments of 90 (y-axis) across National Health and Nutrition Examination Survey cycle, ranging as 99 to 00, 01 to 02, 03 to 04, 05 to 06, 07 to 08, 09 to 10, 11 to 12, 13 to 14, 15 to 16; 01 to 02, 03 to 04, 05 to 06, 07 to 08, 09 to 10, 11 to 12, 13 to 14, 15 to 16; 05 to 06, 07 to 08, 09 to 10, 11 to 12, 13 to 14, 15 to 16; 05 to 06, 07 to 08, 09 to 10, 11 to 12, 13 to 14, 15 to 16; 99 to 00, 01 to 02, 03 to 04, 05 to 06, 07 to 08, 09 to 10, 11 to 12, 13 to 14, 15 to 16; 03 to 04, 05 to 06, 07 to 08, 09 to 10, 11 to 12, 13 to 14, 15 to 16; 99 to 00, 01 to 02, 03 to 04, 05 to 06, 07 to 08, 09 to 10, 11 to 12, 13 to 14, 15 to 16; 99 to 00, 01 to 02, 03 to 04, 05 to 06, 07 to 08, 09 to 10, 11 to 12, 13 to 14, 15 to 16; 05 to 06, 11 to 12, 13 to 14, 15 to 16; 05 to 06, 11 to 12, 13 to 14, 15 to 16; and 01 to 02, 03 to 04, 05 to 06, 07 to 08, 09 to 10, 11 to 12, 13 to 14 (x-axis), respectively.
Figure 2.
Biomonitored concentrations, for the United States as a whole, for chemicals listed on Prop 65 during the biomonitoring period. NHANES cycle is listed along the x-axis. Box plots represent 5th (lower whisker), 25th (bottom of box), 50th (dark center line), 75th (top of box), and 95th (upper whisker) percentiles of the nationally representative, publicly available data. For chemicals measured in urine, concentrations shown are creatinine-adjusted. Dashed pink line corresponds to the Prop 65 listing date. Underlying data for the figure is contained in Excel Table S3, “Figure 2 Supporting Data” tab. Note: AAMA, n-acetyl-S-(2-carbamoylethyl)-l-cysteine; ATCA, 2-aminothiazoline-4-carboxylic acid; BBP, benzylbutyl phthalate; BPA, bisphenol A; DEHP, di(2ethylhexyl) phthalate; DiDP, diisodecyl phthalate; DINP, diisononyl phthalate; DnBP, di-n-butyl phthalate; MBzP, monobenzyl phthalate; MCNP, mono(carboxynonyl) phthalate; MCOP, mono(carboxyoctyl) phthalate; MEHHP, mono-(2-ethyl-5-hydroxyhexyl) phthalate; MnBP, mono-n-butyl phthalate; NHANES, National Health and Nutrition Examination Survey; Prop 65, Proposition 65.
Figure 3A is as set of eight box and whiskers plot titled 2, 5-Dichlorophenol (para-dichlorobenzene), n-acetyl-S-(3,4-dihidroxybutyl)-L-cysteine (1,3-butadiene), n-acetyl-S-(4-hydroxy-2-butenyl)-L-cysteine (1,3-butadiene), N-Acetyl-S-(2-cyanoethyl)-l-cysteine (acrylonitrile), 2-Hydroxypropyl methacrylate (propylene oxide), Cadmium, Lead, and Mercury, plotting concentration (micrograms per gram of creatinine), ranging from 1 to 10 in increments of 9, 10 to 100 in increments of 90, 100 to 1,000 in increments of 900; concentration (micrograms per gram of creatinine), ranging from 0 to 1,000 in increments of 1,000; concentration (micrograms per gram of creatinine), ranging from 10 to 100 in increments of 90; concentration (micrograms per gram of creatinine), ranging from 1 to 10 in increments of 9, 10 to 100 in increments of 90; concentration (micrograms per gram of creatinine), ranging from 10 to 100 in increments of 90; concentration (micrograms per gram of creatinine), ranging from 0.1 to 1 in increments of 0.9; concentration (micrograms per gram), ranging from 1 to 10 in increments of 9; and concentration (micrograms per gram), ranging from 0.1 to 1 in increments of 0.9 and 1 to 10 in increments of 9 (y-axis) across National Health and Nutrition Examination Survey cycle, ranging as 03 to 04, 05 to 06, 07 to 08, 09 to 10, 11 to 12, 13 to 14, 15 to 16; 05 to 06, 07 to 08, 09 to 10, 11 to 12, 13 to 14, 15 to 16; 05 to 06, 07 to 08, 09 to 10, 11 to 12, 13 to 14, 15 to 16; 05 to 06, 07 to 08, 09 to 10, 11 to 12, 13 to 14, 15 to 16; 05 to 06, 07 to 08, 09 to 10, 11 to 12, 13 to 14, 15 to 16; 99 to 00, 01 to 02, 03 to 04, 05 to 06, 07 to 08, 09 to 10, 11 to 12, 13 to 14, 15 to 16; 99 to 00, 01 to 02, 03 to 04, 05 to 06, 07 to 08, 09 to 10, 11 to 12, 13 to 14, 15 to 16; and 99 to 00, 01 to 02, 03 to 04, 05 to 06, 07 to 08, 09 to 10, 11 to 12, 13 to 14, 15 to 16 (x-axis), respectively. Figure 3B is a set of five box and whiskers plot titled 3-Methylhippuric acid plus 4-Methylhippuric Acid (xylene), 2-Hydroxyfluorene (fluorene), 3-Hydroxyphenanthrene (phenanthrene), 1-Hydroxyphenanthrene (phenanthrene), and 1-Hydroxypyrene (pyrene), plotting concentration (micrograms per gram of creatinine), ranging from 100 to 1,000 in increments of 900; concentration (micrograms per gram of creatinine), ranging from 100 to 1,000 in increments of 900; concentration (micrograms per gram of creatinine), ranging from 0 to 1,000 in increments of 100; concentration (micrograms per gram of creatinine), ranging from 100 to 1,000 in increments of 900; and concentration (micrograms per gram of creatinine), ranging from 10 to 100 in increments of 90 and 100 to 1,000 in increments of 900 (y-axis) across National Health and Nutrition Examination Survey cycle, ranging as 05 to 06, 07 to 08, 09 to 10, 11 to 12, 13 to 14, 15 to 16; 01 to 02, 02 to 03, 03 to 04, 05 to 06, 07 to 08, 09 to 10, 11 to 12, 13 to 14; 01 to 02, 02 to 03, 03 to 04, 05 to 06, 07 to 08, 09 to 10, 11 to 12; 01 to 02, 02 to 03, 03 to 04, 05 to 06, 07 to 08, 09 to 10, 11 to 12, 13 to 14; and 01 to 02, 02 to 03, 03 to 04, 05 to 06, 07 to 08, 09 to 10, 11 to 12, 13 to 14 (x-axis), respectively.
Figure 3.
Biomonitored concentrations, for the United States as a whole, for chemicals listed before 1999 (start of NHANES data). NHANES cycle is listed along the x-axis. Box plots represent 5th (lower whisker), 25th (bottom of box), 50th (dark center line), 75th (top of box), and 95th (upper whisker) percentiles of the nationally representative, publicly available data for (A) non–diesel-related and (B) diesel-related chemicals. For chemicals measured in urine, concentrations shown are creatinine-adjusted. Underlying data for the figure is contained in Excel Tables S4 and S5, “Figure 3a Supporting Data” and “Figure 3b Supporting Data” tabs. Note: 2HPMA, n-acetyl-S-(2-hydroxypropyl)-L-cysteine; 3MHA, 3-methylhippuric acid; 4MHA, 4-methylhippuric acid; CYMA, n-acetyl-S-(2-cyanoethyl)-l-cysteine; DHBMA, n-acetyl-S-(3,4-dihidroxybutyl)-l-cysteine; MHBMA3, n-acetyl-S-(4-hydroxy-2-butenyl)-l-cysteine; NHANES, National Health and Nutrition Examination Survey; p-DCB, p-dichlorobenzene.
Figure 4 is a set of fifteen box and whiskers plot titled monoethyl phthalate (diethyl phthalate), Monoisobutyl phthalate (diisobutyl phthalate), 2,4-Dichlorophenol, Benzophenone-3, Bisphenol S, Methyl paraben, Propyl paraben, triclosan, Mandelic acid (styrene), 2-(N-Methyl perfluorooctane sulfonamido) acetic acid, Perfluorodecanoic acid, Perfluorohexane sulfonic acid, Perfluorononanoic acid, Perfluorooctanoic acid, and Perfluorooctane sulfonic acid, plotting concentration (micrograms per gram of creatinine), ranging from 10 to 100 in increments of 90 and 100 to 1,000 in increments of 900; concentration (micrograms per gram of creatinine), ranging from 1 to 10 in increments of 9 and 10 to 100 in increments of 90; concentration (micrograms per gram of creatinine), ranging from 0.1 to 1 in increments of 0.9, 1 to 10 in increments of 9; concentration (micrograms per gram of creatinine), ranging from 1 to 10 in increments of 9, 10 to 100 in increments of 90, 100 to 1,000 in increments of 900; concentration (micrograms per gram of creatinine), ranging from 0.1 to 1 in increments of 0.9, 1 to 10 in increments of 9; concentration (micrograms per gram of creatinine), ranging from 10 to 100 in increments of 90, 100 to 1,000 in increments of 900; concentration (micrograms per gram of creatinine), ranging from 1 to 10 in increments of 9, 10 to 100 in increments of 90, 100 to 1,000 in increments of 900; concentration (micrograms per gram of creatinine), ranging from 1 to 10 in increments of 9, 10 to 100 in increments of 90, 100 to 1,000 in increments of 900; concentration (micrograms per gram of creatinine), ranging from 0 to 100 in increments of 100; concentration (micrograms per liter), ranging from 0.1 to 1 in increments of 0.9; concentration (micrograms per liter), ranging from 0.1 to 1 in increments of 0.9; concentration (micrograms per liter), ranging from 1 to 10 in increments of 9; concentration (micrograms per liter), ranging from 0 to 1 in unit increments; concentration (micrograms per liter), ranging from 1 to 10 in increments of 9; and concentration (micrograms per liter), ranging from 1 to 10 in increments of 9, 10 to 100 in increments of 90 (y-axis) across National Health and Nutrition Examination Survey cycle, ranging as 99 to 00, 01 to 02, 03 to 04, 05 to 06, 07 to 08, 09 to 10, 11 to 12, 13 to 14, 15 to 16; 01 to 02, 03 to 04, 05 to 06, 07 to 08, 09 to 10, 11 to 12, 13 to 14, 15 to 16; 03 to 04, 05 to 06, 07 to 08, 09 to 10, 11 to 12, 13 to 14, 15 to 16; 03 to 04, 05 to 06, 07 to 08, 09 to 10, 11 to 12, 13 to 14, 15 to 16; 13 to 14, 15 to 16; 05 to 06, 07 to 08, 09 to 10, 11 to 12, 13 to 14, 15 to 16; 05 to 06, 07 to 08, 09 to 10, 11 to 12, 13 to 14, 15 to 16; 03 to 04, 05 to 06, 07 to 08, 09 to 10, 11 to 12, 13 to 14, 15 to 16; 05 to 06, 07 to 08, 09 to 10, 11 to 12, 13 to 14, 15 to 16; 03 to 04, 05 to 06, 07 to 08, 09 to 10, 11 to 12, 13 to 14, 15 to 16; 03 to 04, 05 to 06, 07 to 08, 09 to 10, 11 to 12, 13 to 14, 15 to 16; 03 to 04, 05 to 06, 07 to 08, 09 to 10, 11 to 12, 13 to 14, 15 to 16; 03 to 04, 05 to 06, 07 to 08, 09 to 10, 11 to 12, 13 to 14, 15 to 16; 03 to 04, 05 to 06, 07 to 08, 09 to 10, 11 to 12, 13 to 14, 15 to 16; and 03 to 04, 05 to 06, 07 to 08, 09 to 10, 11 to 12, 13 to 14, 15 to 16 (x-axis), respectively.
Figure 4.
Biomonitored concentrations, for the United States as a whole, for chemicals not listed on Prop 65 as of the end of the biomonitoring period. NHANES cycle is listed along the x-axis. Box plots represent 5th (lower whisker), 25th (bottom of box), 50th (dark center line), 75th (top of box), and 95th (upper whisker) percentiles of the nationally representative, publicly available data. For chemicals measured in urine, concentrations shown are creatinine-adjusted. Underlying data for the figure is contained in Excel Table S6, “Figure 4 Supporting Data” tab. Note: BPS, bisphenol S; DEP, diethyl phthalate; DiBP, diisobutyl phthalate; MEP, monoethyl phthalate; MiBP, monoisobutyl phthalate; NHANES, National Health and Nutrition Examination Survey; N-MeFOSAA, 2-(N-methyl-perfluorooctane sulfonamido)acetic acid; PFDA, pefluorodecanoic acid; PFHxS, perfluorohexane sulfonic acid; PFNA, perfluorononanoic acid; PFOA, perfluorooctanoic acid; PFOS, perfluorooctane sulfonic acid; Prop 65, Proposition 65.

References

    1. US EPA (US Environmental Protection Agency). 2023. TSCA Chemical Substance Inventory. https://www.epa.gov/tsca-inventory/how-access-tsca-inventory [accessed 22 August 2023].
    1. Safe Drinking Water and Toxic Enforcement Act of 1986. 1986. Cal. Health and Safety Code. Vol. 25249 -25249.14.
    1. Fung A, O’Rourke D. 2000. Forum: reinventing environmental regulation from the grassroots up: explaining and expanding the success of the Toxics Release Inventory. Environ Manage 25(2):115–127, PMID: 10594186, 10.1007/s002679910009. - DOI - PubMed
    1. Pease WS. 1991. Chemical hazards and the public’s right to know. Environment 33(10):12–20, 10.1080/00139157.1991.9932550. - DOI
    1. California OEHHA (Office of Environmental Health Hazard Assessment). n.d. How chemicals are added to the Proposition 65 list. https://oehha.ca.gov/proposition-65/how-chemicals-are-added-proposition-... [accessed 31 December 2021].