. 2024 Oct 21;20(10):e1011441.
doi: 10.1371/journal.pgen.1011441. eCollection 2024 Oct.

The Drosophila circadian clock gene cycle controls the development of clock neurons

Affiliations

The Drosophila circadian clock gene cycle controls the development of clock neurons

Grace Biondi et al. PLoS Genet. .

Abstract

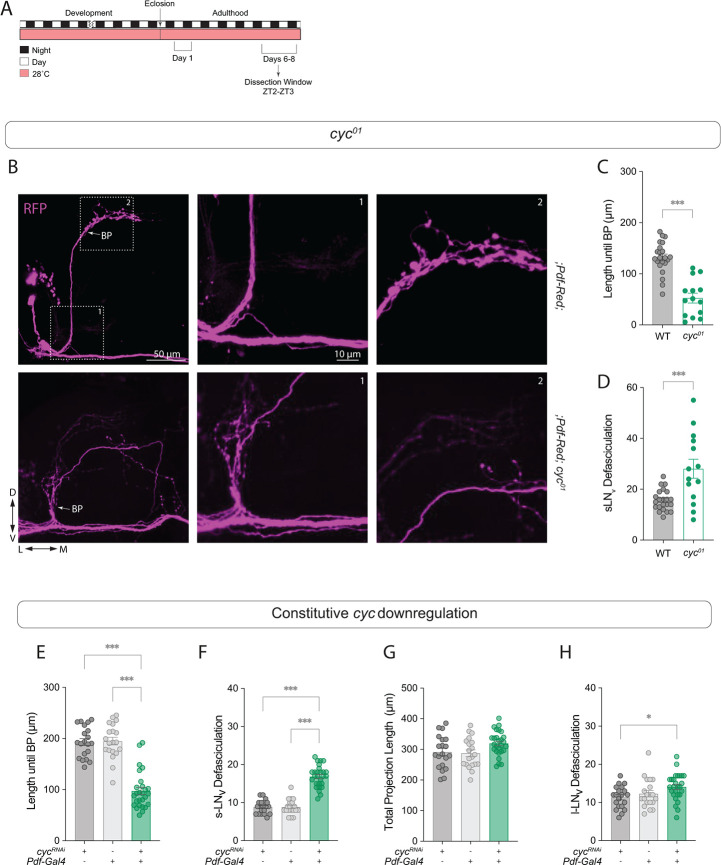
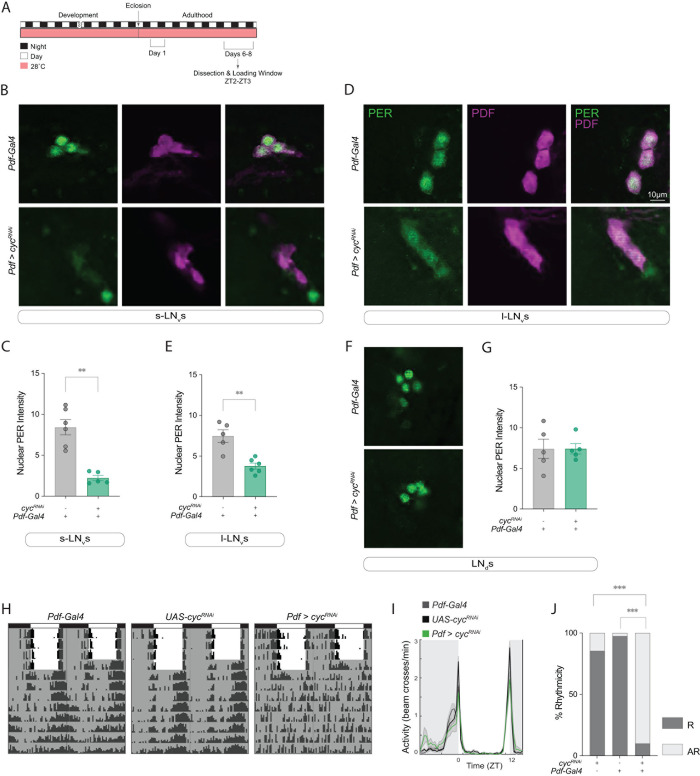
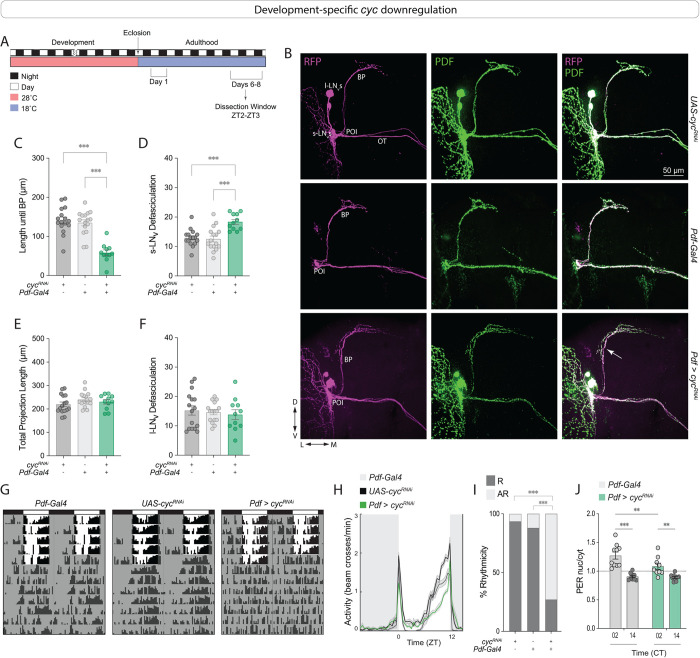
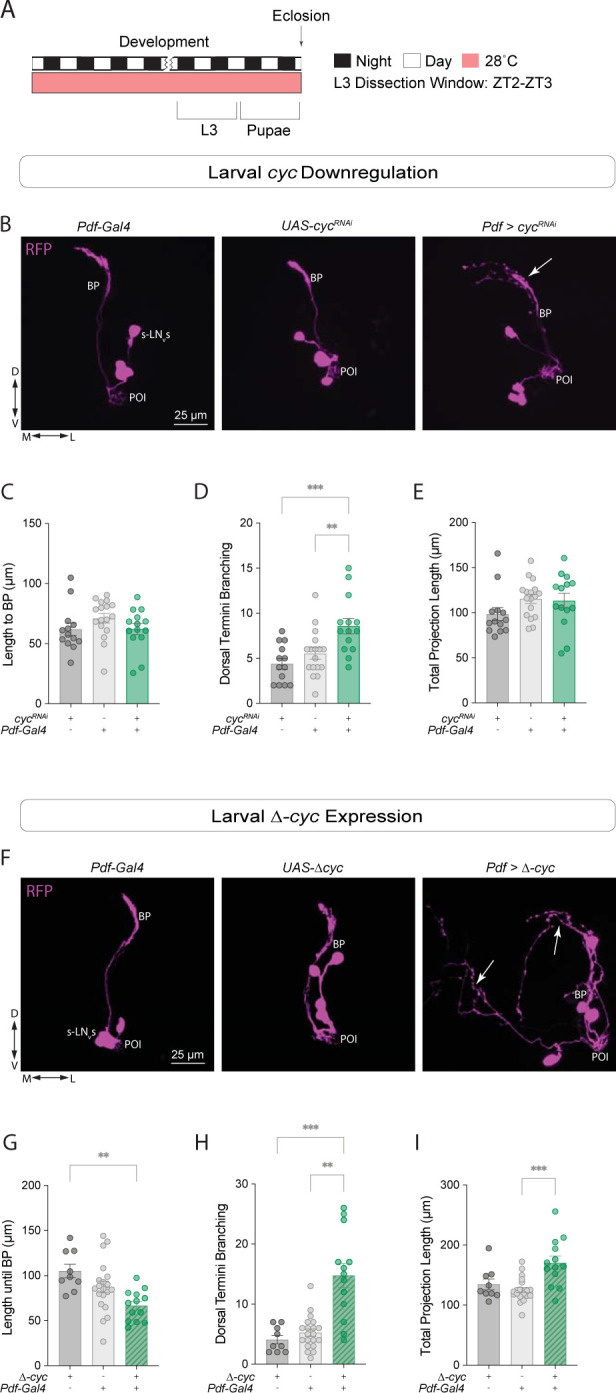
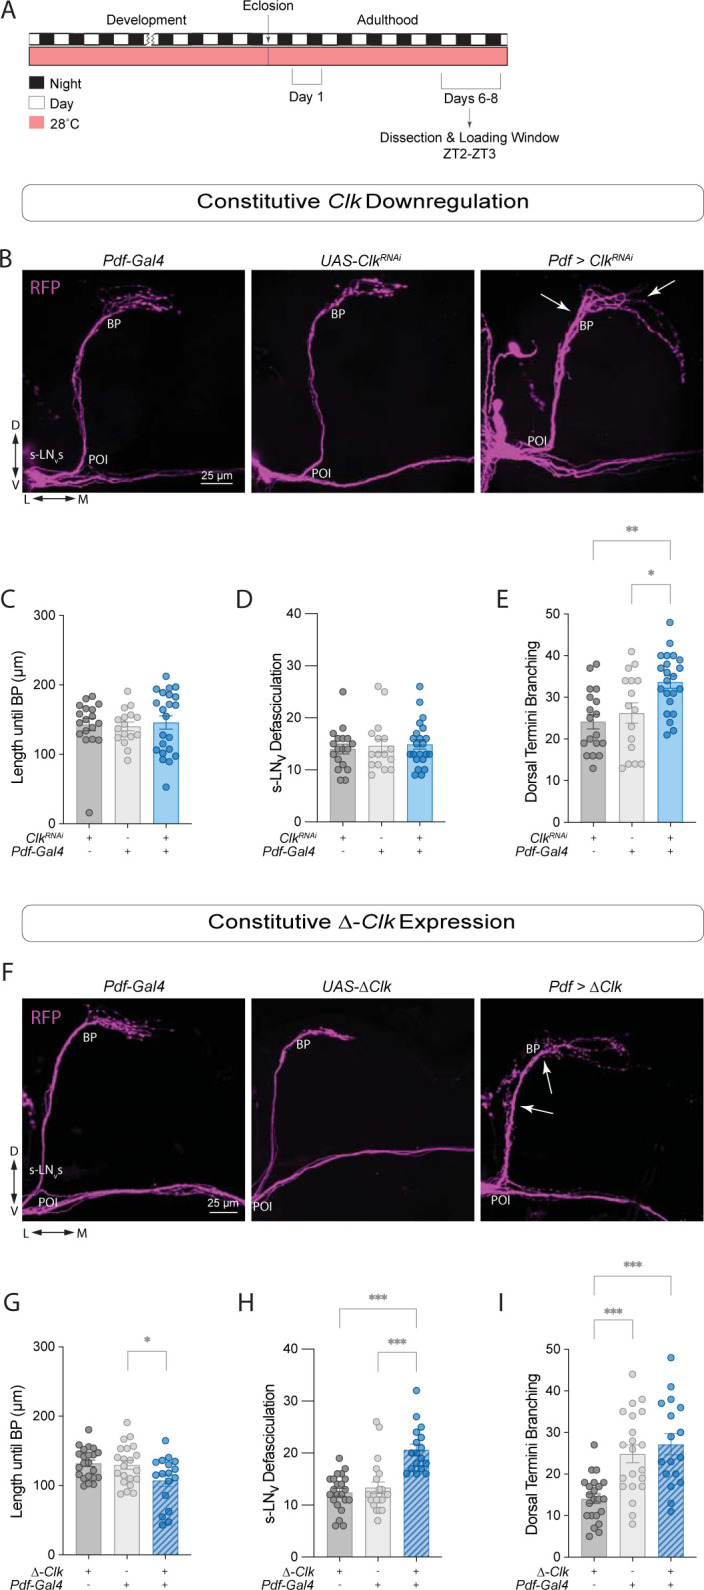
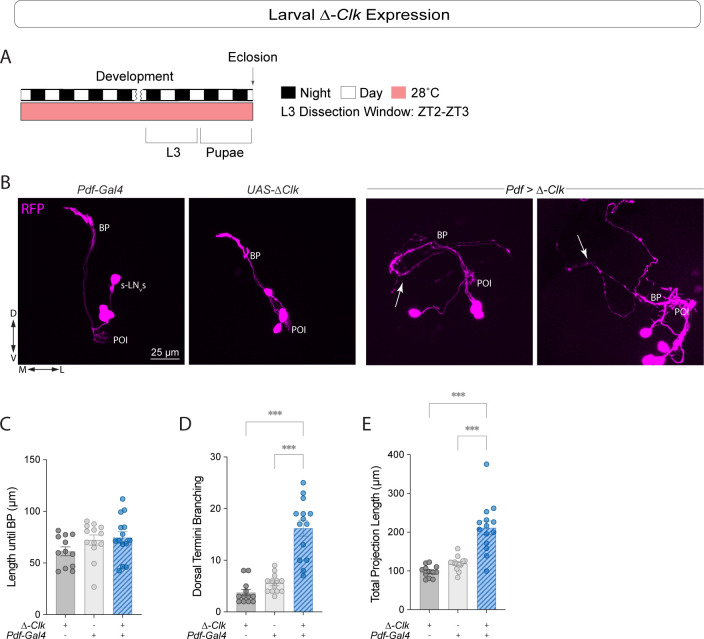
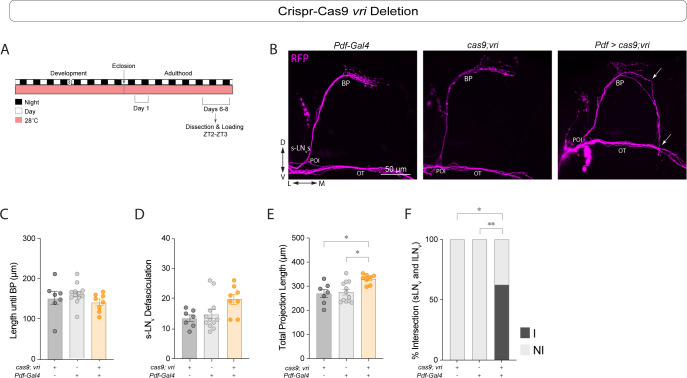
Daily behavioral and physiological rhythms are controlled by the brain's circadian timekeeping system, a synchronized network of neurons that maintains endogenous molecular oscillations. These oscillations are based on transcriptional feedback loops of clock genes, which in Drosophila include the transcriptional activators Clock (Clk) and cycle (cyc). While the mechanisms underlying this molecular clock are very well characterized, the roles that the core clock genes play in neuronal physiology and development are much less understood. The Drosophila timekeeping center is composed of ~150 clock neurons, among which the four small ventral lateral neurons (sLNvs) are the most dominant pacemakers under constant conditions. Here, we show that downregulating the clock gene cyc specifically in the Pdf-expressing neurons leads to decreased fasciculation both in larval and adult brains. This effect is due to a developmental role of cyc, as both knocking down cyc or expressing a dominant negative form of cyc exclusively during development lead to defasciculation phenotypes in adult clock neurons. Clk downregulation also leads to developmental effects on sLNv morphology. Our results reveal a non-circadian role for cyc, shedding light on the additional functions of circadian clock genes in the development of the nervous system.


Conflict of interest statement

The authors have declared that no competing interests exist.

Figures

Fig 1
Fig 1. Cyc downregulation in circadian pacemaker neurons prevents the formation of sLNvs axon bundles.
The cyc01 mutant has disrupted sLNv morphology. (A) Representative timeline of the experiments in the figure. Flies were kept at 28°C throughout development and experiments were performed within days 6–8 post-eclosion. (B) Representative confocal images of Pdf-RFP controls and; Pdf-RFP;cyc01 experimental flies stained with anti-RFP (magenta). The branching point (BP) of the dorsal projections is indicated. Scale bar = 25 μm. Boxes with dashed lines indicate the proximal (1) and distal (2) projections, corresponding to the labeled projection images in the center and right panels, respectively. An unpaired t-test was used to quantify the sLNv projection length until the branching point (BP) (C), and the total number of intersections of the sLNv ventral projections (D). Results from two independent experiments, with each dot representing one brain. For each genotype, the number of subjects (n) fall in the range: 13 ≤ n ≤ 22. (E-H) Quantification of the LNv morphology phenotypes of experimental flies in which a cycRNAi transgene was driven by a; Pdf-RFP,Pdf-Gal4;Tub-Gal80ts driver compared to the parental controls. The sLNv projection length until the branching point (BP) (E), the total number of intersections of the sLNv ventral projections (F), the total sLNv projection length (G), and the total number of intersections of the lLNv projections along the optic tract (OT) (H) are shown. Results from three independent experiments, with each dot representing one brain. For each genotype, the n falls in the range: 20 ≤ n ≤ 27. For nonparametric data sets, statistical comparisons were done with Kruskal-Wallis tests followed by Dunn’s multiple comparisons tests. For parametric data sets, statistical comparisons were done with one-way ANOVAs followed by Tukey post hoc tests. Differences that are not significant are not indicated. *p < 0.05, *** p < 0.001. Error bars indicate SEM.
Fig 2
Fig 2. Constitutive cyc downregulation in Pdf+ cells leads to a reduction in PER levels and arrhythmicity under free-running conditions.
(A) Representative timeline of the experiments in the figure. Flies were kept at 28°C for their entire lifespan. Experiments were performed within days 6–8 post-eclosion. Dissections were performed at ZT2-3. (B,D,F) Representative confocal images of PER (green) and PDF (magenta) staining in the sLNvs (B), lLNvs (D), and LNds (F) of Pdf > cycRNAi experimental and Pdf-Gal4 /+ control flies (n = 5–6 brains per clock neuron group). All lines also included a Pdf-RFP transgene. Scale bar = 10 μm. (C,E,G) Mann-Whitney tests were used to compare nuclear PER intensity levels in the sLNvs (C), lLNvs (E), and LNds (G) in flies of the indicated genotypes. Differences that are not significant are not indicated. ** p < 0.01. Error bars indicate SEM. (H) Representative actograms of flies of the indicated genotypes under 5 days of LD entrainment followed by 7 days of free-running (DD). To allow comparison with development-specific cyc downregulation, flies in this experiment were raised at 28°C for their entire lifespan and the experiment was conducted at 28°C. (I) Population activity plots for flies during days 3–5 of the LD cycle at 28°C. (J) Fisher’s exact contingency tests were used to analyze the percentage of rhythmic flies of the indicated genotypes under DD (DD1-7). The driver line also included a tub-Gal80ts transgene. Additional quantifications can be found in Table 1. R = Rhythmic and AR = arrhythmic. Differences that are not significant are not indicated. *** p < 0.001. Behavioral data corresponds to two independent behavior experiments. For each genotype: 40 ≤ n ≤ 48.
Fig 3
Fig 3. Development-specific cyc downregulation in Pdf+ cells prevents sLNv fasciculation.
(A) Representative timeline of the experiments in the figure. Flies were raised in LD at 28°C, and transferred to 18°C immediately after eclosion. Dissections were then performed in 6–8 day old adults at ZT2-3. (B) Representative confocal images of anti-PDF (green) and anti-RFP (magenta) staining of adult fly brains in which cyc was downregulated only during development. Each line also included a Pdf-RFP transgene. The white arrow indicates the increased defasciculation in the sLNv projections in experimental flies. Scale bar = 50 μm. (C-F) Quantification of the LNv morphology phenotypes of flies of the indicated genotypes. The driver line also included a tub-Gal80ts transgene. The sLNv projection length until the branching point (BP) (C), the number of intersections of sLNv ventral projections (D), the total sLNv projection length (E), and the total number of intersections of the lLNv projections along the optic tract (OT) (F) are shown for flies in which cyc was downregulated in Pdf+ cells until eclosion. Two independent experiments were conducted. For each genotype: 11 ≤ n ≤ 16. One-way ANOVA tests were used to quantify the LNv morphology. *** p < 0.001. Error bars indicate SEM. Each dot corresponds to one brain. (G-I). Behavioral phenotypes of development-specific cyc knockdown. Flies were raised in LD at 28°C, before being transferred to 18°C upon eclosion. Experiments were conducted at 18°C. (G) Representative actograms of flies of the indicated genotypes under free-running (see Table 1 for n and additional quantifications). (H) Population activity plots for flies during days 3–5 of the LD cycle at 18°C. (I) Percent rhythmicity for the indicated genotypes under DD. R = Rhythmic and AR = arrhythmic. Fisher’s exact contingency tests were used to analyze the percentage of rhythmic flies under DD (DD1-7). *** p < 0.001. Error bars indicate SEM. The data correspond to three independent behavior experiments. For each genotype: 68 ≤ n ≤ 94. (J) Quantification of nuclear over cytoplasmic PER immunosignal within the sLNvs on day 2 of constant darkness at 18°C from brains of Gal4 controls or cyc RNAi-expressing flies. A two-way ANOVA was employed for statistical analysis. ** p < 0.01, *** p < 0.001. Error bars indicate SEM.
Fig 4
Fig 4. Cyc manipulations lead to aberrant sLNv projections in larval clock neurons.
(A) Representative timeline of the experiments in the figure. Larvae were raised in LD at 28°C. Third instar larvae (L3) were dissected at ZT2-3. (B-E) Developmental effects of cyc knockdown in the sLNvs. (B) Representative confocal images of L3 larval brains stained with anti-RFP, labeling the sLNvs. (C-E) The projection length from the POI to the BP (C), the degree of sLNv dorsal termini branching (D), and the total projection length (E) were compared. For each genotype: 13 ≤ n ≤ 17. (F-I) Developmental effects of expressing a dominant-negative form of cyc, Δ-cyc, in the larval sLNvs. (F) Representative confocal images of anti-RFP staining in the sLNvs of L3 larvae. A one-way ANOVA followed by a Tukey’s Multiple Comparisons tests was used to compare the projection length from the POI to the BP (G). A Kruskal-Wallis tests followed by Dunn’s multiple comparisons tests compared the nonparametric data sets: the degree of sLNv dorsal termini branching (H) and the total projection length (I). Each dot corresponds to one brain. For each genotype: 9 ≤ n ≤ 20. ** p < 0.01, *** p < 0.001. Three independent experiments were conducted for each genetic manipulation and each line also included a Pdf-RFP transgene. The driver lines also included a tub-Gal80ts transgene. Error bars indicate SEM.
Fig 5
Fig 5. Clk and cyc manipulations result in different morphology phenotypes in clock neurons.
(A) Representative timeline of the experiments in the figure. Flies were kept in LD conditions at 28°C for their entire lifespan. Dissections were performed within Days 6–8 post-eclosion at ZT2-3. (B) Representative confocal images of anti-RFP staining in the sLNvs adult brains of control (ClkRNAi /+ and Pdf-Gal4;tub-Gal80ts/+), and experimental (Pdf > ClkRNAi) flies. White arrows indicate the BP (left) and extension of some of the sLNv dorsal projections (right) in the experimental line. All lines employed also included a Pdf-RFP transgene. Scale bar = 25 μm. (C-E) Quantification of sLNv morphology using Kruskal-Wallis tests followed by Dunn’s multiple comparisons tests for nonparametric datasets, compared the length until the branching point (C) and the total number of axonal crosses of the sLNvs (D). For parametric data, ordinary one-way ANOVA tests followed by Tukey’s Multiple Comparisons tests compared the total number of axonal crosses after the BP (E). Each dot corresponds to one brain. Two independent experiments were conducted. For each genotype: 16 ≤ n ≤ 22. * p < 0.05, *** p < 0.001. Error bars indicate SEM. (F) Representative confocal images of anti-RFP (magenta) staining in the sLNvs adult brains of control (UAS-ΔClk /+ and Pdf-Gal4;tub-Gal80ts/+), and experimental (Pdf > Δ-Clk) flies. White arrows indicate the BP (top) and increased defasciculation along the sLNv projections (bottom). All lines employed also included a Pdf-RFP transgene. Scale bar = 25 μm. (G-I) Quantification of sLNv morphology phenotypes: length until the branching point (G), the total number of axonal crosses of the sLNvs (H), and the total number of axonal crosses after the BP (I). For parametric data, ordinary one-way ANOVA tests followed by Tukey’s Multiple Comparisons tests were employed. For nonparametric data, Kruskal-Wallis tests followed by Dunn’s multiple comparisons tests were employed. See S1 Table for details about statistical analysis. Each dot corresponds to one brain. Two independent experiments were conducted. For each genotype: 17 ≤ n ≤ 22. ** p < 0.01, *** p < 0.001. Error bars indicate SEM.
Fig 6
Fig 6. Expressing Δ-Clk in the sLNvs leads to axonal morphology phenotypes in L3 larvae.
(A) Representative timeline of the experiments in the figure. Larvae were raised in LD at 28°C. Third instar larvae (L3) were dissected at ZT2-3. (B) Representative confocal images of anti-RFP (magenta) staining in the sLNvs when Δ-Clk was expressed in Pdf+ neurons in L3 larvae. Each line also included a Pdf-RFP transgene, and the driver line also included a tub-Gal80ts transgene. White arrows indicate misrouting of the sLNv projections in the experimental line. Scale bar = 25 μm. For nonparametric data, Kruskal-Wallis tests followed by Dunn’s multiple comparisons tests were used to compare the length to the BP (C). One way ANOVA tests were used to compare dorsal termini branching (D) and the total projection length (E). Two independent experiments were conducted. Each dot corresponds to one brain. For each genotype: 12 ≤ n ≤ 14. *** p < 0.001. Error bars indicate SEM.
Fig 7
Fig 7. Vri mutagenesis results in sLNv hyperextension.
(A) Representative timeline of the experiments in the figure. Flies were kept in LD conditions at 28°C for their entire lifespan. Dissections were performed in 6–8 day old adults at ZT2-3. Behavioral experiments were run at constant 28°C. (B) Representative confocal images of anti-RFP (magenta) staining in the sLNvs adult brains of control (cas9;vrig\/+ and Pdf-Gal4;tub-Gal80ts/+), and experimental (Pdf > cas9;vrig) flies. All lines employed also included a Pdf-RFP transgene. White arrows indicate the misrouting of the sLNv dorsal projections (top), and the intersection of the sLNv with the lLNvs at the OT (bottom). Scale bar = 25 μm. (C-E) Kruskal-Wallis tests followed by Dunn’s multiple comparisons tests were used to compare the length until the branching point (C), the total number of intersections of the sLNvs ventral projections (D), and the longest path of the sLNv projections (without including misrouting) (E). (F) Fisher’s exact contingency tests were used to analyze the percentage of brains where the sLNvs intersected with the lLNvs at the optic tract (I = Intersecting, N.I. = Not Intersecting). See Table 1 for additional quantifications. Each dot corresponds to one brain. Two independent experiments were conducted. For each genotype: 7 ≤ n ≤ 12. * p < 0.05, ** p < 0.01, *** p < 0.001. Error bars indicate SEM.

References

    1. Herzog ED. Neurons and networks in daily rhythms. Nat Rev Neurosci. 2007;8(10):790–802. Epub 2007/09/21. doi: 10.1038/nrn2215 . - DOI - PubMed
    1. Taghert PH, Nitabach MN. Peptide neuromodulation in invertebrate model systems. Neuron. 2012;76(1):82–97. Epub 2012/10/09. doi: 10.1016/j.neuron.2012.08.035 ; PubMed Central PMCID: PMC3466441. - DOI - PMC - PubMed
    1. Sehgal A, Price J, Young MW. Ontogeny of a biological clock in Drosophila melanogaster. Proc Natl Acad Sci U S A. 1992;89(4):1423–7. Epub 1992/02/15. doi: 10.1073/pnas.89.4.1423 ; PubMed Central PMCID: PMC48463. - DOI - PMC - PubMed
    1. Helfrich-Forster C. The neuroarchitecture of the circadian clock in the brain of Drosophila melanogaster. Microsc Res Tech. 2003;62(2):94–102. Epub 2003/09/11. doi: 10.1002/jemt.10357 . - DOI - PubMed
    1. Shafer OT, Helfrich-Forster C, Renn SC, Taghert PH. Reevaluation of Drosophila melanogaster’s neuronal circadian pacemakers reveals new neuronal classes. J Comp Neurol. 2006;498(2):180–93. Epub 2006/07/21. doi: 10.1002/cne.21021 ; PubMed Central PMCID: PMC2596765. - DOI - PMC - PubMed

MeSH terms

LinkOut - more resources