. 2024 Oct 18;103(42):e40112.
doi: 10.1097/MD.0000000000040112.

A bibliometric analysis and typology of drug pricing policies across the globe

Affiliations

A bibliometric analysis and typology of drug pricing policies across the globe

Abdrahmane Berthe et al. Medicine (Baltimore). .

Abstract

Background: Limited research exists on pricing policies from a bibliometric and visualization perspective, and there is a lack of understanding of their typology. This study aims to address these gaps in knowledge and provide a deeper understanding of the research topics and development trends in this field.

Methods: A bibliometric study was conducted on drug pricing approaches in healthcare literature, published between 2000 and June 2023. The literature was identified through an extensive search of healthcare databases and was then classified based on the year of publication, research topics, corresponding authors, location of corresponding authors, and journal titles. The citation data analysis was conducted using Bibliometrix, which consisted of descriptive, geographical, and time-series analyses and visualization.

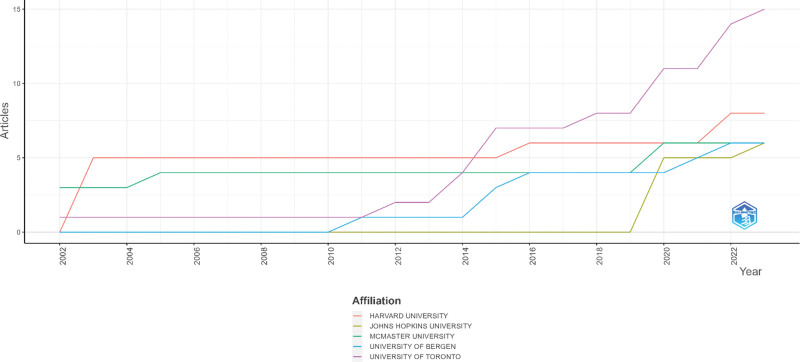
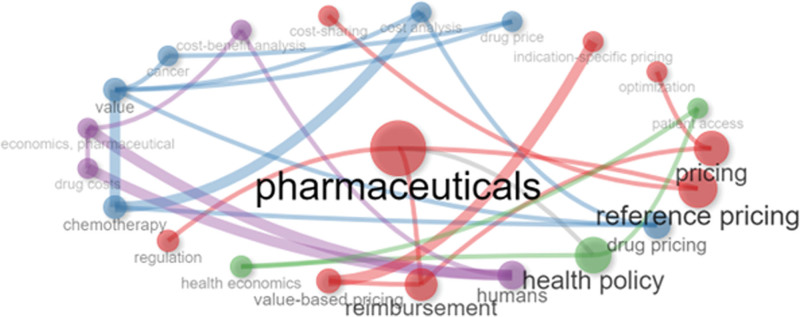
Results: Between 2000 and June 2023, 173 articles were disseminated across 98 distinct publication sources. During the analysis, we observed a significant and consistent rise in literature reports on drug pricing approaches in healthcare, especially in 2010. The research topics were distributed almost equally, discussing improvement or issues with drug pricing models and addressing drug pricing applications. Our analysis revealed that the top ten corresponding authors were responsible for 19% of the total articles, with those based in the United States being the most productive. Furthermore, the "Health Economics" journal ranked first among the top ten journals. These findings align with the overall publication trends of drug pricing methods reported in other fields.

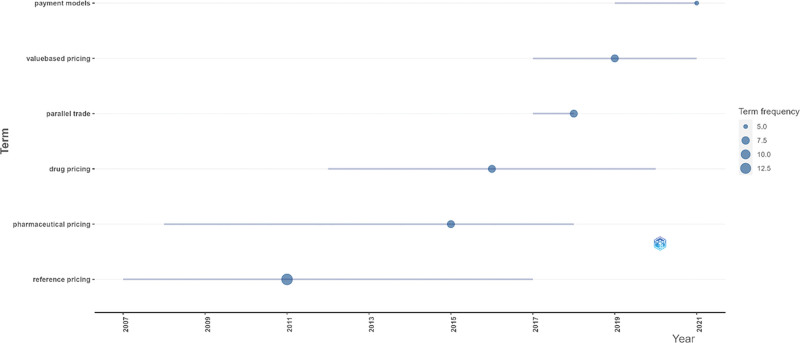
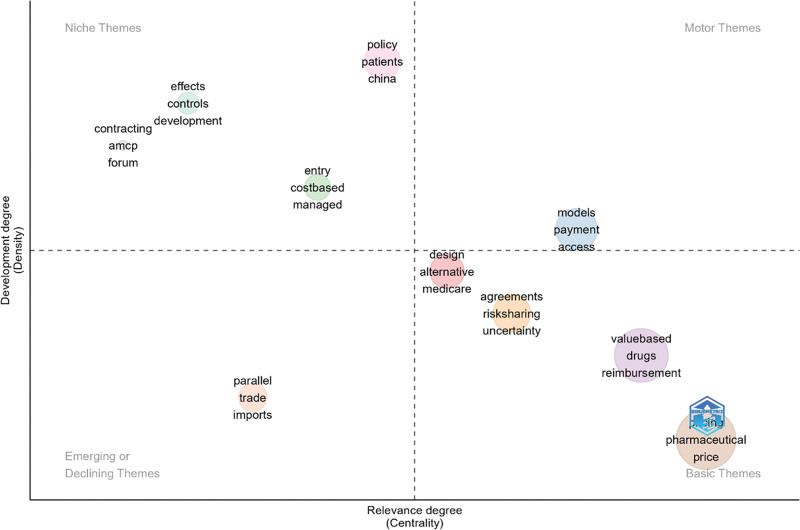
Conclusions: The current study offers a comprehensive overview of drug pricing techniques utilized in medicine through visualization and bibliometric techniques. Analysis of authors, journals, institutions, and countries could serve as a reference for new researchers and guide them differently. Researchers can also consider emerging trends when determining the focus of their studies.


Conflict of interest statement

AB is an employee of Health Economics & Policy Analysis Group (HEPAG) and was a paid consultant to Otsuka Pharmaceutical Development and Commercialization about the development of this manuscript. IE is affiliated with Health Economics & Policy Analysis Group (HEPAG). AK and VD are employees of Otsuka. AK and VD have no conflicts of interest that are directly relevant to the content of this article.

Figures

Figure 1.
Figure 1.
Flow chart of literature search and article selection following the PRISMA recommendations. The diagram illustrates the systematic filtering of records from initial identification through databases and gray literature to the final inclusion of studies in the review.
Figure 2.
Figure 2.
Average annual publications. The line graph illustrates the trends in the average annual number of publications related to drug pricing policies from 2002 to 2022. X-axis (Year): Represents the years from 2002 to 2022. Y-axis (Articles): Represents the number of articles published each year.
Figure 3.
Figure 3.
Core sources by Bradford laws. Papers are distributed among journals according to Bradford’s Law, which highlights the principal sources in drug pricing policy research. The graph delineates a log-ranked compilation of journals, with the shaded region indicating the “Core Sources” that have published the highest number of articles on the subject.
Figure 4.
Figure 4.
Journal production over time. The line graph shows the cumulative publication trends across key journals from 2002 to 2022. X-axis (Year): Represents the timeline from 2002 to 2022. Y-axis (Cumulative Occurrences): Indicates the cumulative count of publications in each journal over the years. Lines: Each line represents a different journal.
Figure 5.
Figure 5.
Author’s production over time. The horizontal timeline chart portrays the publication output of various authors on drug pricing policies from 2002 to 2022. X-axis (Year): Represents the years from 2002 to 2022. Y-axis (Author): Lists the authors vertically along the y-axis. Circle Size: Each circle’s size correlates with the number of articles published by the author in that year. Larger circles denote more publications. Color Intensity (TC per Year): The color intensity of each circle indicates the total citations received per year, with darker shades representing higher citation counts.
Figure 6.
Figure 6.
Affiliation production over time. The line graph illustrates the publication output of leading academic institutions in drug pricing policies from 2002 to 2022. X-axis (Year): Represents the timeline from 2002 to 2022. Y-axis (Articles): Indicates the number of articles each institution publishes annually. Lines: Each line represents a different institution.
Figure 7.
Figure 7.
Average annual citation. The line graph displays the average annual citations of articles on drug pricing policies from 2002 to 2022. X-axis (Year): Represents the timeline from 2002 to 2022. Y-axis (Citations): Indicates the average number of citations articles receive each year.
Figure 8.
Figure 8.
Co-citation networks. Co-citation network of pivotal research on drug price strategies, emphasizes the most prominent authors and their interrelations. Nodes signify publications, scaled by their citation impact, whereas colored edges illustrate co-citations’ intensity and thematic characteristics. Works by Brekke KR serve as important nodes, signifying substantial effects on subsequent research. Nodes: Each node represents an author and their respective publication year, with the node size reflecting the frequency of co-citations. Lines (Edges): Connections between nodes represent co-citation links, with line thickness indicating the strength of the co-citation relationship. Colors: Different colors represent distinct clusters of co-cited works, suggesting thematic connections within the network.
Figure 9.
Figure 9.
The country’s scientific production. World map displays the distribution of scientific production in drug pricing research by country from 2000 to 2022. Dark Blue: High concentration of research output, indicating a larger volume of publications. Light Blue: Moderate concentration of research output. Very Light Blue: Lower concentration of research output. Gray: Minimal or no data available for these regions.
Figure 10.
Figure 10.
Corresponding author’s country. The bar graph shows the distribution of publications on drug price policies from 2000 to 2022, broken down by the associated author’s country. The number of documents produced by authors from each nation is shown by the X-axis (N. of Documents). The countries shown on the Y-axis (Countries) are home to the respective writers. Red Bars: Show research involving authors from several nations and indicate multi-country collaborations. Teal Bars: Denote articles that were only published in one country, signifying research that was done there. Abbreviations: SCP stands for single country publishing; MCP stands for multiple nations’ publication.
Figure 11.
Figure 11.
Co-occurrence network. The core node “pharmaceuticals” denotes its significance in the discussion. Nodes signify keywords, whereas edges denote the frequency of co-occurrence in the literature. Cluster colors signify theme categories: blue for economic assessments, red for pricing methods, and green for health policy implications. This visualization emphasizes critical study areas and the interrelations among drug pricing’s economic, regulatory, and policy aspects. Central Node (“pharmaceuticals”): Represents the most frequently occurring keyword around which other terms cluster. Nodes: Each node represents a keyword, with the size indicating the frequency of occurrence in the literature. Lines (Edges): Lines connecting the nodes represent the co-occurrence of two keywords in the same documents. The thickness of the lines indicates the strength of the co-occurrence relationship.
Figure 12.
Figure 12.
Trend topic. The horizontal timeline illustrates the frequency and evolution of key terms in drug pricing research from 2007 to 2021. X-axis (Year): Represents the timeline from 2007 to 2021. Y-axis (Term): Lists key research topics in drug pricing. Circle Size: Indicates the frequency of each term’s appearance in the literature over time. Larger circles denote higher term frequency. Term Frequency: The visual scale of term frequency ranges from less common (smaller circles) to most common (larger circles).
Figure 13.
Figure 13.
Title thematic map. A thematic map illustrates the centrality and density of topics within drug pricing research. The map categorizes topics into four quadrants: basic themes, niche themes, emerging or declining themes, and motor themes, based on their relevance and developmental degree within the field. X-axis (Relevance degree - Centrality): Indicates the centrality or importance of the themes within the research field. Y-axis (Development degree - Density): This represents the level of internal development and cohesion among the studies related to each theme. Top-Right (Motor Themes): Highly central and well-developed themes driving the research field forward. Top-Left (Niche Themes): Themes that are less central but well-developed, often specialized or emerging areas. Bottom-Right (Basic Themes): Fundamental and central themes with less development, representing established knowledge areas. Bottom-Left (Emerging or Declining Themes): Themes with lower centrality and development may be losing prominence or just beginning to emerge.
Figure 14.
Figure 14.
Publication trend by research topic. Pie chart illustrating the distribution of research topics within drug pricing studies analyzed from 2000 to 2022.

References

    1. Ecorys B. Competitiveness of the EU market and industry for pharmaceuticals. Volume II: Markets, Innovation & Regulation, European Commission, Directorate General Enterprise & Industry. 2009.
    1. Abboud C, Berman E, Cohen A, et al. . The price of drugs for chronic myeloid leukemia (CML) is a reflection of the unsustainable prices of cancer drugs: from the perspective of a large group of CmL experts. Blood. 2013;121:4439–42. - PMC - PubMed
    1. Antoñanzas F, Terkola R, Postma M. The value of medicines: a crucial but vague concept. PharmacoEcon. 2016;34:1227–39. - PubMed
    1. Josselin J-M, Rachet Jacquet L, Raimond V, Rochaix L. Drug price regulation. In: Marciano A, Ramello GB, eds. Encyclopedia of Law and Economics. Springer New York; 2017:1–8.
    1. Acosta A, Ciapponi A, Aaserud M, et al. . Pharmaceutical policies: effects of reference pricing, other pricing, and purchasing policies. Cochrane Database Syst Rev. 2014;2014:CD005979. - PMC - PubMed

LinkOut - more resources