. 2024 Oct 29;121(44):e2402637121.
doi: 10.1073/pnas.2402637121. Epub 2024 Oct 21.

The Greenland spatial fingerprint of Dansgaard-Oeschger events in observations and models

Affiliations

The Greenland spatial fingerprint of Dansgaard-Oeschger events in observations and models

Christo Buizert et al. Proc Natl Acad Sci U S A. .

Abstract

Pleistocene Ice Ages display abrupt Dansgaard-Oeschger (DO) climate oscillations that provide prime examples of Earth System tipping points-abrupt transition that may result in irreversible change. Greenland ice cores provide key records of DO climate variability, but gas-calibrated estimates of the temperature change magnitudes have been limited to central and northwest Greenland. Here, we present ice-core δ15N-N2 records from south (Dye 3) and coastal east Greenland (Renland) to calibrate the local water isotope thermometer and provide a Greenland-wide spatial characterization of DO event magnitude. We combine these data with existing records of δ18O, deuterium excess, and accumulation rates to create a multiproxy "fingerprint" of the DO impact on Greenland. Isotope-enabled climate models have skill in simulating the observational multiproxy DO event impact, and we use a series of idealized simulations with such models to identify regions of the North Atlantic that are critical in explaining DO variability. Our experiments imply that wintertime sea ice variation in the subpolar gyre, rather than the commonly invoked Nordic Seas, is both a sufficient and a necessary condition to explain the observed DO impacts in Greenland, whatever the distal cause. Moisture-tagging experiments support the idea that Greenland DO isotope signals may be explained almost entirely via changes in the vapor source distribution and that site temperature is not a main control on δ18O during DO transitions, contrary to the traditional interpretation. Our results provide a comprehensive, multiproxy, data-model synthesis of abrupt DO climate variability in Greenland.

Keywords: Dansgaard–Oeschger cycle; Greenland; ice cores; paleoclimate; water isotopes.


Conflict of interest statement

Competing interests statement:The authors declare no competing interest.

Figures

Fig. 1.
Fig. 1.
Ice-core records of abrupt Dansgaard–Oeschger (DO) variability from the Renland and Dye 3 cores. (A) Renland δ18O. (B) Renland deuterium excess. (C) Renland δ15N (black dots) with firn densification model fit (violet). (D) Dye 3 δ18O. (E) Dye 3 deuterium excess. (F) Dye 3 δ15N (black dots) with firn densification model fit (fuchsia). (G) Greenland ice cores used in this study are Camp Century (CC), North Greenland Eemian Ice Drilling (NEEM), North Greenland Ice Core Project (NGRIP), Greenland Ice Core Project (GRIP), Greenland Ice Sheet Project 2 (GISP2), Dye 3, and Renland. Blue vertical shading denotes DO interstadials, with major interstadials numbered at the top; the vertical dashed line shows Heinrich Stadial 1 (HS1) onset.
Fig. 2.
Fig. 2.
Spatial fingerprint of abrupt DO warming in Greenland. (A) Change in surface temperature during a DO transition as simulated by the fully coupled iCESM1 model (background) and as derived from ice-core data (dots). (B) Change in surface temperature during a DO transition in a model-data comparison at five ice-core locations. The gray bars denote the ±1σ SD of the observations. (C) and (D) as panels (A) and (B), but for the change in precipitation δ18O. (E) and (F) as panels (A) and (B), but for the temporal isotope sensitivity α. (G) and (H) as panels (A) and (B), but for deuterium excess. (I) and (J) as panels (A) and (B), but for the interstadial-over-stadial ratio in snow accumulation rates. The five ice-core sites listed are Dye 3 (D3), Summit (SU, the average of GRIP and GISP2), NGRIP (NG), NEEM (NM), and Renland (RE).
Fig. 3.
Fig. 3.
Idealized climate model experiments of DO impact on Greenland. (A) Seas surrounding Greenland: Arctic Ocean (Arc), Baffin Bay (Baf), Labrador Sea (Lab), Greenland Sea (Gre), Iceland Sea (Ice), Irminger Sea (Irm), Norwegian Sea (Nor), and subpolar gyre (SPG). Simulated winter sea-ice edge (contour of 15% annual-mean SIC) for the LGM control run (black, dot-dashed), CESM1 stadial (blue dashed), CESM1 interstadial (blue solid), HadCM3 stadial (orange, dashed), and HadCM3 interstadial (orange, solid). (B) SIC and SST forcing in four representative idealized experiments (color coded). Indicated are changes relative to the LGM control. SIC anomalies reflect either adding (+) or removing (−) sea ice in the indicated marginal seas. (C) Change in surface temperature (ΔT) during a DO transition in a model-data comparison at five ice-core locations. Black square markers show the data, round markers four idealized iCAM5 experiments, color-coded as per panel (B). (D) As panel (C), but for the change in δ18O (Δδ18O). (E) As panel (C), but for the change in deuterium excess (Δd). (F) As panel (C), but for the ratio of interstadial over stadial snow accumulation rates. Ice-core acronyms as in Fig. 2.
Fig. 4.
Fig. 4.
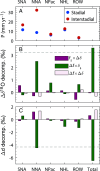
Decomposition of Greenland isotope signals at Summit in the idealized iCAM5 DO_SPG experiment using moisture tagging. (A) Precipitation amounts contributed by tagged regions under stadial and interstadial conditions. SNA = southern North Atlantic, NNA = northern North Atlantic, NPac = North Pacific, NHL = Northern Hemisphere Land, ROW = rest of the world. (B) Decomposition of the change in δ18O at Greenland Summit. (C) Decomposition of the change in deuterium excess at Greenland Summit.

References

    1. Robinson A., Calov R., Ganopolski A., Multistability and critical thresholds of the Greenland ice sheet. Nat. Clim. Change. 2, 429–432 (2012).
    1. deMenocal P., et al. , Abrupt onset and termination of the African Humid Period: Rapid climate responses to gradual insolation forcing. Quat. Sci. Rev. 19, 347–361 (2000).
    1. Armstrong McKay D. I., et al. , Exceeding 1.5°C global warming could trigger multiple climate tipping points. Science 377, eabn7950 (2022). - PubMed
    1. Dansgaard W., et al. , Evidence for general instability of past climate from a 250-kyr ice-core record. Nature 364, 218–220 (1993).
    1. Birner B., Hodell D. A., Tzedakis P. C., Skinner L. C., Similar millennial climate variability on the Iberian margin during two early Pleistocene glacials and MIS 3. Paleoceanography 31, 203–217 (2016).

LinkOut - more resources