. 2024 Oct 29;121(44):e2416097121.
doi: 10.1073/pnas.2416097121. Epub 2024 Oct 21.

CD4 T cells restricted to DRB1*15:01 recognize two Epstein-Barr virus glycoproteins capable of intracellular antigen presentation

Affiliations

CD4 T cells restricted to DRB1*15:01 recognize two Epstein-Barr virus glycoproteins capable of intracellular antigen presentation

Natalia Drosu et al. Proc Natl Acad Sci U S A. .

Abstract

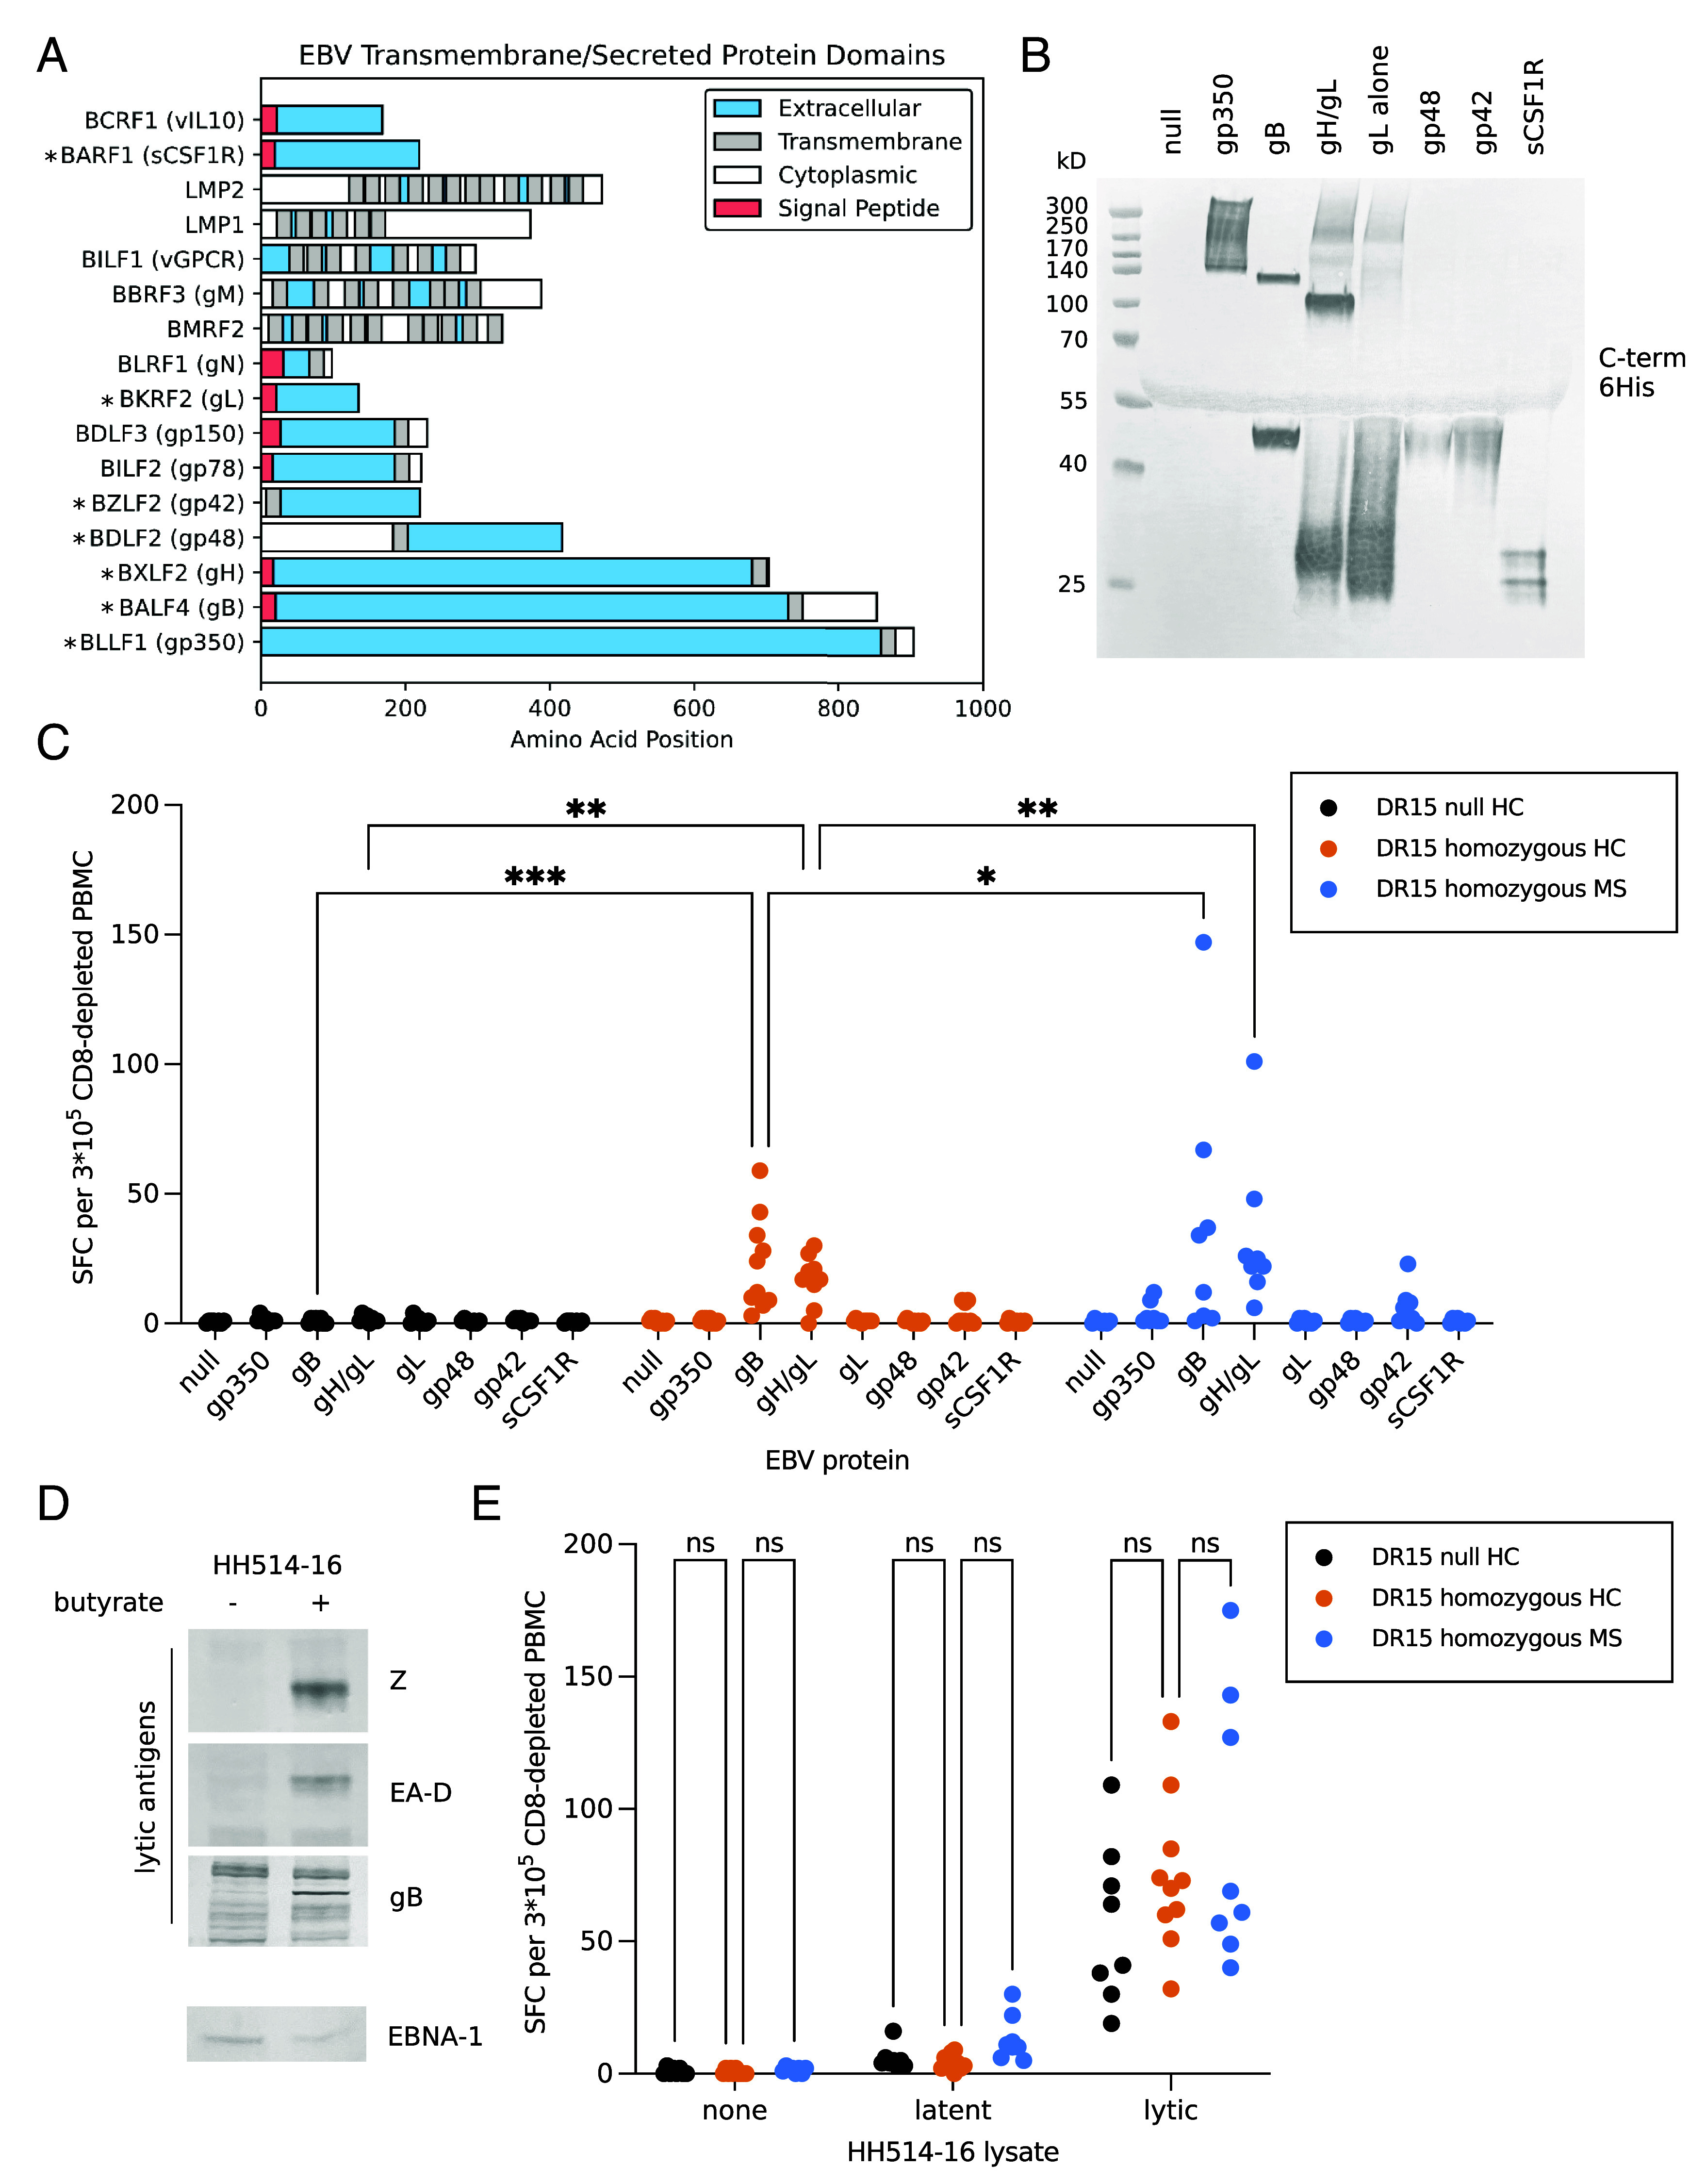
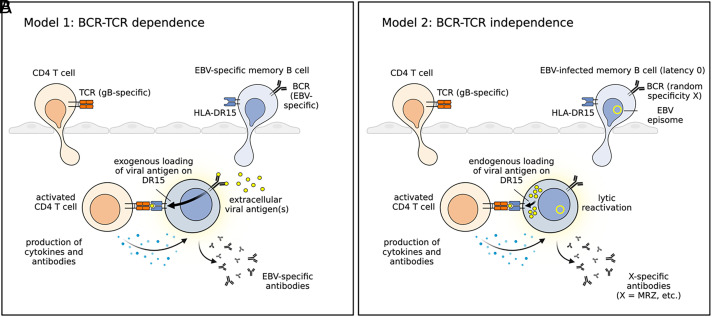
Both genetic and environmental factors contribute to multiple sclerosis (MS) risk. Infection with the Epstein-Barr virus (EBV) is the strongest environmental risk factor, and HLA-DR15 is the strongest genetic risk factor for MS. We employed computational methods and in vitro assays for CD4 T cell activation to investigate the DR15-restricted response to EBV. Using a machine learning-based HLA ligand predictor, the EBV glycoprotein B (gB) was predicted to be enriched in epitopes restricted to presentation by DRB1*15:01. In DR15-positive individuals, two epitopes comprised the major CD4 T cell response to gB. Surprisingly, the expression of recombinant gB in a DR15-homozygous B cell line or primary autologous B cells elicited a CD4 T cell response, indicating that intracellular gB was loaded onto HLA class II molecules. By deleting the signal sequence of gB, we determined that this pathway for direct activation of CD4 T cells was dependent on trafficking to the endoplasmic reticulum (ER) within the B cell. We screened seven recombinant EBV antigens from the ER compartment for immune responses in DR15-negative vs. DR15-homozygous individuals. In addition to gB, gH was a key CD4 T cell target in individuals homozygous for DR15. Compared to non-DR15 controls, DR15-homozygotes had significantly higher T cell responses to both gB and gH but not to EBV latent or lytic antigens overall. Responses to gB and gH were slightly elevated in DR15 homozygotes with MS. Our results link MS environmental and genetic risk factors by demonstrating that HLA-DR15 dictates CD4 T cell immunity to EBV antigens.

Keywords: Epstein–Barr virus; HLA-DR15; antivirals; multiple sclerosis.


Conflict of interest statement

Competing interests statement:The authors declare no competing interest.

Figures

Fig. 1.
Fig. 1.
Predicted EBV epitopes contain more MS risk allele-associated outliers for DRB1*15 than DRB5*01 alleles, and gB (BALF4) is preferentially predicted to be presented by DRB1*15:01. (A) Comparison of predicted EBV epitope odds scores for HLA-DRB1*15:01, which is associated with MS risk, versus *15:02. Each epitope is designated by the first three amino acids of the predicted 9-mer core. The diameter of each point demarking an epitope is directly proportional to the number of peptides with the same core. (B) Comparison of predicted EBV epitope odds scores as in A, except considering HLA alleles DRB5*01:01 versus *01:02 instead. (C) Cumulative odds scores grouped by EBV protein for DRB1*15:01 versus *15:02 alleles. Each point is annotated with the gene name. (D) Cumulative odds scores grouped by EBV protein for DRB5*01:01 versus *01:02 alleles. (E) The cumulative EBV glycoprotein B (gB) score for 131 HLA-DRB alleles with available peptide predictions. Alleles are displayed numerically from left to right, and the top seven alleles are annotated.
Fig. 2.
Fig. 2.
Predicted gB peptides demonstrate CD4 T cell responses in individuals with DR15 and are naturally processed from recombinant gB protein. (A) Flow cytometric evaluation for CD4 enrichment of total CD3 T cells after magnetic bead-based depletion of cells expressing CD8, CD56, CD19, CD123, CD235a, and TCRγδ from whole PBMCs. (B) ELISPOT assays for IFNγ using 1 × 10⁶ CD4-enriched PBMCs from five DR15-heterozygous donors. Responses were evaluated to triplex capsid antigen (BORF1) 289–302 and to the predicted gB (BALF4) peptides (a.a. 103–116 and 599–613). CD3/CD28 beads were used as a positive control on an aliquot of remaining cells. Assays were run in duplicate, and representative images are shown. (C) Quantification of part (B). (D) Schematic of the coding region of the gB full-length protein (BALF4) showing the signal sequence (SS) in red, extracellular domain in blue, transmembrane domain (TM) in gray and cytoplasmic domain in white. A second construct encoding the ectodomain is shown below with a C-terminal His-tag and a CD5 signal sequence (BALF4-ecto). (E) Western blot analysis of HEK293T cell lysates and supernatant collected 72 h. after transfection with pcDNA3.1-null, BALF4, or BALF4-ecto vectors. Blots were probed with a rabbit polyclonal antibody raised against gB. Arrows mark full-length and furin-cleaved gB. (F) ELISPOT assays for IFNγ as in part B using supernatants collected from the null and BALF4-ecto transfected HEK293T cells from part (E). (G) Quantification of mean responses from F versus B. Each point represents one individual. (H) Western blot of cell lysate from the DR15-homozygous B cell line SUDHL-4 probed with an anti-DRB1 antibody. Β-actin was used as a loading control. (I) ELISPOT assays for IFNγ using freshly isolated CD4 T cells from donor DR15-1 alone, SUDHL-4 cells alone, or both mixed with DMSO or peptides, as indicated. All assays were run in duplicate, and representative images are shown. (J) ELISPOT assays for IFNγ, as in part I, using CD4 T cells prepared from donor DR15-2.
Fig. 3.
Fig. 3.
Protein expression in APCs is sufficient for activating gB-reactive CD4 T cells but not triplex capsid protein-reactive T cells and depends on entry into the endoplasmic reticulum. (A) Schematic of constructs encoding the coding region of full-length gB (BALF4), truncated gB missing the transmembrane domain (BALF4ΔTM), a C-terminal HA-tagged gB ectodomain with a CD5 signal sequence (BALF4-ecto), and without a signal sequence (BALF4-ectoΔSS). These constructs were designed for insertion into pcDNA3.1 vector for expression in mammalian cells. (B) As in A, schematic of the coding region of the triplex capsid subunit (BORF1) full-length protein with a C-terminal HA tag, with the addition of the BALF4 signal sequence (SS-BORF1), and with a C-terminal human LAMP1 endosome sorting signal (SS-BORF1-LAMP1). (C) Western blot of SUDHL-4 cell lysates from cells electroporated with null, BALF4, or BALFΔTM plasmids. Cells were harvested 16 h after electroporation, and blots were probed with an anti-gB polyclonal antibody (indicated by arrows). B-actin was used as a loading control. (D) Western blot as in C using plasmids encoding null, BALF4-ecto, or BALF4-ectoΔSS constructs. Blots were probed with an anti-HA antibody. (E) Western blot as in C for plasmids encoding null, BORF1, SS-BORF1, or SS-BORF1-LAMP1 constructs. Blots were probed with an anti-HA antibody. (F) Flow cytometric evaluation of electroporation efficiency for SUDHL-4 cells expressing GFP (channel 1) 16 h after electroporation with a pcDNA3.1-GFP vector versus nonspecific channel 3. (G) Quantification of ELISPOT assays for IFNγ using freshly isolated CD4 T cells from donor DR15-1 in combination with SUDHL-4 cells 16 h after electroporation with each construct as indicated. Each bar represents the mean and SD obtained from three independent experiments. One-way ANOVA (P < 0.05) was followed by multiple hypothesis testing between the five groups indicated. Statistical significance is highlighted by P values: *P < 0.05, **P < 0.01, ****P < 0.0001, ns: nonsignificant. (H) Quantification of ELISPOT and analysis as in G using freshly isolated CD4 T cells from donor DR15-2. (I) Quantification of ELISPOT assays for IFNγ using freshly isolated CD4 T cells from donor DR15-2 in combination with autologous primary B cells 16 h after electroporation with pcDNA3.1-null or BALF4 plasmid. Each bar represents the mean and SD obtained from three independent experiments. P values highlight statistical significance: **P < 0.01.
Fig. 4.
Fig. 4.
The ER-resident domains of gB and gH elicit higher immune responses in DR15-homozygous individuals than in non-DR15 individuals. (A) Schematic of the EBV-encoded transmembrane and secreted proteins that can access the ER compartment. Signal peptides are shown in red, extracellular domains (intra-ER) in blue, cytoplasmic domains in white, and transmembrane regions in gray. Proteins marked with an asterisk were selected for recombinant ectodomain production in HEK-293T cells. (B) Western blot of the seven C-His tagged recombinant protein ectodomains selected from part A produced in HEK-293T cells. Blots were probed with an antibody recognizing the C-terminal His tag. (C) Quantification of ELISPOT assays for IFNγ using CD8-depleted PBMCs from 8 DR15-null healthy donors, 10 DR15-homozygous healthy donors, and 8 DR15-homozygous donors with MS. Responses to each recombinant EBV antigen were assayed after 18 h. Two-way ANOVA (P < 0.05) was followed by comparing responses between either healthy controls (DR15 null versus DR15 homozygous) or DR15 homozygotes (healthy controls versus MS) without correction for multiple hypothesis testing. Those reaching statistical significance are displayed and highlighted by P values: *P < 0.05, **P < 0.01, ***P < 0.001 (D) Western blot analysis of HH514-16 cell lysates from latent or lytic cells induced with 3 mM sodium butyrate for 72 h. Blots were probed with EBV ZEBRA (Z), EA-D, and gB antibodies. (E) Quantification ELISPOT assays as in C using lysates from part (D). Responses to either media alone, latent antigens, or lytic antigens from HH514-16 cell lysates were assayed after 18 h. Two-way ANOVA (P < 0.05) was followed by comparing specific groups of interest indicated on graph, without correction for multiple hypothesis testing; ns: nonsignificant.
Fig. 5.
Fig. 5.
A proposed model for nonclassical direct activation of CD4 T cells by EBV-infected B cells acting as APCs. (A) In the classical model, memory B cells can internalize gB from the extracellular space via their BCR, with subsequent processing and presentation of a gB peptide on HLA-DR15. CD4 T cells would then recognize the antigen via a gB peptide-specific TCR and activate the B cell for plasma cell differentiation to produce an EBV-specific antibody. (B) In a nonclassical model, CD4 T cells can be activated directly by EBV-infected B cells endogenously expressing gB—for example, during lytic reactivation from latency. In this model, the antigen would be endogenously loaded onto HLA-DR15, breaking the TCR's dependence on the BCR. Memory B cells receiving CD4 T cell help may instead produce a random antibody with specificity X, which matches the BCR of the EBV-infected B cell. One such possibility for X would be MRZ (measles—M, rubella—R, or varicella zoster—Z), one of the most specific tests for MS.

Comment in

References

    1. Bjornevik K., et al. , Longitudinal analysis reveals high prevalence of Epstein–Barr virus associated with multiple sclerosis. Science 375, 296–301 (2022). - PubMed
    1. Vietzen H., et al. , Ineffective control of Epstein–Barr-virus-induced autoimmunity increases the risk for multiple sclerosis. Cell 186, 5705–5718.e13 (2023). - PubMed
    1. Lanz T. V., et al. , Clonally expanded B cells in multiple sclerosis bind EBV EBNA1 and GlialCAM. Nature 603, 321–327 (2022), 10.1038/s41586-022-04432-7. - DOI - PMC - PubMed
    1. Tengvall K., et al. , Molecular mimicry between Anoctamin 2 and Epstein–Barr virus nuclear antigen 1 associates with multiple sclerosis risk. Proc. Natl. Acad. Sci. U.S.A. 116, 16955–16960 (2019). - PMC - PubMed
    1. Thomas O. G., et al. , Cross-reactive EBNA1 immunity targets alpha-crystallin B and is associated with multiple sclerosis. Sci. Adv. 9, eadg3032 (2023). - PMC - PubMed

MeSH terms

LinkOut - more resources