. 2024 Oct 21;15(1):9084.
doi: 10.1038/s41467-024-52914-1.

Non-averaged single-molecule tertiary structures reveal RNA self-folding through individual-particle cryo-electron tomography

Affiliations

Non-averaged single-molecule tertiary structures reveal RNA self-folding through individual-particle cryo-electron tomography

Jianfang Liu et al. Nat Commun. .

Abstract

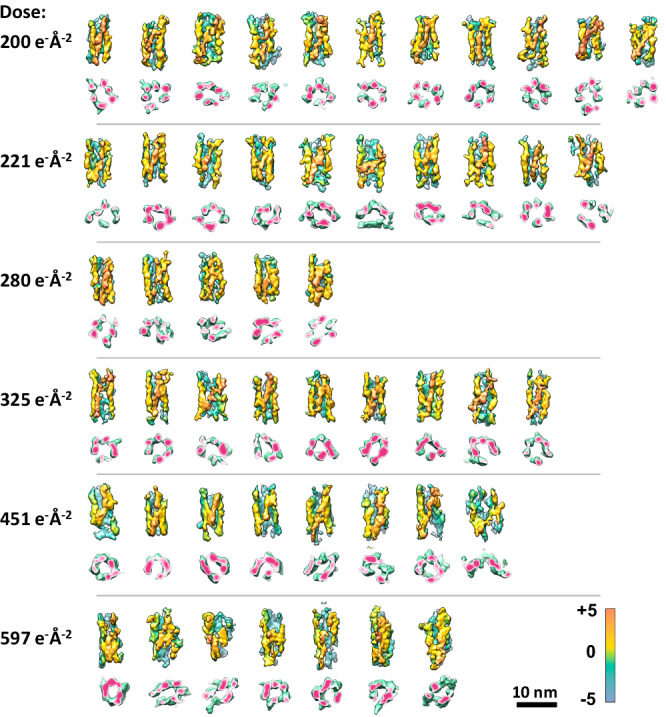
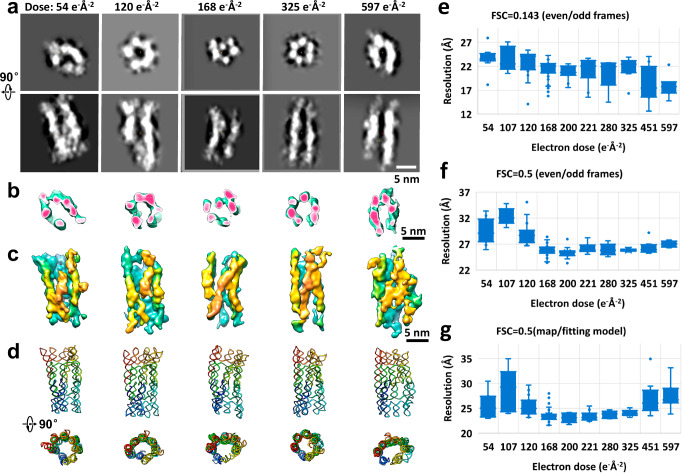
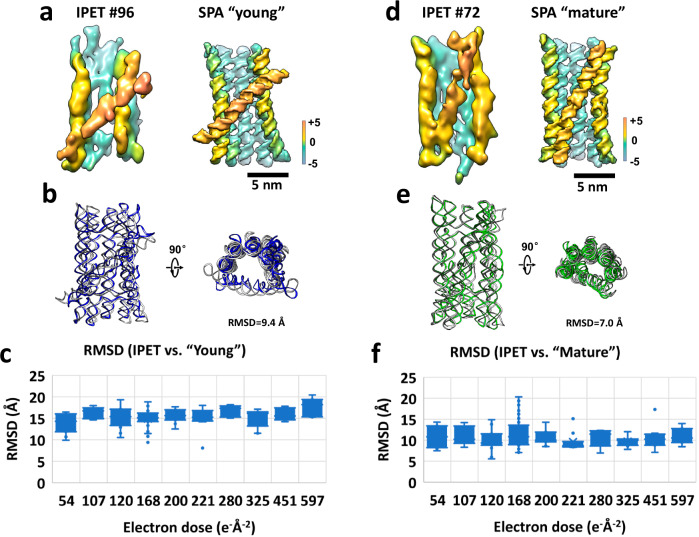
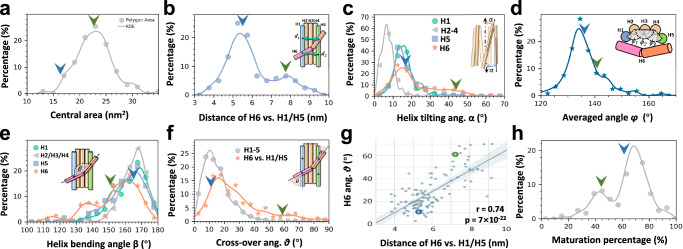
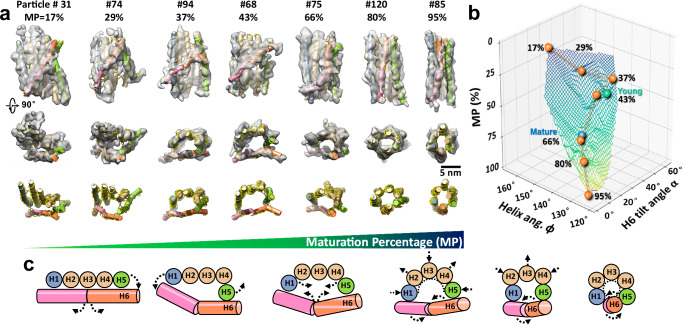
Large-scale and continuous conformational changes in the RNA self-folding process present significant challenges for structural studies, often requiring trade-offs between resolution and observational scope. Here, we utilize individual-particle cryo-electron tomography (IPET) to examine the post-transcriptional self-folding process of designed RNA origami 6-helix bundle with a clasp helix (6HBC). By avoiding selection, classification, averaging, or chemical fixation and optimizing cryo-ET data acquisition parameters, we reconstruct 120 three-dimensional (3D) density maps from 120 individual particles at an electron dose of no more than 168 e-Å-2, achieving averaged resolutions ranging from 23 to 35 Å, as estimated by Fourier shell correlation (FSC) at 0.5. Each map allows us to identify distinct RNA helices and determine a unique tertiary structure. Statistical analysis of these 120 structures confirms two reported conformations and reveals a range of kinetically trapped, intermediate, and highly compacted states, demonstrating a maturation folding landscape likely driven by helix-helix compaction interactions.


Conflict of interest statement

The authors declare no competing interests.

Figures

Fig. 1
Fig. 1. RNA origami folding process and EM images.
a A schematic illustrating the transcriptional folding and maturation processes of an RNA origami 6-helix bundle with clasp (6HBC). Cryo-ET grids were prepared six hours after transcription, as indicated by the purple triangle. b Two subnanometer-resolution structures of 6HBC, “young” (7PTK) and “mature” (7PTL), determined by the cryo-EM single-particle averaging (SPA) analysis method. The structures are colored from 5′ (blue) to 3′ (red), with arrows indicating the proposed self-folding maturation mechanism. c A survey cryo-EM image of the RNA 6HBC sample. d Twenty-four representative particles. e Zoomed-in images of four representative particles, including two top views showing helical bundles in open and closed conformations, and two side views showing the conformations in open and closed stages. f A survey NS-EM image of the same sample. g Twenty-four representative particles. h Zoomed-in images of four representative particles showing the open and closed conformations from two perpendicular views.
Fig. 2
Fig. 2. The effect of electron dose on cryo-EM images of 6HBC RNA particles.
a A sample area was sequentially imaged with a dose of 50 eÅ−2 for 20 iterations. The images correspond to radiation damage with an accumulated dose of 50, 100, 150, and up to 1000 eÅ−2, respectively. b Zoomed-in images of 23 representative areas containing particles. c Fourier ring correlation (FRC) curves showing the effects of radiation damage, with each curve calculated by comparing the first image (50 eÅ−2) against the subsequent images. d A plot of FRC frequencies at FRC = 0.5 and 0.143, respectively, against their corresponding radiation doses.
Fig. 3
Fig. 3. IPET 3D reconstruction and fitting model of an individual particle achieved at a dose of 168 eÅ−2.
a A schematic introducing the cryo-ET and 3D reconstruction methods. b The 3D reconstruction process of an individual particle by cryo-ET and IPET from a total electron dose of 168 eÅ−2, displayed from seven represented tilting directions. c The final 3D map viewed from two perpendicular directions. d Central slices of 3D reconstruction intermediate viewed from two perpendicular directions, comparing the stages before and after the application of soft masks and noise reduction during 3D reconstruction, and after missing-wedge (MW) correction and low-pass filtering to 8 Å. e Central slices of the final 3D map generated from two perpendicular directions. f The resolution measured by FSC curves of two half-maps reconstructed using even-odd frames (solid line) and tilt angle (dashed line) at FSC = 0.5 and 0.143, respectively. g The resolution estimated by FSC curves computed between the final map and its fitting model-generated map at FSC = 0.5. h The fitting model in the map is demonstrated by its central cross-section. i The 3D map with the fitting model viewed from 12 directions (rotated every 30° along the vertical axis).
Fig. 4
Fig. 4. A gallery of 120 IPET 3D reconstructions and corresponding fitting models of RNA origami 6HBC.
a A total of 85 IPET 3D density maps were reconstructed at a total electron dose of 168 eÅ−2. b Nineteen maps reconstructed at a dose of 120 eÅ−2. c Five maps reconstructed at a dose of 107 eÅ−2. d Eleven maps reconstructed at a dose of 54 eÅ−2. e, f Two representative young-like particles with their fitted models, displayed from three viewing directions. g, h Two representative mature-like particles with their fitted models, viewed from three directions. i The fitted models of the corresponding particles shown in (ad) are displayed from two perpendicular views. The sequence order is color-coded in a rainbow pattern.
Fig. 5
Fig. 5. A gallery of 50 IPET 3D reconstructions of RNA origami 6HBC achieved at high doses in the range of 200–597 eÅ−2.
Eleven reconstructions were achieved at a dose of 200 eÅ−2, ten reconstructions at a dose of 221 eÅ−2, five reconstructions at a dose of 280 eÅ−2, nine reconstructions at a dose of 325 eÅ−2, eight reconstructions at a dose of 451 eÅ−2, and seven reconstructions at a dose of 597 eÅ−2. The central cross-sections of the 50 IPET 3D reconstructions are shown below their corresponding maps.
Fig. 6
Fig. 6. The effect of electron dose on IPET 3D reconstructions and their resolutions.
a Examples of IPET 3D reconstructions achieved at various total electron doses ranging from 54 to 597 e-Å-², with corresponding central slices shown (particles #10, 27, 67, 148, 165 from left to right panels). b The cross-sections of 3D reconstructions. c The 3D reconstructions. d The fitting models are viewed from two perpendicular directions, with rainbow-colored sequences indicating the order from the 5′ to 3′ end. eg Plots of the resolutions of IPET 3D maps against their acquired electron doses. The resolutions are estimated by three different methods/criteria. The data for these plots is shown in Supp. Table 1.
Fig. 7
Fig. 7. Representative IPET particles compared to two SPA structures.
a The IPET representative structure (particle #96, obtained at a dose of 168 e-Å−2) with a conformation similar to the SPA “young” conformation (obtained at a dose of 60 e-Å−2). b The superimposed “young” and IPET structures viewed from two perpendicular directions, with an RMSD of 9.4 Å. c The box plot of the mean RMSDs against the “young” structure, distributed based on the achieved electron dose. d A similar comparison of the IPET structure (particle #72, obtained at a dose of 168 e-Å−2) and the SPA “mature” conformation (obtained at a dose of 60 e-Å−2). e The superimposed “mature” and IPET structures viewed from two perpendicular directions, with an RMSD of 7.0 Å. f The box plot of the mean RMSDs against the “mature” structure, distributed based on the achieved electron dose.
Fig. 8
Fig. 8. The distributions of 6HBC conformations.
a Superimposition of 120 IPET structural models viewed from two perpendicular perspectives, with sequences color-coded in a rainbow gradient from the 5′ to 3′ end. b RMSD distribution of IPET structures in terms of they against the SPA structures of “young” (X-axis) and “mature” (Y-axis) conformations. c 2D hierarchical clustering tree diagram based on their RMSD values, using Ward’s minimum variance method (see Methods section). The RMSD is calculated between each pair of structures, including the two SPA structures (PDB IDs: 7PTK and 7PTL, corresponding to “young” and “mature” conformations) for comparison. The treemap illustrates the distances as the particle RMSD value relative to all others. Nine representative structures are shown alongside their corresponding indices. d 1D spectrum diagram from hierarchical clustering analysis of RMSD values. Structures obtained at a dose of 168 eÅ−2 are marked with black circles/rectangles (particles #36-120), those at 120 eÅ−2 in red (particles #17-35), at 107 eÅ−2 in cyan (particles #12–16), and at 54 eÅ−2 in yellow (particles #1–11). The “young” and “mature” conformations are labeled in “medium aquamarine” and “polo blue,” respectively. Particles highlighted by green and blue disks/rectangle were used for local subtomogram averaging tests (detailed in the Methods section).
Fig. 9
Fig. 9. Statistical analyses of the internal structural variety.
a A histogram of the helical bundle center area. b A histogram of the averaged distance d¯ of H6 against the H1 and H5, as indicated by distances d1 and d2. c A histogram of the helix tilting angle α relative to the bundle center axis. d. A histogram of the helical bundle angle φ, formed within H1–5. e Characterization of the curvature of the H6 helix by the bending angle β between its two halves. f A histogram of the crossover angle θ of H6 relative to its connected H1 or H5, compared to the crossover angle formed among the remaining helices. g A correlation analysis of the H6 crossover angle θ against the averaged H6 distance, d¯. h A histogram of the maturation percentage (MP, defined in the Method section). All measured data were fitted using kernel density estimation (KDE). The green and blue arrows/balls indicate the SPA determined “young” and “mature” conformations (PDB IDs: 7PTK and 7PTL), respectively.
Fig. 10
Fig. 10. A hypothesis of the 6HBC maturation self-folding process.
a Seven representative particles shown as 3D maps and tertiary models in the order of their maturation percentage (MP) values. The maps are displayed from two perpendicular directions with their fitting models, and the corresponding tertiary structures are shown in the bottom row. b A fitted curvy surface of the MP values distributed against bending angle α and φ. A possible self-folding pathway is illustrated by seven representative particles represented as orange spheres. The connections between conformations follow the order of their MP values, passing through the “young” and “mature” conformations, indicated by green and blue spheres, respectively. c Schematics of a self-folding landscape, depicting the maturation pathway/process of 6HBC from a “paddle with a stick”-shaped conformation to a “helix bundle”-shaped compact conformation through multiple steps of continuous conformational changes.

References

    1. Li, X. et al. Electron counting and beam-induced motion correction enable near-atomic-resolution single-particle cryo-EM. Nat. Methods10, 584–590 (2013). - PMC - PubMed
    1. Yip, K.M. et al. Atomic-resolution protein structure determination by cryo-EM. Nature 587, 157–161 (2020). - PubMed
    1. Hryc, C. F., Chen, D. H. & Chiu, W. Near-atomic-resolution cryo-EM for molecular virology. Curr. Opin. Virol.1, 110–117 (2011). - PMC - PubMed
    1. Xue, L. et al. Visualizing translation dynamics at atomic detail inside a bacterial cell. Nature610, 205–211 (2022). - PMC - PubMed
    1. Nakane, T. et al. Single-particle cryo-EM at atomic resolution. Nature587, 152–156 (2020). - PMC - PubMed

Publication types