. 2024 Oct 21;15(1):9073.
doi: 10.1038/s41467-024-53459-z.

Computational processes of simultaneous learning of stochasticity and volatility in humans

Affiliations

Computational processes of simultaneous learning of stochasticity and volatility in humans

Payam Piray et al. Nat Commun. .

Abstract

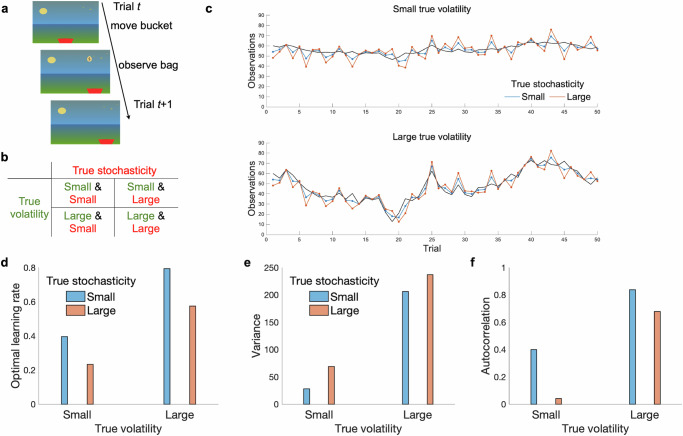
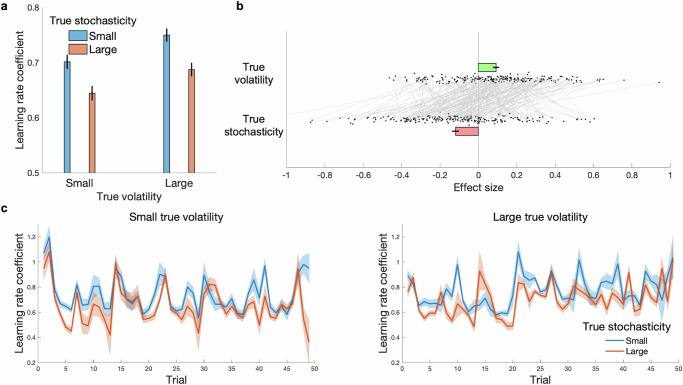
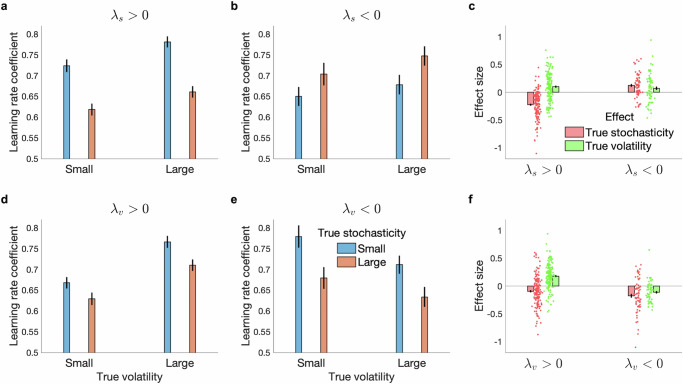
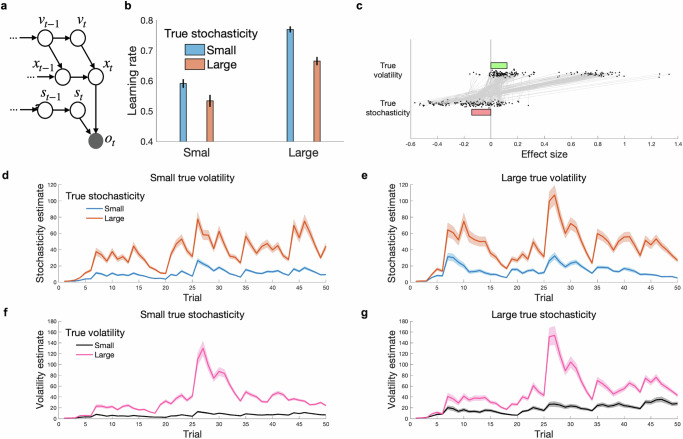
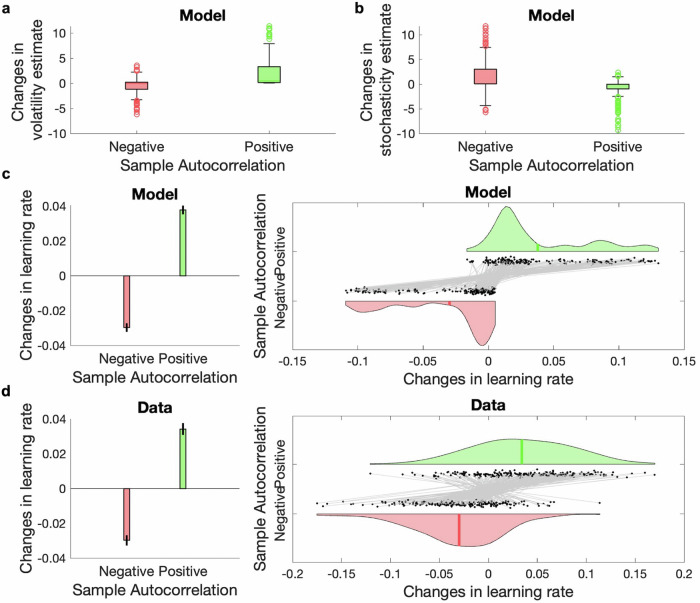
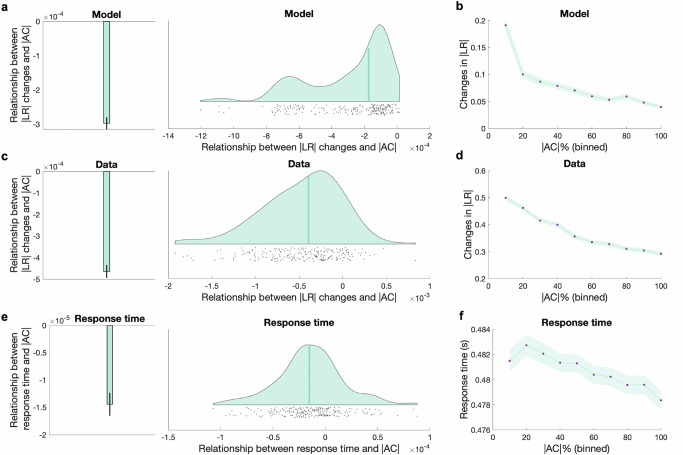
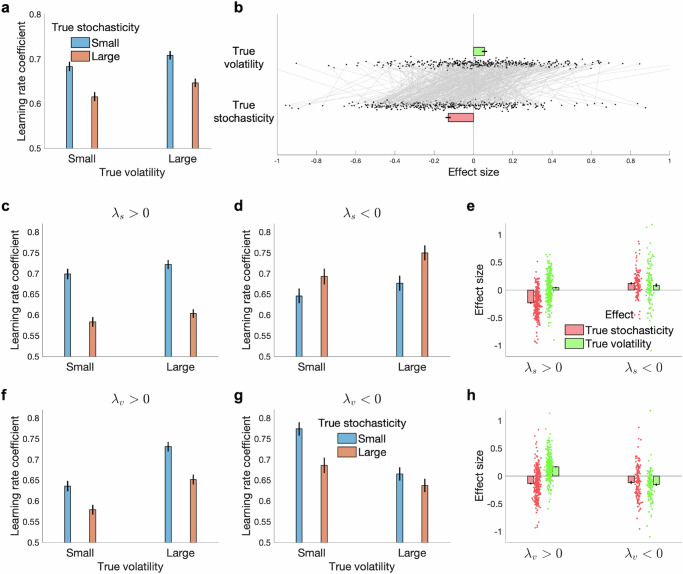
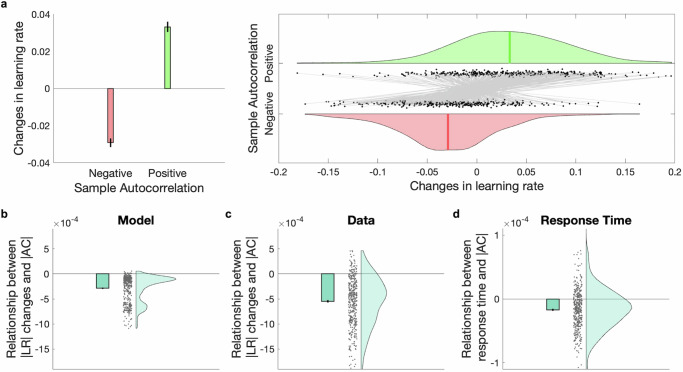
Making adaptive decisions requires predicting outcomes, and this in turn requires adapting to uncertain environments. This study explores computational challenges in distinguishing two types of noise influencing predictions: volatility and stochasticity. Volatility refers to diffusion noise in latent causes, requiring a higher learning rate, while stochasticity introduces moment-to-moment observation noise and reduces learning rate. Dissociating these effects is challenging as both increase the variance of observations. Previous research examined these factors mostly separately, but it remains unclear whether and how humans dissociate them when they are played off against one another. In two large-scale experiments, through a behavioral prediction task and computational modeling, we report evidence of humans dissociating volatility and stochasticity solely based on their observations. We observed contrasting effects of volatility and stochasticity on learning rates, consistent with statistical principles. These results are consistent with a computational model that estimates volatility and stochasticity by balancing their dueling effects.


Conflict of interest statement

The authors declare no competing interests.

Figures

Fig. 1
Fig. 1. The behavioral task.
a On every trial, participants move their bucket to catch bags dropped by an invisible bird. Participants cannot move their bucket when the bag appears on the screen. The task has four blocks with a 2 × 2 factorial design, manipulating both true volatility and true stochasticity. b The task follows a 2 × 2 factorial design with true stochasticity and true volatility as factors, each with two levels: small or large. True volatility determines the variance of diffusion noise in the hidden cause (caused by the bird’s movement), while true stochasticity determines the variance of observation noise (caused by wind). The small and large values of true volatility were 4 and 49, respectively. For true stochasticity, the small and large values were 16 and 64, respectively. c Time-series of observations (i.e., bags) in the task. The black line is the hidden cause (i.e., the bird) that is invisible to participants. d Optimal statistical modeling approach indicates that volatility and stochasticity should have opposite effects on the learning rate in this task. Therefore, adaptive learning requires dissociating volatility from stochasticity. e Both factors increase the variance of observations, which makes their dissociation computationally challenging. f It is possible to dissociate volatility from stochasticity because they have opposite effects on the autocorrelation of observations. While stochasticity reduces the autocorrelation, volatility increases it.
Fig. 2
Fig. 2. Participants dissociate volatility and stochasticity and adjust their learning rate accordingly.
a Mean Learning rate coefficients obtained from the model-agnostic regression analysis are plotted (n = 223). For each block, we regressed the update (in the bucket position) against the prediction error (the difference between the bag and the bucket). The corresponding regression coefficient is the learning rate coefficient in that block. This analysis reveals strong main effects of both factors, in line with model predictions plotted in Fig. 1c. b Main effects of both factors on the learning rate coefficient have been plotted for all participants (n = 223). c Dynamics of learning rate coefficients across all participants suggest that participants update their learning rate dynamically over time based on their observations. Mean and standard error of the mean are plotted in all panels.
Fig. 3
Fig. 3. Computational modeling reveals characteristic patterns of maladaptive learning in subgroups of participants.
ac Learning rate coefficients from the model-agnostic analysis are plotted for two groups of participants with positive (n = 158) and negative (n = 65) sensitivity to stochasticity quantified using the Kalman model. Negative sensitivity to stochasticity does not merely abolish the corresponding effects on the learning rate but reverses them. Moreover, maladaptive stochasticity learners show adaptive behavior with respect to the true volatility factor. df. Learning rate coefficients are plotted for two groups of participants with positive (n = 159) and negative (n = 64) sensitivity to volatility. Similarly, the learning rate coefficients are plotted for two groups of participants categorized by their sensitivity to volatility: one group with positive sensitivity and the other with negative sensitivity to volatility. Negative sensitivity to volatility also goes beyond nullifying the corresponding effects on the learning rate and actually flips them. Moreover, maladaptive volatility learners show adaptive behavior with respect to the true stochasticity factor. Note that the two maladaptive groups do not show substantial overlap, with only 8% of participants exhibiting both types of maladaptively. Mean and standard error of the mean are plotted.
Fig. 4
Fig. 4. The hierarchical particle filter model.
a Structure of the (generative) model: the observation (e.g., the bag) on trial t, ot, is generated based on a hidden cause, xt, (e.g., the bird) plus some independent noise (e.g., wind) whose variance is given by the stochasticity, st. The hidden cause itself depends on its value on the previous trial plus some noise whose variance is given by the volatility, vt. Both volatility and stochasticity are generated noisily based on their value on the previous trial. The learner should infer value of the hidden cause, volatility and stochasticity based on observations. b, c Mean learning rate by the model across participants as a function of the two experimental factors (n = 223). Mean and standard error of mean are plotted in (b). Individual data-points for the two main effects as well as their median are plotted in (c). d, e Dynamics of the stochasticity signal estimated by the model. f, g Dynamics of the volatility signal estimated by the model. Mean and standard error of mean are plotted in (dg).
Fig. 5
Fig. 5. Effects of sample autocorrelation on learning rate.
a, b Effects of two clusters of trials, one with negative sample autocorrelation (i.e., when the product of two recent prediction errors is negative) and another one with positive sample autocorrelation on subsequent changes in volatility estimate, stochasticity estimate. These two clusters have opposite effects on changes in volatility and stochasticity. The box plot displays the median across all participants (n = 223), first and third quartiles, outliers (computed using the interquartile range), and minimum and maximum values that are not outliers. c These two clusters have opposite effects on changes in the model’s learning rate. Learning rate decreases following negative sample autocorrelation, indicating that the experienced noise on those trials is primarily caused by stochasticity. The opposite is true for trials with positive sample autocorrelation, in which the learning rate increases. d Model-agnostic analysis revealed that participants’ learning rates calculated independently of the model based on the trial-by-trial bucket position show similar effects. There is a significant reduction in learning rate for the negative cluster, and a significant increase in learning rate for the positive cluster. Mean and standard error of the mean are plotted in (c, d) (n = 223) alongside data points, the empirical distribution and the mean.
Fig. 6
Fig. 6. The model evaluates evidence to attribute experienced noise to volatility vs. stochasticity.
a Regression coefficients are plotted for the relationship between trial-by-trial sample outcome autocorrelation magnitude, |AC | , and changes in model’s learning rate magnitude, |LR | . The trial-by-trial sample outcome autocorrelation magnitude, |AC | , is negatively related to changes in learning rate magnitude, |LR | . This occurs because the model evaluates evidence to attribute experienced noise to either volatility or stochasticity, a process more consequential for smaller, near-zero values of |AC | . b Changes in |LR| as a function of |AC| are plotted for 10% quantiles. c, d A similar effect to that in (a, b) was found in model-agnostic trial-by-trial learning rate data. e Trial-by-trial response time data show a negative relationship with |AC | , suggesting that trials with smaller |AC| are more challenging, presumably because identifying the noise source is more difficult on these trials. f Response time as data a function of |AC| are plotted for 10% quantiles. In (a, c, e), the mean, standard error of the mean, individual data points, empirical distribution, and median are plotted for all participants (n = 223). In (b, d, f), the mean and standard error of the mean across all participants are plotted.
Fig. 7
Fig. 7. Adaptive and maladaptive patterns of behavior were replicated in Experiment 2.
a, b Learning rate coefficients obtained from the model-agnostic regression analysis (n = 420). This analysis revealed significant effects of true stochasticity (t(419) = –9.65, P < 0.001, %95 Confidence Interval = (−0.0778, −0.0515)) and true volatility (t(419) = +4.15, P < 0.001, %95 Confidence Interval = (0.015, 0.041)) and no significant interaction (t(419) = +0.50, P = 0.62, %95 Confidence Interval = (−0.009, +0.015)). The main effects are plotted in (b). ce Learning rate coefficients from the model-agnostic analysis are plotted for two groups of participants with positive and negative sensitivity to stochasticity quantified using the Kalman model. Maladaptive learners of one factor generally remained adaptive with respect to the other factor. Specifically, the group with negative λs (n = 121, 29% of participants) showed significantly adaptive learning rate with respect to true volatility (t(120) = +2.87, P = 0.005, %95 Confidence Interval = (0.027, 0.145)). fh Learning rate coefficients from the model-agnostic analysis are plotted for two groups of participants with positive and negative sensitivity to volatility quantified using the Kalman model. Maladaptive volatility learners also were adaptive with respect to stochasticity. The group with negative λv (n = 141, 33% of participants) showed significantly adaptive lower learning rate coefficients with increases in true stochasticity (t(140) = −4.66, P < 0.001, %95 Confidence Interval = (−0.162, −0.065)). Mean and standard error of the mean are plotted. Two-sided t-tests are reported. See also Supplementary Tables 10–12.
Fig. 8
Fig. 8. Learning process of volatility and stochasticity in Experiment 2.
a Effects of sample autocorrelation on learning rate in Experiment 2. Analysis of two clusters with negative and positive sample autocorrelation revealed that the learning rate increases following positive sample autocorrelation (t(419) = +12.0, P < 0.001, %95 Confidence Interval = (0.028, 0.039)) and decreases following negative sample autocorrelation (t(419) = −12.4, P < 0.001, %95 Confidence Interval = (−0.034, −0.025)). This was seen in both the model learning rate and the model-agnostic learning rate, which was estimated independently of the model based on trial-by-trial behavioral data. The bar plot on the left shows the mean and standard error of the mean, and the plot on the right shows individual data points across all participants. b, c The relationship between magnitude of sample outcome autocorrelation |AC| and magnitude of changes in learning rate in Experiment 2 is negative for both the model and the model-agnostic learning rate (t(419) = −23.0, P < 0.001, %95 Confidence Interval = (−5.9546e-04, −5.0165e-04)). d Trial-by-trial response time shows a negative relationship with |AC | , suggesting that trials with smaller |AC| are more challenging, presumably because identifying the noise source is more difficult on these trials (t(419) = −10.5, P < 0.001, %95 Confidence Interval =  (−2.0335e-05, −1.3930e-05)). Mean and standard error of the mean are plotted in (ad), alongside individual data points and their empirical distribution. Two-sided t-tests are reported. See also supplementary Tables 13.

Similar articles

Cited by

References

    1. Dayan, P. & Long, T. Statistical Models of Conditioning. 10, 117–123 (1998).
    1. Dayan, P., Kakade, S. & Montague, P. R. Learning and selective attention. Nat. Neurosci.3, 1218–1223 (2000). - PubMed
    1. Courville, A. C., Daw, N. D. & Touretzky, D. S. Bayesian theories of conditioning in a changing world. Trends Cognit. Sci.10, 294–300 (2006). - PubMed
    1. Daunizeau, J. et al. Observing the observer (I): meta-bayesian models of learning and decision-making. PLoS ONE5, e15554 (2010). - PMC - PubMed
    1. Gershman, S. J., Blei, D. M. & Niv, Y. Context, learning, and extinction. Psychol. Rev.117, 197–209 (2010). - PubMed

Publication types

LinkOut - more resources