. 2024 Oct 21;14(1):24756.
doi: 10.1038/s41598-024-70876-8.

High-resolution transcranial optical imaging of in vivo neural activity

Affiliations

High-resolution transcranial optical imaging of in vivo neural activity

Austen T Lefebvre et al. Sci Rep. .

Abstract

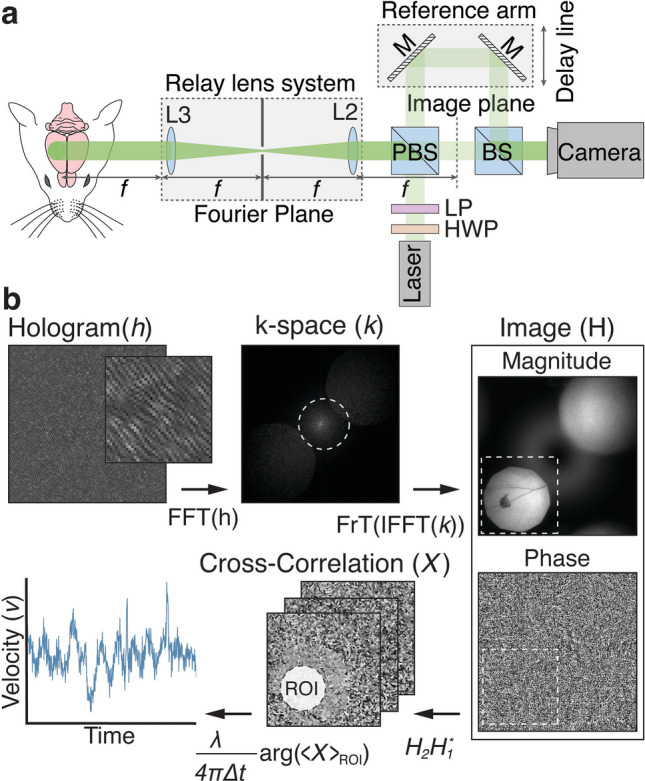
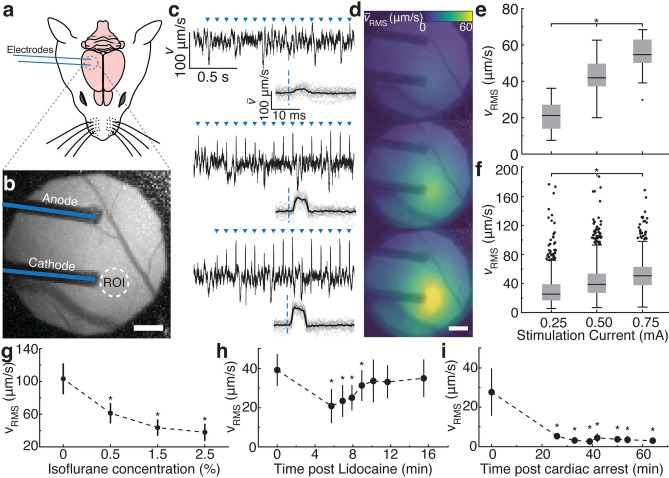
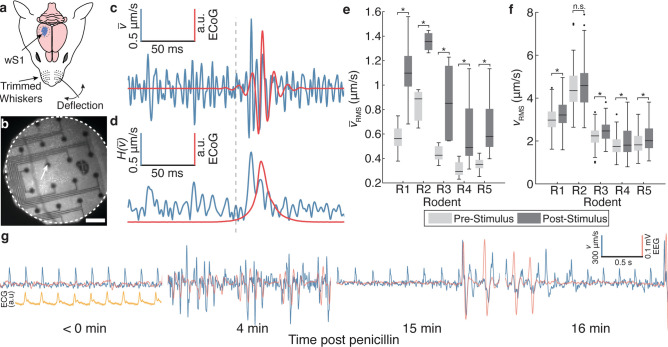
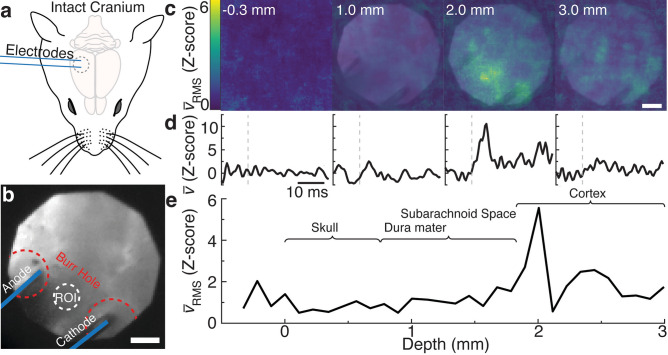
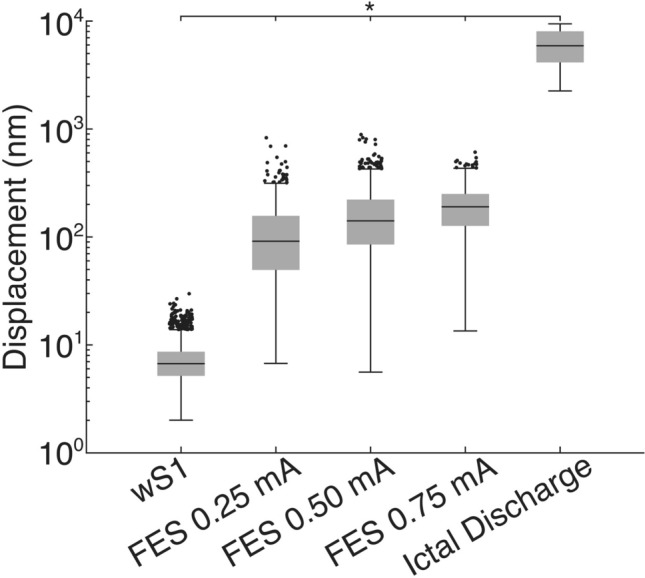
Rapid sub-nanometer neuronal deformations have been shown to occur as a consequence of action potentials in vitro, allowing for optical registration of discrete axonal and synaptic depolarizations. Such optically-measured deformations are a novel signature for recording neural activity. We demonstrate this signature can be extended to in vivo measurements through recording of rapid neuronal deformations on the population level with holographic, optical phase-based recordings. Our system demonstrates, for the first time, non-invasive recordings of in vivo tissue deformation associated with population level neuronal activity, including through-skull. We confirmed this technique across a range of neural activation models, including direct epidural focal electrical stimulation, anesthetic-induced cortical deactivation, activation of primary somatosensory cortex via whisker barrel stimulation, and pharmacologically-induced seizures. Collectively, we show holographic imaging provides a pathway for high-resolution, label-free, non-invasive recording of transcranial in vivo neural activity at depth, making it highly advantageous for studying neural function and signaling.


Conflict of interest statement

DWB is listed as an inventor on U.S. patent “Coherent optical imaging for detection of neural signatures and medical imaging applications using holographic imaging techniques” (no 10,413,186, published September 17, 2019). All other authors do not possess any conflicts of interest.

Figures

Fig. 1
Fig. 1
Overview of digital holographic imaging (DHI) system, image reconstruction and velocity calculation. (a) DHI system schematic. L = lens, PBS = polarizing beam splitter, BS = beam splitter, M = mirror, HWP = half wave plate, LP = linear polarizer. A collimated laser is incident on a PBS. The reflected beam illuminates the sample forms an image behind the PBS through a lens system. The reference beam transmits directly through the PBS, into a variable-length delay line and combines with the object light via a 10/90 BS. A camera FPA records a hologram. (b) Reconstruction overview to compute target velocity. A Fourier transform (FFT) is applied to the hologram for conversion to k-space and filtered at a cutoff frequency (dashed line) to mitigate the DC term. The complex image with magnitude and phase is reconstructed by applying an inverse FT (IFFT) and Fresnel transform (FrT) and subsequently cropped to an area containing the real image (dashed line). A cross-correlation image between time subsequent time points is computed without a spatial shift and a processing region-of-interest (ROI) is defined. The average velocity within the ROI is computed by spatially averaging complex pixels in the ROI and scaling by wavelength (λ) and sampling interval (Δt) to convert from radians to units of velocity.
Fig. 2
Fig. 2
Cortical tissue velocity following focal epidural electrical stimulation (FES). (a) Rodent schematic setup for FES showing electrodes placed on top of dura mater. (b) Average magnitude image of the cortex with electrodes (blue lines) and ROI (white dotted circle) identifies the pixels averaged for the velocity waveforms. Scale bar, 0.5 mm. (c) Velocity waveforms at (top) 0.25 mA, (middle) 0.50 mA, and (bottom) 0.75 mA FES current with FES onset indicated by blue triangles. Insets show the velocity with stimulus-locked averaging (SLA) (n = 30 events; black line). (d) Maps of the Root mean square (RMS) velocity with SLA (n = 30 events) within 10 ms following FES for (top) 0.25 mA, (middle) 0.50 mA, and (bottom) 0.75 mA FES current, computed using a 0.5 mm diameter sliding window. Average magnitude image is overlaid with transparency on the velocity map. (e) RMS velocity within 10 ms following FES for rodent shown in C and D (n = 30). (f) RMS velocity for multiple rodents (0.25 mA: n = 617 stimulations for 6 rodents; 0.50 mA: n = 1,118 stimulations for 11 rodents; 0.75 mA: n = 1,160 stimulations for 7 rodents). Box plots indicate the median (black line), 25% and 75% quantiles (gray box), non-outlier extrema (whiskers), and outliers defined as 1.5 times the interquartile range (black circle). *p < 0.05 (Kruskal–Wallis with post-hoc Dunn–Šidák correction for multiple comparisons). RMS velocity within 10 ms following administration of (g) Isoflurane and (h) Lidocaine, and (i) induction of cardiac arrest. Results are shown as mean (black circle) ± standard deviation from n = 30 FES events. *p < 0.05 (one-way ANOVA with post hoc Dunn–Šidák correction for multiple comparisons).
Fig. 3
Fig. 3
Cortical tissue velocity associated with intrinsically evoked neural activity. (a) Rodent setup for single whisker deflection and primary barrel cortex (wS1) imaging. (b) Magnitude image of wS1 with epidural ECoG grid. Scalebar, 0.5 mm. (c) Velocity with SLA and corresponding (d) Hilbert envelope (n = 50 stimulations; blue) overlayed with ECoG waveforms (n = 50 stimulations; red) from electrode indicated by white arrow in (b). (e) RMS velocity with SLA for 5 rodents (R1: n = 9; R2: n = 3; R3: n = 7; R4: n = 21; R5: n = 13) computed 25 ms pre-stimulus (light gray) and 25 ms post-stimulus (dark gray). Each data in the box is computed from 30 stimulus-locked events. (f) Corresponding pre- and post-stimulus RMS velocity without event averaging for 5 rodents (R1: n = 296; R2: n = 99; R3: n = 210; R4: n = 634; R5: n = 399) .*p < 0.05 (Mann–Whitney U test). (g) Velocity (blue) and EEG (red) waveforms for a rodent before and 4 min, 15 min, and 16 min after application of topical penicillin on rodent dura mater to induce seizure. Inset in (g) shows the associated electrocardiogram (ECG; orange) waveform.
Fig. 4
Fig. 4
Transcranial cortical tissue velocity following FES. (a) Schematic of the rodent setup showing through-cranium electrode placement for FES at 0.75 mA. (b) Average magnitude image of the cortex showing the placement of electrodes (indicated by blue lines) in contact with the dura mater through burr holes made in the cranium (perimeter indicated by red dotted circles). The ROI (white dotted circle) identifies the pixels averaged together to obtain the velocity waveforms for (d) and (e). (c) Maps of the RMS velocity with SLA (n = 30 events) with pre-stimulus Z-score normalization following FES for imaging depth of − 0.3 to 3 mm (left to right). Maps were computed using a 0.5 mm diameter sliding window. The average magnitude image is overlaid with transparency on the velocity map. Scale bar, 0.5 mm. (d) Pre-stimulus Z-score normalized velocities with SLA (n = 30 events) with FES onset denoted as a vertical dashed line for depth shown in (e). (e) RMS velocity with SLA (n = 30) with pre-stimulus Z-score normalization for ROI shown in (b) as a function of depth with the approximate ranges of depth for the anatomical layers shown. Reported depths are relative to the surface of the cranium.
Fig. 5
Fig. 5
Total tissue displacement across a range of neural stimulation paradigms. wS1: n = 1638; FES 0.25 mA: n = 617; FES 0.50 mA: n = 1,118; FES 0.75 mA: n = 1,60; Ictal Discharge: n = 20. *p < 0.05 (Kruskal–Wallis with post-hoc Dunn–Šidák correction for multiple comparisons).

References

    1. Torricelli, A. et al. Neurophotonics: Non-invasive optical techniques for monitoring brain functions. Funct. Neurol.29, 223–230 (2014). - PMC - PubMed
    1. Toi, P. T. et al. In vivo direct imaging of neuronal activity at high temporospatial resolution. Science378, 160–168 (2022). - PubMed
    1. Martini, M. L. et al. Sensor modalities for brain–computer interface technology: A comprehensive literature review. Neurosurgery86, E108–E117 (2020). - PubMed
    1. Hill, D. K. & Keynes, R. D. Opacity changes in stimulated nerve. J. Physiol.108, 278–281 (1949). - PubMed
    1. Cohen, L. B., Keynes, R. D. & Landowne, D. Changes in axon light scattering that accompany the action potential: current-dependent components. J. Physiol.224, 727–752 (1972). - PMC - PubMed

LinkOut - more resources